The explosion of decentralized finance (DeFi) is revolutionising how borrowing and lending operate, with no intermediaries, just protocols running on blockchains. Today, we’re seeing both retail and institutional players use these systems, for example, a hedge fund taking out a stablecoin-denominated loan against ETH in order to leverage market exposure, or a small investor locking collateral to earn yield via a lending pool. In this article, we dive into the numbers behind lending protocols, uncovering key trends, risks, and opportunities in this fast-moving space.
Editor’s Choice
- In Q2 2025, crypto-collateralized lending grew by $11.43 billion (≈27.4%), reaching a total market size of $53.09 billion (CeFi + DeFi + CDP stablecoins).
- As of July 1, 2025, the total value locked (TVL) in DeFi lending stood at approximately $54.21 billion, and seven-day fees across the space were $74.5 million.
- Total DeFi lending volume jumped ~55% to a high of $41 billion by Q3 2025.
- In 2025, the DeFi lending market held approximately 43% of total DeFi TVL, lending-protocol TVL at $89 billion, with lending’s share ~43%.
- In 2025, the average user deposit into DeFi lending protocols reached about $2,800, reflecting increased user trust and participation.
Recent Developments
- On-chain lending now dominates the crypto-credit market. By Q3 2025, lending apps made up more than 80% of on-chain borrowing, up from ~48.6% in Q4 2021.
- DeFi lending volume increased ~55% within the year, reaching around $41 billion.
- Regulatory frameworks tightened, regulators such as the Financial Conduct Authority (UK) have issued guidance covering crypto-asset lending and borrowing, including DeFi.
- Institutional adoption grew, and a rising share of DeFi lending TVL (11.5% in one estimate) came from institutional capital in 2025.
- Cross-chain and layer-2 activity expanded, Layer-2 networks like Arbitrum and Optimism saw user growth of ~85% in 2025 for lending protocols.
DeFi Lending Activity by Blockchain (Ethereum, Solana, Layer-2s, etc.)
- DeFi lending applications led Q3 2025 with 55.7% market share, followed by CeFi at 33.12% and CDPs at 11.18%.

- Approximately 77% of total value locked (TVL) in DeFi lending protocols was on Ethereum in 2025.
- The combined TVL on Solana and Polygon reached about $9.6 billion in 2025.
- User addresses for lending on Layer-2 networks increased by around 85% year-over-year in 2025.
- DeFi lending users globally surpassed 7.8 million in 2025, with a 26% year-on-year growth.
- 63% of DeFi borrowers in 2025 were repeat users, indicating strong platform trust.
- Institutional capital contributed approximately 11.5% of total TVL in DeFi lending in 2025.
- Hybrid DeFi/CeFi platforms saw a growth of 24% in 2025, bridging regulated and decentralized finance.
Stablecoins in DeFi Lending Collateral
- As of May 2025, the combined market capitalization of major stablecoins exceeded $230 billion.
- In Q1 2025, the share of loans collateralized by stablecoins in on-chain lending protocols was estimated at roughly 20.12% of the total crypto-collateralized lending market.
- In September 2025, active on-chain loans backed by stablecoins averaged $14.8 billion, with a borrowing APR of around 6.7%.
- Stablecoins are increasingly used as collateral because they mitigate volatility risk compared to purely crypto-collateralised assets.
- Since early 2025, the yield premium on stablecoin lending vs equivalent USD bank deposits has grown by approximately 400 basis points.
- Despite stablecoins’ growing role, there are still over-collateralization requirements in DeFi; many lenders require stablecoin collateral at 150–180% ratios.

DeFi Market Revenue Growth
- 2019: DeFi market revenue was $0.55 million. This marked the beginning of decentralized finance’s measurable monetization.
- 2020: Revenue jumped to $24.11 million, a massive early leap. The DeFi ecosystem began gaining traction among early adopters.
- 2021: Revenue exploded to $6.21 billion. This surge reflected widespread yield farming and liquidity mining adoption.
- 2022: Revenue dipped slightly to $5.43 billion. The market cooled after the overheated 2021 rally.
- 2023: DeFi rebounded to $17.74 billion in revenue. Renewed interest and protocol innovation drove growth.
- 2024: Revenue climbed to $26.17 billion, continuing the rebound. This was fueled by institutional DeFi interest and cross-chain expansion.
- 2025: Revenue reached $31.54 billion, crossing a major milestone. The sector matured with more sustainable lending and staking models.
- 2026: Revenue rose to $34.15 billion. Growth slowed but remained strong amid rising user adoption.
- 2027: Revenue increased again to $36.02 billion. Layer-2 integration and real-world asset tokenization contributed to expansion.
- 2028: Projected revenue is $37.04 billion. Growth plateaus slightly as the market stabilizes after years of rapid scaling.

Collateral Composition Across DeFi Lending Protocols
- The average collateralization ratio across protocols in 2025 ranged around 150% to 180%.
- Some protocols were offering collateralization ratios as low as 110%, indicating increased risk exposure.
- Stablecoins as a share of total collateral in lending pools are rising, but global averages vary significantly by protocol and chain.
- Protocols like Aave and Compound now allow for a variety of collateral types, including stablecoins, major cryptocurrencies, and tokenised real-world assets, altering overall composition.
- In Q3 2025, total crypto-collateralised lending reached $73.59 billion, up ~38.5% quarter-on-quarter, indicating increased collateral deployment across protocols.
Average Collateralization Ratios in DeFi Lending
- Over-collateralization ratios in DeFi lending dropped from 163% in 2024 to about 151% in 2025.
- The average collateralization ratio across major protocols was around 157% in 2025.
- Some protocols, like Liquity, allow minimum collateral ratios as low as 110%, increasing risk exposure.
- Collateralization ratios vary by asset volatility, with highly volatile tokens requiring over 180% collateral.
- Stablecoins and blue-chip assets often have lower ratios closer to 130% – 150%.
- Improved risk management in protocol upgrades reduced average required collateral ratios by about 5-8% year-over-year.
- During market stress, collateralization ratios typically rise by 10-25% as liquidations force excess collateral.
- Ethereum-based lending pools maintain an average collateralization of around 160%, higher than some Layer-2 and alternative blockchains.
- Governance influences collateral ratios: borrower-dominated protocols tend to have average ratios near 140%, liquidity-provider-dominated closer to 170%.
- Cross-blockchain differences lead to collateralization ratios ranging between 130% and 180% depending on protocol design and liquidity.
Top DeFi Lending Platforms Market Share
- MakerDAO leads with 28% market share, driven by the continued dominance of the DAI stablecoin.
- Compound holds 24% while Aave commands 21%, with Aave boosted by multi-chain flash loans.
- Uniswap and Curve secure 6% and 5% market share, expanding into lending from their DEX origins.
- Venus Protocol maintains top status on BSC with $4.2 billion TVL in 2025.
- TribeDAO captures a 3.5% share, benefiting from community governance and flexible lending terms.
- The top five (MakerDAO, Compound, Aave, Uniswap, Curve) account for a dominant 84.5% of the market.
- Stargate and other cross-chain lenders manage a combined $2.4 billion TVL, enabling multi-chain interoperability.

DeFi Lending Interest Rates and Yields
- Average lending interest rates in DeFi for 2025 fall between 6.8% and 13.5%.
- Borrowing APRs for stablecoins averaged 6.7% in September 2025.
- Stablecoin lending in DeFi offered rates approximately 400 basis points (4%) higher than the U.S. federal funds rate in early 2025.
- Stablecoin borrowing rates on major protocols sometimes exceeded 15%.
- Yield for lenders in DeFi lending pools varies significantly by asset and protocol; some pools reported returns surpassing 10%.
Comparison of DeFi Lending Rates vs CeFi and TradFi
- In Q3 2025, lending via decentralized finance (DeFi) borrowing apps held 62.71% of crypto-collateralized lending, up from 59.83% at the end of Q2.
- Total crypto-collateralized lending reached $73.59 billion in Q3 2025, a +38.5% quarter-on-quarter increase.
- Centralized finance (CeFi) crypto lending venues captured only 33.12% of the market by the end of Q3 2025.
- Average DeFi lending interest rates in 2025 ranged between ~6.8% and 13.5% for borrowers.
- Traditional finance savings rates in the U.S. hovered near 4.5% around mid-2025, giving DeFi a yield premium of around 200-500 basis points for depositors.
- CeFi crypto lending often charges higher rates or applies stricter terms, with stablecoin borrowing APR around 6.7% in DeFi.
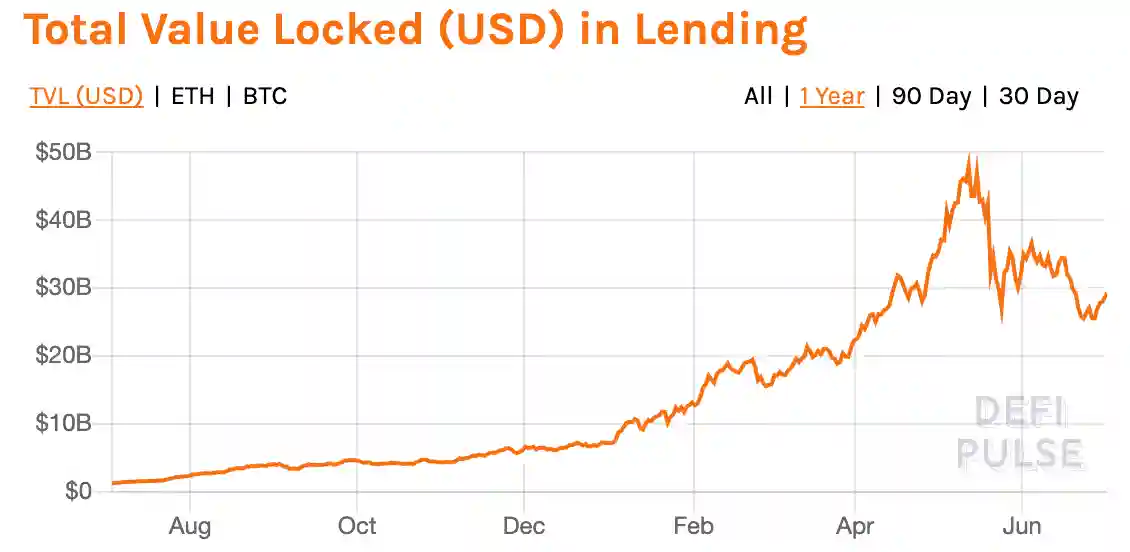
DeFi Lending Market: TVL Growth Highlights
- Started the year with $1 billion TVL, marking a modest baseline for growth.
- By August, TVL climbed to $3 billion, signaling strong early momentum.
- December closed with $7 billion TVL, confirming steady year-end growth.
- A major surge in February pushed TVL past $20 billion for the first time.
- April hit the yearly peak with TVL nearing $47 billion, the highest point recorded.
- May saw volatility, with TVL fluctuating between $30 billion–$40 billion.
- By June, the market stabilized slightly, ending with $30 billion in TVL.
DeFi Borrowing Volumes and Outstanding Debt
- Open borrows on DeFi platforms in Q4 2024 were about $19.1 billion, nearly double CeFi’s ~$11 billion.
- In June 2025, total value locked (TVL) in DeFi lending stood at approximately $54.21 billion.
- By July 2025, the total lending market TVL reached nearly $65 billion, and outstanding loans exceeded $25 billion.
- Q3 2025 saw cryptocurrency-collateralized lending expand by $20.46 billion to a new high of $73.59 billion.
- The rate of growth in borrowing volumes in DeFi outpaced CeFi, reflecting the willingness of users to borrow on-chain and leverage collateral.
- Institutional adoption is rising, and institutional capital makes up ~11.5% of DeFi TVL.
Supply vs Borrow Ratios Across DeFi Lending Markets
- Supply-to-borrow ratios in DeFi protocols generally range between 30% and 70% in 2025.
- Stablecoin pools show higher utilisation, often exceeding 65%, compared to alt-asset pools below 45%.
- A typical supply APY of around 4% supports a borrow APR between 8% and 10% in many protocols.
- Layer-2 networks exhibit borrow ratios that are approximately 15-20% higher than their supply counterparts.
- Protocol upgrades have improved supply-borrow efficiency by about 10-12% year-over-year.
- Heavily overcollateralized pools display supply-to-borrow ratios below 35% due to excess collateral.
- During market downturns, utilisation rates can fall to under 25%, reducing borrowing demand significantly.
- Monitoring supply vs borrow ratios is critical, as pools with ratios above 70% tend to see rising interest rates.
- DeFi lending markets saw a total outstanding borrowing volume of approximately $26.47 billion in 2025.
- Ethereum holds about 81% of the total supply liquidity in DeFi lending as of mid-2025.
DeFi Lending Liquidations and Risk Metrics
- DeFi losses in 2025 dropped to about $1.1 billion due to stronger protocol controls.
- Flash-loan attacks caused 58% of all DeFi sector losses in 2025.
- Cross-chain bridge hacks accounted for approximately $620 million in losses in 2025.
- Protocol upgrades to v3 have lowered liquidation risks compared to v2 versions.
- Borrow positions with narrow collateral margins face a liquidation risk exceeding 70% during volatile periods.
- Analysis of 25,798 liquidation events (March 2022-Dec 2024) shows that many borrowers resume borrowing after liquidation.
- Volatile collateral assets experience liquidation thresholds up to 20% higher than stable assets.
- Governance protocols now include dynamic liquidation thresholds and larger safety modules, reducing systemic risk by roughly 15%.
- Liquidations on Layer-2 v3 protocols resulted in improved revenue outcomes, with a 10% increase compared to L1 protocols.
- DeFi liquidations peaked in February 2025, with nearly 1 billion calls, indicating high market stress points.
DeFi Lending Protocol Revenue and Fee Generation
- On-chain fees in H1 2025 totaled about $9.7 billion, up 41% year-on-year. DeFi accounted for ~63% of those fees.
- On-chain fees for the full year 2025 are projected at about $19.8 billion, a ~35% year-on-year increase.
- Revenue for lending protocols in H1 2025 was around $700 million.
- The lending aggregator Morpho increased its fee share to 10% by H1 2025.
- Lending protocols remain among the highest revenue-generators in DeFi.
- The growth in revenue is tied to increasing usage, more volume, and improved capital efficiency.
- A digital asset manager reported Q3 2025 revenues of $22.5 million, with lending and staking income of $7.4 million.
Frequently Asked Questions (FAQs)
Lending applications represented more than 80% of the on-chain borrowing market, while CDPs made up ~16%.
Crypto-collateralised lending reached a new all-time high of $73.59 billion (up ~38.5% quarter-on-quarter).
DeFi lending apps held ~62.71% of the market share, with CeFi venues around 33.12%.
Around 78% of lending platforms provided live collateral data in 2025.
Conclusion
The lending segment of the decentralised finance ecosystem is showing strong growth, higher yields, and deepening maturity compared to earlier cycles. Key contrasts with CeFi and TradFi include broader access, algorithmic rate setting, and innovative collateral models. Borrowing volumes and outstanding debt are at record highs, while supply versus borrow ratios reflect advanced pool management and deeper liquidity.
On the risk side, protocols are better-equipped to handle liquidations and attacks, though volatility and collateral composition remain ongoing concerns. Revenue-generation signals that lending is no longer experimental; it is a core pillar of DeFi. For U.S. audiences and global stakeholders alike, the message is clear: the lending protocols in DeFi are evolving into institutional-grade infrastructure.