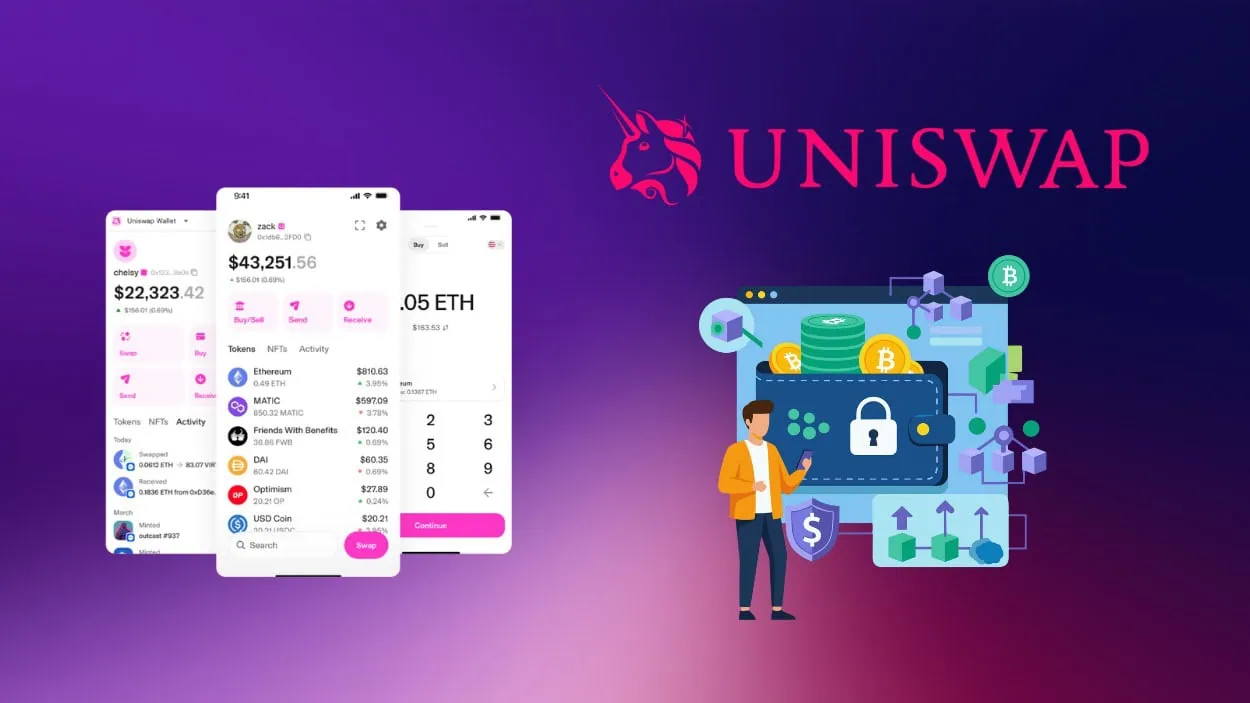






Uniswap stands as one of the leading decentralized exchanges (DEXs) in the crypto ecosystem, enabling peer‑to‑peer swaps without intermediaries. Since its launch in 2018, it has redefined how traders, liquidity providers, and decentralized finance (DeFi) participants interact with digital assets. Its influence extends from mainstream DeFi adoption to Layer 2 scaling innovations like Unichain, influencing trading behavior and capital allocation across networks.
In real terms, millions of users rely on Uniswap every month to swap tokens or earn fees, and developers build automated market maker (AMM) products atop its protocol. With its governance token UNI shaping economic parameters, Uniswap remains a vital barometer of the broader DeFi landscape.
Editor’s Choice
- Uniswap’s combined Total Value Locked (TVL) reached roughly $4.0 billion across chains in late 2025.
- Uniswap v4 surpassed $1 billion TVL within ~177 days of launch.
- Uniswap processes over $148 billion in 30‑day trading volume across 36 chains.
- UNI token trades near $5 – $6 range, with a market cap of around $3.6 billion.
- Cumulative DEX volume on Uniswap exceeds $3.4 trillion historically.
- Average 7‑day DEX volume recently ~ $24 billion with Uniswap dominance.
- Layer 2 activity accounts for over 65 % of daily volume on Uniswap.
Recent Developments
- Governance passed the UNIfication proposal with 99.9% support, redirecting over $1.05 billion in 2025 fees via a new fee switch and burn model.
- The first major burn event removed about $596 million in UNI from circulation as the fee switch went live, tightening token supply and boosting on-chain activity.
- Monthly DEX trading volume hit a record $116.6 billion in October 2025, positioning Uniswap to sustain annualized volumes near the $1 trillion threshold.
- Uniswap v4 surpassed $100 billion in cumulative trading volume and $1 billion in TVL by mid-2025, while still handling only around 30% of Uniswap trades.
- Uniswap v3 continued to dominate with roughly 60% of protocol trade flow as v4’s hooks and custom pools rapidly onboarded new markets.
- Total Uniswap TVL climbed to roughly $5.76 billion, with Ethereum holding about $4 billion and Unichain contributing over $532 million.
Index Performance Snapshot
- SUI led the index with a +1.1% gain, making it the top-performing asset during the period.
- POL followed closely, posting a +0.8% increase, signaling continued investor interest.
- DOT recorded a +0.3% rise, standing out as the third and final asset in positive territory.
- Only three assets in the CoinDesk 20 posted gains, highlighting broad market weakness.
- Bitcoin (BTC) declined by -0.5%, underperforming relative to some large-cap peers.
- The CoinDesk 20 Index (CD20) itself fell -0.5%, reflecting overall negative market momentum.
- Ethereum (ETH) dropped -0.8%, showing increased pressure on major smart contract platforms.
- Avalanche (AVAX) slipped -0.9%, continuing its short-term downward trend.
- NEAR and XLM both fell -1.1%, placing them among the weakest performers.
- HBAR declined -1.4%, signaling notable selling pressure.
- Uniswap (UNI) was the worst-performing asset, plunging -1.5% during the session.
- More than 80% of constituents ended in the red, underscoring a risk-off trading environment.
- Losses were concentrated across Layer 1 networks, DeFi tokens, and infrastructure assets, indicating broad-based selling.

Uniswap Key Statistics Overview
- Total historical DEX volume on Uniswap sits above $3.45 trillion.
- Market cap for UNI has hovered near $3.6 billion as of late 2025.
- UNI’s 24‑hour trading volume often exceeds $300 million.
- DEX volume share has crossed 60 % on Layer 2 networks.
- Active addresses and daily transaction numbers in the tens of thousands, indicating strong network activity.
- Average 30‑day fees and revenue metrics remain in the tens of millions USD.
- All‑time UNI price high was near $44.92, with lows around $1.03.
- FDV (fully diluted valuation) has sat near $5 billion.

Transaction and Swap Activity Statistics
- Uniswap processes over 50 million transactions across L1 and L2 networks analyzed.
- Ethereum snapshot shows 1.43 million daily transactions, up 8% QoQ.
- Daily swaps typically count into the tens of thousands, signifying robust frequency.
- Layer 2 networks account for 67% of v4 transaction volume.
- Uniswap v4 captures ~30% of all trades while v3 handles 60%.
- Unichain handles nearly 50% of v4 transaction volume.
- Peak activity aligns with market volatility, boosting swap frequency.
- 72% of TVL on L2 reflects a sharp rise in Layer 2 transaction counts.
Total Value Locked Statistics
- Combined TVL across protocols stands at $140.6 billion.
- Ethereum mainnet holds the majority of DeFi TVL at over $70 billion.
- Base TVL contribution reaches $4.7 billion, while Arbitrum is at $3 billion.
- Uniswap v4 maintains TVL above $1.6 billion post-launch.
- Layer 2 networks account for $38 billion TVL, a rising share of the total.

Trading Volume Statistics
- Uniswap’s recent 7-day DEX volume reached $26.463 billion.
- 30-day trading volume hits $88.756 billion across all supported chains.
- Annualized volume trends exceed $1 trillion based on current activity.
- Weekly trading sum consistently surpasses $25 billion levels.
- Daily trading volume frequently tops $2.4 billion.
- DEX spot trading volume dominance at 24.1% of total crypto volume.
- Volume share across Layer 2 exceeds 67.5% of total activity.
- Cumulative DEX volume approaches $3 trillion across the protocol’s lifetime.
User and Wallet Statistics
- Over 6.3 million wallets have interacted with Uniswap, reflecting widespread DeFi engagement.
- 50% of users now transact via Base, highlighting Layer 2-driven engagement.
- Daily active users typically range in the tens of thousands across chains.
- Monthly active users indicate sustained engagement among holders and traders.
- 35,000 new wallets per day swap on Uniswap during average periods.
- A significant share of wallet activity occurs on Layer 2 networks, attracting new users.
- The core cohort of users conducts the majority of on-chain activity per active to total wallet ratio.
- Wallet growth correlates with DeFi interest, rising 7% to 431,200.
Liquidity Pool Statistics
- Uniswap hosts over 2,500 active liquidity pools supporting ERC-20 pairs across Ethereum and Layer 2 chains.
- Uniswap v3 pools dominate with 2,527 tracked pools and 2.785 billion TVL.
- v4 adoption accelerates with 4,689 pools tracked and an average APY of 56.43%.
- Over 2,689 tracked pools across v3 and v4 versions enable diversified liquidity.

- Uniswap v4 processes a cumulative 72.586 billion in trading volume across pools.
- Liquidity providers earn fees across tiers like 0.05%, 0.3%, and 1% proportional to contribution.
- ETH/USDC pool maintains liquidity depth with 988.43 thousand 24h volume and 36.78 million TVL.
- Base pools hold 501.46 million TVL, while Arbitrum at 335.99 million, driven by low gas costs.
- 90% of the largest liquidity providers change positions within a month, showing dynamic activity.
UNI Token Price Statistics
- UNI token price trades at $5.49 as of January 9.
- 24-hour trading volume reaches $374.86 million on major exchanges.
- 24-hour range fluctuates between low $5.43 and high $5.79.
- All-time high price recorded at $44.92 in 2021.
- All-time low price stands at $1.03 during early downturns.
- January forecasts project a maximum $7.79 with a minimum $5.48.
- 24-hour change shows a decline of -4.71% from recent levels.
- Market capitalization totals $3.48 billion with a circulating supply of 634.74 million UNI.
Market Capitalization Statistics
- UNI market cap stands at $3.48 billion, reflecting early-year valuation.
- Circulating supply totals 634.74 million UNI tokens, shaping dynamics.
- Fully diluted valuation reaches $5.49 billion at max supply.
- UNI ranks among the top ~35 crypto assets by market capitalization.
- Market dominance holds at 0.14% of the total crypto market.
- 24-hour market cap change records -4.71% amid fluctuations.
- UNI market cap correlates with 24.1% DEX volume share.
- Valuation multiple stands at 2.5x annual fees generated.
Governance and Voting Participation Statistics
- UNification proposal passes with 125.3 million UNI votes in favor.
- 18.5 million UNI holders participate in the delegation vote.
- 17 million UNI voted in favor of active voter delegation.
- Delegate Reward Cycle 3 maintains a 100% voting participation rate.
- UAC budget rebalancing approved with 96.76% support from 222 voters.
- 10 million UNI delegated to 7 active underrepresented delegates.
- 18 million UNI distributed among 12 key governance delegates.
- Delegates require a minimum of 80% voting participation for incentives.

Revenue and Fee Generation Statistics
- Uniswap has generated $2.23 billion in cumulative fees since inception.
- Last 30 days fees total $145.79 million, averaging $4.86 million daily.
- 24-hour fees reach $5.81 million, underscoring active revenue.
- UNI Burn totals 596 million, reshaping token value through fees.
- v4 monthly fees hit $132 million peak in high activity periods.
- Holders capture 15% protocol fees post recent fee switch.
- Annualized fees project $1.78 billion based on current trends.
- Fee tiers include 0.05%, 0.3%, and 1% influencing LP incentives.
Protocol Usage by Chain and Layer 2 Statistics
- Layer 2 networks capture 67.5% of total Uniswap trading volume.
- Base leads L2 with $501.46 million TVL and high swap activity.
- Arbitrum contributes $335.99 million TVL, supporting deep liquidity.
- Optimism hosts significant Uniswap pools with millions in daily swaps.
- Polygon enables cross-chain listings, boosting token access.
- Unichain handles nearly 50% of v4 transaction volume.
- Ethereum mainnet retains $2.785 billion TVL in core pairs.
- Research analyzes 50 million+ transactions across Ethereum and major L2s.
- L2 v4 usage comprises nearly 50% volume, driven by scalability.
Version Adoption (v2, v3, v4) Statistics
- Uniswap v4 TVL surpasses $1 billion within 177 days post-launch.
- v3 maintains 2,527 tracked pools with $2.785 billion TVL.
- v4 tracks 4,689 pools with an average APY of 56.43%.
- v4 captures ~30% of all Uniswap trades.
- v3 handles 60% of trading volume across versions.
- v2 supports stable high-fee tier pools retaining foundational liquidity.
- 100+ new Hooks created daily during v4 peak experimentation.
- Multi-version mix shows v3 dominant while v4 accelerates migration.
Top Pools and Trading Pairs Statistics
- Uniswap hosts thousands of liquidity pools, enabling diverse token swaps.
- WETH/USDT ranks top on Ethereum with high trading volume and liquidity.
- Top pools hold multiple hundreds of millions in combined liquidity.
- 90% largest pools concentrate around ETH, stablecoins, and WBTC pairs.
- Layer 2 top pairs, like on Base, exceed $500 million aggregate liquidity.
- Emerging token pools exhibit high swap frequency despite volatile depths.
- Multi-chain top rankings show Base, Arbitrum leading L2 pool strength.
Whale and Large Holder Statistics
- Whales executed 422 transactions over $100,000 in a two-hour window.
- The top 10 richest addresses hold 50.81% of the UNI supply.
- Top 100 holders control 81.15% of total UNI tokens.
- Whale purchased 254,441 UNI using $2.28 million.
- 100 million UNI burned from the treasury, impacting whale positioning.
- Daily whale outflows peak at 17,400 UNI from Binance.
- Monthly outflows hit a three-month high of 5,250 UNI.
- Whales accumulate 8.77 million UNI tokens amid activity surge.
- Top validators control over 33% of UNI voting power.
Frequently Asked Questions (FAQs)
Uniswap has surpassed $3.45 trillion in cumulative decentralized exchange trading volume.
Uniswap’s market cap is around $3.6 billion based on recent price and circulating supply figures.
Uniswap’s 30‑day DEX volume is roughly $50.19 billion in recent metrics.
UNI trades around $5.7 with about 635 million tokens circulating.
Conclusion
Uniswap’s trajectory demonstrates that decentralized finance continues to scale across networks, versions, and governance models. Multi‑chain adoption has shifted significant activity to Layer 2 environments, with version upgrades like v4 driving new liquidity strategies. Major pools sustain deep capital, while whales and community voters shape key economic policies. Governance engagement, combined with performance upgrades and protocol fee models, underscores Uniswap’s evolution beyond a simple exchange into a complex, user‑driven ecosystem.