





The global games market reached $188.8 billion in 2025, up 3.4% year-on-year, according to Newzoo, with a player base of 3.58 billion, over 60% of the online population. Gaming now stands as the largest entertainment category by spend and audience. These gaming statistics trace where the money and players sit across platforms, regions, generations, and hardware.
The headline numbers from Newzoo, the Entertainment Software Association, Sony, Nintendo, and Ukie live here; the per-segment, per-region, and per-platform deep cuts live in the niche pages linked throughout, each refreshed on its own quarterly cadence.
Key Takeaways
- The global games market hit $188.8 billion in 2025 and is forecast to reach $205 billion in 2026, a 4.6% rise.
- Mobile leads spending with a 55% revenue share, yet console posted the fastest 2025 segment growth at +5.5%.
- China and the US together account for half of global gaming spend, at $49.8 billion and $49.6 billion, respectively.
- 212.3 million Americans play weekly, up 3% on 2025, and the average US player is now 37 years old.
- The US video game industry generated $95.8 billion in total economic impact and contributed $65.5 billion to US GDP in 2025.
- Mobile reaches 3 billion players (83% of gamers), well ahead of PC at 936 million and console at 645 million.
Editor’s Choice
- The worldwide player base reached 3.58 billion in 2025 and is forecast to approach 4 billion by 2028.
- Asia-Pacific is the largest region by revenue at $87.6 billion, ahead of North America’s $52.7 billion.
- Tencent is the largest gaming company by revenue, at roughly $27 billion in 2024.
- The PlayStation 5 reached 93.7 million lifetime units by March 31, 2026.
- The Nintendo Switch 2 sold 19.86 million units in its first fiscal year, Nintendo’s best-selling launch ever.
- The UK games market reached £8.76 billion in 2025, growing 7.4%.
Global Gaming Market Size by Year
The global games market generated $188.8 billion in 2025, up 3.4% year-on-year, and Newzoo projects it to reach $205 billion in revenue in 2026, up 4.6% from 2025. The longer arc points higher still: the global games market is expected to reach $206.5 billion by 2028, with nearly four billion players worldwide, per Newzoo’s eight-year outlook.
- The 2025 market totaled $188.8 billion, a 3.4% year-on-year increase.
- The 2026 forecast sits at $205 billion, a 4.6% rise on 2025.
- Newzoo’s 2028 projection reaches $206.5 billion, approaching four billion players.
- Mobile’s projected 2026 revenue is $107 billion, the largest single platform share.
- Console revenue is forecast at $48 billion in 2026.
Two patterns shape the year ahead, drawing on data from Newzoo, the Entertainment Software Association, Sony, and Nintendo: mobile holds the largest revenue share, yet console is the fastest-growing segment.
This market dwarfs the niche segments tracked elsewhere on SQ Magazine. For the multiplayer-and-platform-specific cut, the online gaming statistics page breaks revenue down by service type rather than by device.
Gaming Revenue by Segment: Mobile, Console, and PC
Mobile generated $103.0 billion in 2025, a 2.9% rise, holding a 55% market share, according to Newzoo, making it the dominant platform by spend. Console followed at $45.9 billion, up 5.5%, the fastest growth of the three, while PC reached $39.9 billion, up 2.5%, per Newzoo’s segment data. The “mobile is eating gaming” framing holds on share, but the console is the segment adding revenue fastest.
- Mobile led with $103.0 billion and a 55% share of the market.
- Console reached $45.9 billion, growing 5.5% year-on-year.
- PC came in at $39.9 billion, up 2.5%.
- Console posted the fastest segment growth at 5.5%, ahead of mobile and PC.
- Across our 50-plus platform statistics pages, we see the same pattern repeat: the largest segment by spend is rarely the fastest-growing one.
For the device-specific deep dive on the PC side, the PC gaming market share data covers hardware mix, and storefront splits the segment table here only summarizes.

Recent Developments in the Gaming Industry
- In May 2026, Sony reported PS5 lifetime sales of 93.7 million units as of March 31, 2026, confirming the milestone in its FY2025 results.
- The same FY2025 results showed just 1.5 million PS5 units shipped in the January-to-March 2026 quarter, the lowest quarterly figure since launch.
- Nintendo confirmed 19.86 million Switch 2 units shipped for the fiscal year ending March 31, 2026, beating its roughly 19 million forecast.
- The ESA’s 2026 report found 212.3 million Americans now play weekly, up 3% on 2025.
- The ESA’s 2026 Economic Impact Report put the US industry’s GDP contribution at $65.5 billion for 2025.
How Many Gamers Are There Worldwide?
The world had 3.58 billion players in 2025, over 60% of the online population, up 4.4% year-on-year, according to Newzoo, and its 2026 report puts the figure at 3.6 billion players. Mobile carries most of that audience: mobile reaches 3 billion players, or 83% of all gamers.
- The global player base reached 3.58 billion in 2025, over 60% of the online population.
- Mobile is the broadest platform, with 3 billion players, 83% of gamers.
- PC reaches 936 million players, 26% of gamers.
- Console reaches 645 million players, 18% of gamers.
- The base is forecast to approach nearly four billion players worldwide by 2028.
The platform percentages sum past 100% because many people play on more than one device, a behavior tracked in detail in the cross-platform gaming data.
Gaming Revenue by Region
Asia-Pacific is the largest gaming region at $87.6 billion in 2025, followed by North America at $52.7 billion, up 4.2%, and Europe at $33.1 billion. Two countries dominate spending: China at $49.8 billion and the US at $49.6 billion, together making up half of all global games spending.
- Asia-Pacific led with $87.6 billion, the largest regional market.
- North America reached $52.7 billion, up 4.2%.
- Europe contributed $33.1 billion.
- China and the US combined for half of all global games spending, at $49.8 billion and $49.6 billion.
- The Middle East and North Africa posted the fastest regional growth at 7.5%.
By the numbers: Newzoo: China ($49.8 billion) and the US ($49.6 billion) together account for half of all global gaming spend in 2025. The concentration means two national markets steer the global revenue picture, a skew most player-count roundups miss.
US Video Game Player Demographics
In the US, 212.3 million Americans play video games every week, up 3%, or 7.2 million, compared to 2025, and 67% of Americans aged 5 to 90 now play one or more hours per week. The gender split is close to even: 53% of men and 46% of women actively play.
- Weekly US players number 212.3 million, up 7.2 million from 2025.
- Participation reached 67% of Americans aged 5 to 90.
- The gender split runs 53% of men and 46% of women actively playing.
- The 2024 baseline was approximately 190.6 million weekly players at 61% participation.
- The average US adult player has been playing for 17 years.
The US industry is also a major employer and economic engine, with $95.8 billion in total economic impact and 82,930 direct jobs in 2025. It generated $12.7 billion in taxes and $18.1 billion in direct labor income that year.
Gamer Age and Generational Breakdown
Player age keeps climbing: The average US player is now 37 years old, up from 36, and play runs across every generation. More than 80% of Gen Alpha, aged 5 to 13, and Gen Z, aged 14 to 29, play video games, while older cohorts remain heavily engaged: 50% of Boomers aged 62 to 80 and 32% of the silent generation aged 81 to 90 play.
- The average US player age rose to 37.
- Gen Alpha and Gen Z participation runs more than 80%.
- Millennials aged 30 to 45 play at 71% weekly.
- Gen X aged 45 to 61 plays at 56%.
- Boomers play at 50%, and the silent generation at 32%.
Key finding: The Entertainment Software Association puts the average US player at 37, with half of Boomers and a third of the silent generation playing weekly. The durable demographic story is an aging, widening audience, not the teenage stereotype, which tracks the engagement-over-growth pattern we see across mature platforms.
The same generational spread shows up in platform choice, where younger cohorts skew toward mobile and Roblox-style social play while older players over-index on console.
The UK Games Market
Britain’s video games market reached £8.76 billion in 2025, growing 7.4%, outpacing the global growth rate. A year earlier, UK consumers spent £7.6 billion on video games in 2024, with mobile gaming growing 8.1% to £1.725 billion and console digital sales up 3.5% to £2.446 billion.
- The UK market hit £8.76 billion in 2025, up 7.4%.
- The 2024 total was £7.6 billion.
- UK mobile gaming reached £1.725 billion, up 8.1% in 2024.
- UK console digital sales reached £2.446 billion, up 3.5% in 2024.
- UK games studios support over 73,000 jobs and contribute £6 billion in GVA annually.
| Metric | Value | Period |
|---|---|---|
| UK market value | £8.76 billion | 2025 |
| UK market value | £7.6 billion | 2024 |
| Mobile (2024) | £1.725 billion | +8.1% |
| Console digital (2024) | £2.446 billion | +3.5% |
Source: Ukie UK Games Market Valuation 2025
Top Gaming Companies by Revenue
Tencent is the world’s largest gaming company by revenue, generating roughly $27 billion in gaming revenue in 2024, with 100% ownership of Riot Games and a 40% stake in Epic Games. Electronic Arts followed with approximately $7.8 billion in 2024 revenue, and Roblox Corporation drove $3.6 billion in 2024 revenue.
- Tencent led with roughly $27 billion in 2024 gaming revenue.
- Electronic Arts reached approximately $7.8 billion in 2024.
- Roblox Corporation generated $3.6 billion in 2024.
- Tencent owns 100% of Riot Games and 40% of Epic Games.
Console Hardware Sales
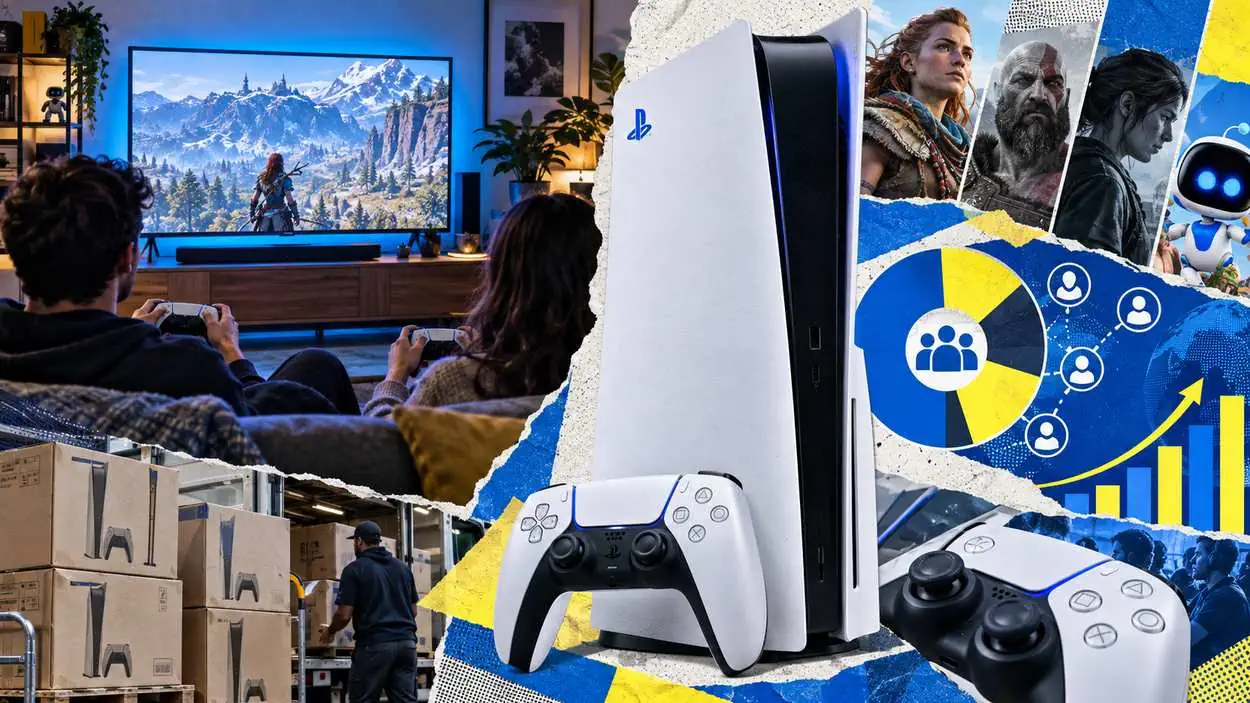
Sony’s PlayStation 5 reached 93.7 million lifetime units as of March 31, 2026, confirmed in its FY2025 results. Nintendo’s newest console moved fast out of the gate: the Switch 2 shipped 19.86 million units in the fiscal year ending March 31, 2026, beating its roughly 19 million forecast, after launching on June 5, 2025.
- The PS5 reached 93.7 million lifetime units by March 31, 2026.
- Sony shipped 16 million PS5 units during FY2025.
- The Switch 2 sold 19.86 million units in its first fiscal year.
- The Switch 2 sold more than 3.5 million units worldwide within four days of release.
- The Switch 2 is Nintendo’s best-selling console launch ever.
| Console | Lifetime Units | As Of |
|---|---|---|
| PlayStation 5 | 93.7 million | March 31, 2026 |
| Nintendo Switch 2 | 19.86 million | March 31, 2026 (FY1) |
Source: Sony Group and Nintendo FY2025 financial results
For the console-versus-console market split, the console market share data tracks PS5, Xbox, and Switch 2 against each other rather than reporting lifetime units in isolation.
Which Country Spends the Most on Gaming?
China spends the most on gaming, at $49.8 billion in 2025, narrowly ahead of the United States at $49.6 billion. The two markets are effectively tied at the top and together account for half of all global gaming spend, which means national policy and platform access in either country moves the global revenue picture more than any single publisher does.
What the Gaming Statistics Say About Industry Scale
The gaming statistics point to a sector whose $188.8 billion in 2025 revenue and 3.58 billion players represent over 60% of everyone online, a scale that exceeds global box office and recorded music combined.
- The 2025 market of $188.8 billion outstrips global box office and recorded music combined.
- The player base of 3.58 billion equals over 60% of the online population.
- The 2026 forecast of $205 billion keeps gaming the largest interactive entertainment category by audience and spend.
Conclusion
Gaming entered 2026 as a $188.8 billion market with 3.58 billion players, on track for $205 billion this year. Mobile owns the largest share at 55%, console grows fastest, and two countries (China and the US) drive half the spend, a concentration that shapes who benefits when the market expands. The data rewards anyone reading the segment splits rather than the headline: publishers, advertisers, and platform analysts all plan against a maturing, aging, widening audience.
The numbers here are the top of a deeper map. The per-platform and per-segment cuts, from esports market and viewership data, carry the detail this hub only summarizes, and they refresh on their own quarterly cadence as new financial results land.