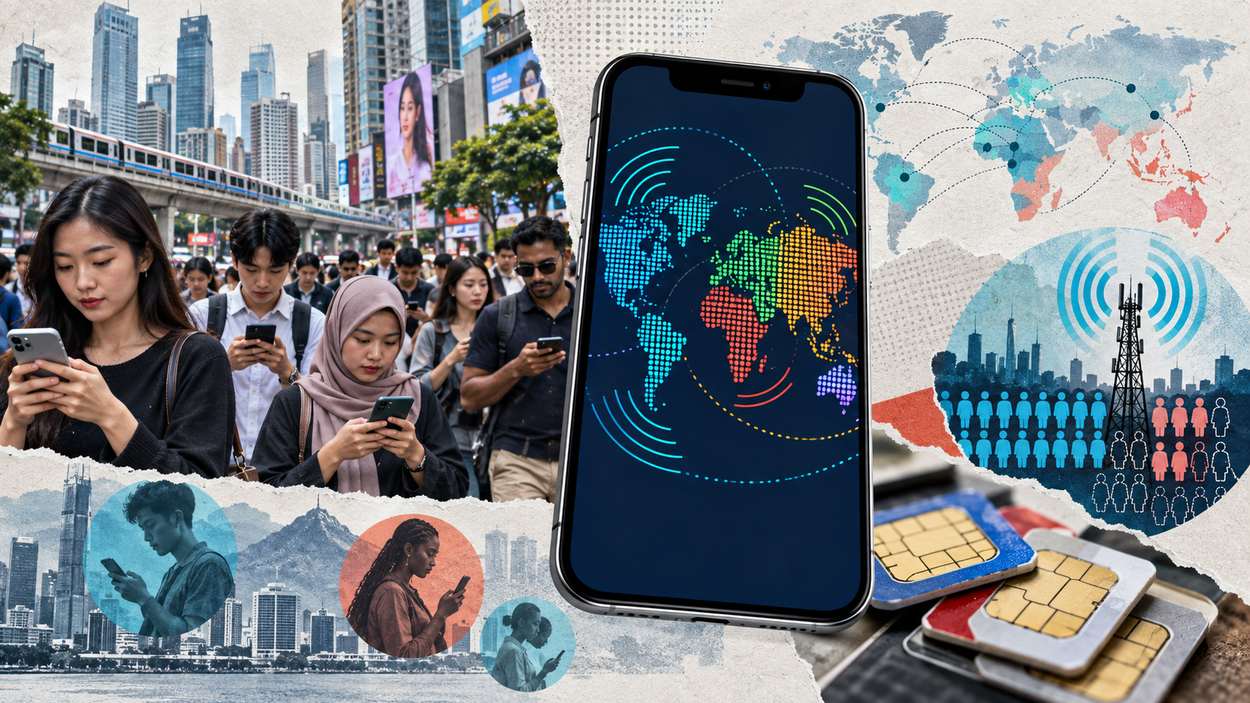






Smartphone ownership runs highest in South Korea, where 98% of adults report owning a smartphone, and lowest in India and Nigeria, where fewer than 50% do, according to Pew Research Center’s global surveys. In the United States, 91% of adults own a smartphone, and 98% own a cellphone of some kind. Read as smartphone penetration by country, both figures come from just one of four competing measures.
Those numbers describe one measure. Three others carry the same label and produce different rankings: unique mobile internet subscribers, SIM connections per 100 people, and the share of a population that actually uses the internet. Japan records 178.4 mobile connections per 100 people, while 85.5% of Japan’s population uses the internet. Every table below names which measure it reports and the year the figure was collected, because blending them is how most country rankings go wrong.
Key Takeaways
- South Korea posts the highest adult smartphone ownership Pew recorded, at 98%, while India and Nigeria sit below 50%.
- 4.7 billion people, 58% of the world’s population, used mobile internet on their own device in 2024.
- Japan and South Korea carry 178.4 and 172.5 mobile connections per 100 people, both well above the 100 mark.
- An estimated 6 billion people, about three-quarters of the world, used the internet in 2025, leaving 2.2 billion offline.
- North America led regional 5G subscription penetration at 79% at the end of 2025.
- Around 945 million women in low- and middle-income countries still own no smartphone.
Editor’s Choice
- US ownership: About 91% of US adults own a smartphone, up from 35% in 2011.
- Usage Gap: 3.1 billion people, 38% of the world, are covered by mobile internet but do not use it.
- Coverage: 96% of the global population lives in an area with mobile internet coverage available.
- 5G coverage spread: Europe reaches 72% 5G population coverage, compared with 13% in the Arab States.
- Income divide: 94% of people in high-income countries use the internet, against 23% in low-income countries.
- Handset affordability: An entry-level handset costs 24% of a woman’s monthly income in LMICs, against 12% of a man’s.
Smartphone Ownership Rates by Country
- Majorities of adults in nearly every country Pew surveyed report owning a smartphone.
- US cellphone ownership of any kind stands at 98%, so the smartphone figure is close to the practical ceiling for that market.
- US smartphone ownership has climbed from 35% in 2011, when Pew ran its first survey of the measure.
- Education splits ownership-adjacent internet use inside countries too: 85% of Israelis with less education use the internet, compared with 95% of those with more education.
- The remaining per-country rates in that survey are published as chart images rather than machine-readable tables, so the figures below are limited to the ones stated in the source text.
| Country | Adults owning a smartphone | Survey | Collected |
|---|---|---|---|
| South Korea | 98% | Pew Global Attitudes | 2022-2023 |
| United States | 91% | Pew NPORS | 2025 |
| India | Fewer than 50% | Pew Global Attitudes | 2022-2023 |
| Nigeria | Fewer than 50% | Pew Global Attitudes | 2022-2023 |
Source: Pew Research Center Global Attitudes survey (published February 2024) and Pew NPORS 2025
Survey ownership is the strictest of the four measures because it counts people, asks them directly, and cannot exceed 100%. Its country coverage is thin because national surveys are expensive, so the gaps in the table above are gaps in the published record rather than an editing choice.
About This Data
Figures here are compiled from twelve primary sources: ten tier-one regulator, statistical-agency, or research-institution publications and two tier-two industry-body releases. Publication dates span late 2022 through the current year. A source is qualified only if it published the figure itself rather than citing another aggregator. Figures are reviewed on a rolling basis and updated when these bodies publish new editions.

Mobile Connections per 100 People by Country
- Kenya records 126.5 mobile connections per 100 people, above Indonesia at 122.5 and the United Kingdom at 121.6.
- Brazil sits just over the line at 101.9 connections per 100 people.
- India and Nigeria are the two countries in this sample below the 100 mark, at 79.4 and 70.8 connections per 100 people.
- Japan’s 178.4 figure is a 2023 reading; every other country in the set is measured for 2024.
- A connection is a SIM, not a person, which is why this measure is the only one of the four that can exceed 100 and why it flatters markets where dual-SIM handsets and separate data SIMs are routine.
The ranking that results looks nothing like the ownership ranking above it. Kenya outranks the United States on connections per 100 people, which reports SIM-buying behavior and says nothing about how many Kenyans own a smartphone. Aggregator pages that publish this indicator under a “smartphone penetration” headline are a recurring source of confusion in this category.
Recent Developments
- November 2025: the ITU’s Facts and Figures 2025 put an estimated 6 billion people online, up from a revised 5.8 billion in 2024.
- September 2025: the GSMA’s State of Mobile Internet Connectivity 2025 reported 4.7 billion unique mobile internet users and a Usage Gap of 3.1 billion.
- May 2025: GSMA Mobile Gender Gap Report: 61% of women in LMICs own a smartphone, with no significant change since 2023.
- June 2026: The Ericsson Mobility Report recorded around 660 million 5G subscriptions added globally during 2025, taking 5G to one-third of all mobile subscriptions.
- November 2024: The ITU’s Facts and Figures 2024 established that four out of five people over 10 years old own a mobile phone.
- 2025, World Bank internet-use vintage: China at 91.6% of the population and India at 70%, ahead of the 2024 readings carried for the rest of the sample.
What Smartphone Penetration by Country Actually Measures
- The unique-subscriber measure counts distinct people using mobile internet on their own device, which the GSMA put at 58% of the world’s population.
- The survey-ownership measure counts adults who tell an interviewer they own a smartphone, topping out at 98% in South Korea.
- The connections measure counts active SIMs per 100 people and reaches 178.4 in Japan.
- The internet-use measure counts the share of a population using the internet at all, which peaks in this sample at 97.9% in South Korea.
- Three of the four cap at 100% and one does not, so any table mixing them will rank countries in an order none of the underlying datasets support.
| Measure | What it counts | Reported by | Example reading | Collected |
|---|---|---|---|---|
| Adult smartphone ownership | People who say they own a smartphone | Pew Research Center | South Korea 98% | 2022-2023 |
| Unique mobile internet users | Distinct people using mobile internet | GSMA | 58% of world population | 2024 |
| Mobile connections per 100 | Active SIM connections, not people | World Bank | Japan 178.4 | 2023-2024 |
| Individuals using the internet | Share of population using the internet | World Bank | South Korea 97.9% | 2024 |
Source: Pew Research Center 2024, GSMA State of Mobile Internet Connectivity 2025, World Bank World Development Indicators 2024
The four measures answer four different questions. A device maker sizing a replacement cycle wants ownership; a network operator planning capacity wants connections; a ministry writing a digital-inclusion target wants unique subscribers or internet use. Picking the wrong one moves a country’s apparent standing by tens of points, which is why the year and the indicator name sit in every caption on this page.
Internet Users by Country
- Among the large European markets, the United Kingdom records 95.5% of its population using the internet, with Germany at 93.5%.
- India’s reading is 70% on the World Bank’s 2025 vintage, the most recent year in the set alongside China.
- Globally, 96% of the people who remain offline live in low- and middle-income countries.
- An estimated 2.2 billion people were still offline in 2025, down from a revised 2.3 billion in 2024.
- This measure is the closest available proxy for meaningful access, because a person counted here has both a device and a working connection, which neither the ownership survey nor the SIM count guarantees on its own.
Ranked this way, the spread is 62.9 points between the top and bottom of the sample, and the ordering is far more intuitive than the connections ranking. Nigeria and Kenya anchor the lower end, which is consistent with the Pew finding that fewer than half of adults in Nigeria own a smartphone.
Where Connections Outrun Internet Use
- Kenya’s SIM density runs 91.5 points above its internet-use share, on a base of just 35% internet use.
- Japan’s gap is 92.9 points on the same comparison, the widest in this five-country set, and it is produced at a far higher level of internet use than Kenya’s.
- India’s two readings sit only 9.4 points apart, the tightest pairing in the set.
- South Korea’s gap is 74.6 points, produced by extra SIMs rather than by anyone being left offline.
- The size of the gap says nothing about how connected a country is. It reports how many SIMs the average person carries.
By the numbers: Kenya carries 126.5 mobile connections per 100 people on World Bank data, yet only 35% of Kenyans used the internet in the same period. India inverts the pattern with 79.4 connections per 100 and 70% internet use, so SIM density and real access track each other only loosely.
Two countries can therefore swap places depending on which indicator a ranking picks up. The two indicators measure different quantities, so the disagreement is structural and no amount of data refresh will close it. Any page that publishes smartphone penetration by country straight from SIM density is reporting tariff behavior and calling it access.
Unique Mobile Internet Subscribers Worldwide
- Mobile now accounts for 84% of global internet connections, which makes the mobile subscriber count the closest thing to a global access number.
- The GSMA counts 4.7 billion unique mobile internet users on their own device, against 3.1 billion people who are covered but not using the service.
- Mobile remains the primary and in many cases the only way most people reach the internet in low- and middle-income countries.
- Four out of five people over 10 years old own a mobile phone worldwide, a broader measure than smartphone ownership because it counts feature phones too.
The three bars stack into the industry’s central finding: coverage is close to solved, and use is not. Subtracting use from coverage leaves the population the GSMA calls the Usage Gap, and it is roughly two-thirds the size of the connected population. Device-side context for that shortfall appears in our mobile phone ownership and usage data.
The Usage Gap and the Offline Population
- The Usage Gap covers 3.1 billion people, 38% of the world’s population, who live inside a covered area and still do not use mobile internet.
- An estimated 6 billion people, about three-quarters of the world’s population, used the internet in 2025.
- The GSMA attributes the gap to barriers other than coverage availability, which is why network build-out alone does not close it.
- Some 96% of those still offline live in low- and middle-income countries.
| Population group | People | Share of world population | Measured |
|---|---|---|---|
| Using mobile internet on own device | 4.7 billion | 58% | 2024 |
| Covered by mobile internet but not using it | 3.1 billion | 38% | 2024 |
| Using the internet by any means | 6 billion | About three-quarters | 2025 |
| Offline entirely | 2.2 billion | Not disclosed | 2025 |
Source: GSMA State of Mobile Internet Connectivity 2025 and ITU Facts and Figures 2025
The two organizations count different things, which is why the rows carry different years and different bases. The GSMA’s 4.7 billion counts people using mobile internet on a device they own; the ITU’s 6 billion counts internet use by any route, including shared devices and fixed connections. Reading the difference as growth between 2024 and 2025 would be a category error.
5G Subscription Penetration by Region
- North America recorded the highest regional 5G subscription penetration at 79%, followed by Northeast Asia at 60%, Western Europe at 54%, and the Gulf Cooperation Council countries at 53%.
- Around 660 million 5G subscriptions were added globally during 2025.
- 5G accounted for one-third of all mobile subscriptions at the end of 2025.
- Ericsson expects 5G subscriptions to increase by a further 1.2 billion by the end of 2027.
- Subscription penetration measures demand, and coverage measures supply. It records how many people bought into 5G where it already exists, which is why wealthy markets can outrun their own coverage maps.
Ericsson’s regions are commercial groupings and do not map onto the ITU’s statistical regions, so the two 5G tables on this page are not directly comparable row for row.
5G Network Coverage by Region
- Europe holds the highest 5G population coverage at the region level, at 72%, followed by the Americas at 63% and Asia-Pacific at 62%.
- Coverage falls to 13% in the Arab States.
- 5G reached 51% of the world population in 2024.
- The distribution is very uneven: 84% of people in high-income countries are covered, compared with only 4% in low-income countries.
Coverage and subscription penetration diverge for the same reason as ownership, and SIM counts do: one measures what the network offers and the other measures what people bought. A reader comparing the two tables should treat them as complementary views, not as competing estimates of one quantity.
The High-Income vs Low-Income Divide
- More than 95% of people over 10 years old own a mobile phone in high-income economies, compared with only 56% in low-income countries.
- Urban populations are considerably better connected than rural ones, with 85% of people in urban areas online against 58% in rural areas.
- Some 96% of the world’s offline population lives in low- and middle-income countries.
- An estimated 2.2 billion people remained offline in 2025, and the ITU frames the remedy as infrastructure, affordable services, and skills training together.
Income is the variable that survives every change of measure. It sets the ownership ceiling, the coverage floor and the 5G gap, and it is the reason a country-by-country ranking of any single indicator mostly reproduces a ranking of GDP per head.
The Gender Gap in Mobile Ownership
- 61% of women in low- and middle-income countries own a smartphone, leaving around 945 million women without one.
- That is 230 million fewer women than men, with no significant change since 2023.
- An entry-level handset costs 24% of a woman’s monthly income in LMICs, against 12% of men’s.
- Globally, 77% of men are online compared with 71% of women.
- The GSMA names handset affordability as one of the top barriers to mobile internet adoption, with literacy and digital skills the other.
| Indicator | Value | Scope |
|---|---|---|
| Women in LMICs who own a smartphone | 61% | 2024 |
| Women in LMICs without a smartphone | Around 945 million | 2024 |
| Ownership shortfall versus men | 230 million | 2024 |
| Handset cost as share of a woman’s monthly income | 24% | LMICs |
| Handset cost as share of a man’s monthly income | 12% | LMICs |
| Men using the internet, global | 77% | 2025 |
| Women using the internet, global | 71% | 2025 |
Source: GSMA Mobile Gender Gap Report 2025 and ITU Facts and Figures 2025
Why it matters: Coverage is not the binding constraint across most of the world. The GSMA reports that 96% of people live inside a mobile internet footprint, yet an entry-level handset still costs 24% of a woman’s monthly income in low- and middle-income countries, against 12% of a man’s.
The affordability figure explains why the gender gap has held steady rather than closing. A price that consumes a quarter of monthly income is a purchase decision made once every several years, so the ownership gap moves on a replacement-cycle timescale rather than a network-rollout one.
Regional Snapshot: Europe, the Americas and Asia-Pacific
- Europe leads the ITU’s regional 5G coverage table at 72% of the population, with the Americas at 63% and Asia-Pacific at 62%.
- Across the large Asian markets, the spread is wide: China reaches 91.6% internet use and Japan 85.5%, against Indonesia at 72.8% and India at 70%.
- North America leads 5G subscription penetration at 79%, with Northeast Asia second at 60%.
- Mobile carries 84% of global internet connections, and in low- and middle-income countries it is often the primary or only route online.
- Regional averages hide more than country figures do. Treat them as orientation, not as findings.
Asia-Pacific is the clearest example. It holds South Korea and Japan at the top of the connections and internet-use tables while also containing India and Indonesia, and the regional average lands between them without describing either. Platform-level differences across those same markets appear in our iPhone versus Android share data.
Which Country Has the Highest Smartphone Penetration?
The answer depends on the measure, and the captured sources support two different winners. On Pew Research Center’s survey of adult smartphone ownership, South Korea records the highest rate at 98%, the top figure among the countries Pew surveyed. Measured as SIM connections per 100 people, Japan is highest in this sample at 178.4, with South Korea second at 172.5.
Both rankings are scoped to the countries in the datasets captured for this page rather than to every country in the world. Neither source claims a global maximum, and a country outside the Pew survey panel or the World Bank sample used here could exceed either figure.
Why Is Mobile Penetration More Than 100% in Some Countries?
Mobile penetration exceeds 100% when the indicator counts SIM connections rather than people. One person holding a personal SIM, a work SIM, and a tablet data SIM registers as three connections, so the ratio climbs above one per head wherever multi-SIM ownership is routine or where prepaid SIMs stay active after use.
The World Bank’s mobile cellular subscriptions indicator behaves exactly this way. It puts Japan at 178.4 connections per 100 people, South Korea at 172.5 and China at 131.8. The ownership, subscriber, and internet-use measures all count people instead, which is why none of them can pass 100%.
Conclusion
Smartphone penetration by country resolves into four separate rankings, and the gap between them is the finding. South Korea sits at 98% adult ownership on Pew’s survey while India and Nigeria fall below 50%, yet on SIM connections Kenya’s 126.5 per 100 people outranks the United States at 113.2, and Japan’s 178.4 tops that table outright. Analysts sizing device markets, operators planning capacity, and policy teams writing inclusion targets each need a different one of these numbers, and the year attached to it matters as much as the value.
The remaining gaps are no longer mainly about signal. With 96% of the world already inside a mobile internet footprint and 3.1 billion people covered but not connected, the constraints that decide the next decade of adoption are handset price, digital skills and the gender divide.