

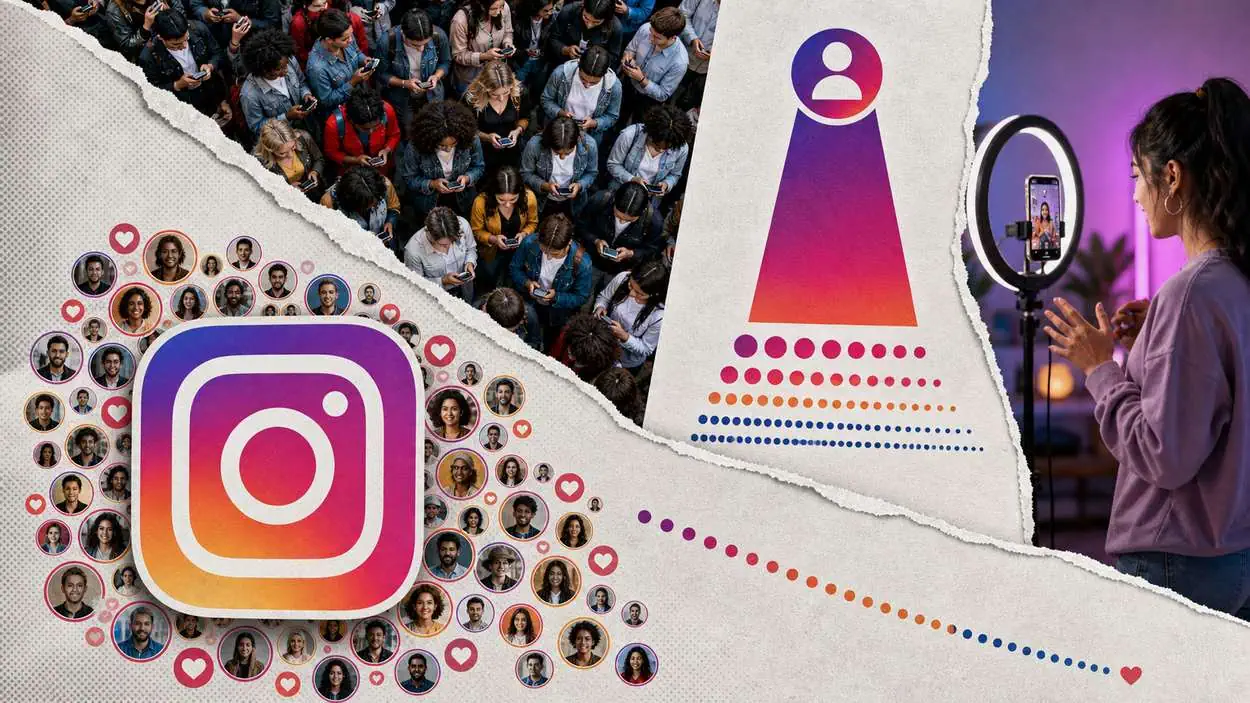






Instagram crossed 2 billion daily active users in Meta’s Q2 2026 quarter, with global time on the app growing double digits year over year. The scale headline hides a strange distribution: the vast majority of Instagram accounts hold fewer than 10,000 followers, with micro-influencer accounts (50,000 to 100,000 followers) making up only 3.15% of the platform’s total population.
Socialinsider’s 2026 benchmark study of 35 million Instagram posts pegs the platform-wide engagement rate at 0.48%, a 24% decrease year over year. The follower economy on Instagram in 2026 is bigger at the top, thinner in the middle, and slower everywhere in between.
Key Takeaways
- 2 billion Instagram daily active users as of Q2 2026, disclosed on Meta’s July 30, 2026 earnings call alongside Family DAP of 3.60 billion for June 2026, up 3% year over year.
- Instagram had at least 1.74 billion users worldwide in January 2025, with its global potential audience reach up 5.5% year over year in Meta’s ad-planning tools.
- 678 million followers make Cristiano Ronaldo the most-followed person on Instagram; the platform’s own @instagram account leads at 685 million.
- India leads all country markets with 472.6 million users, followed by the United States (179.9 million), Brazil (147 million), Indonesia (109 million), and Japan (61.6 million).
- Platform-wide engagement sits at 0.48%, with Carousels leading at 0.50%, Reels at 0.48%, and static Images at 0.33% in Q2 2026.
- Audience growth for brand accounts with 1,000-5,000 followers fell from 38.00% in 2024 to 22.00% in 2025, with every larger bracket showing a comparable slowdown.
- 50% of U.S. adults reported using Instagram in Pew Research’s 2025 survey of 5,022 respondents, unchanged from 2024.
Key finding: Instagram’s daily active user count crossed 2 billion in Q2 2026, according to Meta’s own July 30 earnings call, yet the vast majority of accounts on the platform still hold fewer than 10,000 followers, a distribution shape that reshapes every follower benchmark marketers still budget against.
Editor’s Choice
- Instagram’s potential ad reach is approximately 1.91 billion users worldwide, per DataReportal’s analysis of Meta’s advertising tools.
- Instagram is projected to generate $42.52 billion in U.S. ad revenue in 2026.
- 47.3% of Instagram’s global audience is classified as female and 52.7% as male in Meta’s January 2025 ad-planning tools.
- Nano-influencer accounts with fewer than 10,000 followers post the highest engagement rate on the platform at 6.23%.
- People spend an average of 33.9 minutes a day on Instagram.
- Reels account for over 50% of the daily time users spend on Instagram, per Sprout Social.
- Nike is the most-followed brand on the platform (aside from Instagram itself), with 291 million followers.
Instagram Follower Base at Scale
Meta reported Family daily active people (DAP) of 3.60 billion on average for June 2026, a 3% year-over-year gain; and disclosed on the July 30, 2026 earnings call that Instagram itself had crossed 2 billion daily actives. That number is the operative scale figure for 2026: the follower graph that surrounds those 2 billion daily sessions is where every downstream statistic, engagement rate, ad reach, and follower average is anchored. DataReportal’s January 2025 essentials pegged Instagram at at least 1.74 billion users worldwide, translating to 26.9% of the world’s 13-and-above population.
- Instagram crossed 2 billion daily active users in Meta’s Q2 2026 quarter.
- Meta reported Family daily active people of 3.60 billion for June 2026, up 3% year over year.
- DataReportal pegged Instagram at at least 1.74 billion users worldwide as of January 2025.
- That user base equals 26.9% of the world’s 13-and-above population.
- The two figures represent different measurement lenses on the same platform: a daily-actives view versus an ad-reachable monthly window that excludes China. Both are useful for Meta advertisers, and both frame the follower economy at the same order of magnitude.
Follower Distribution Across Instagram Accounts
The 2-billion-daily-users headline suggests a broad membership, and it is; but the shape underneath is dramatically long-tailed. The vast majority of Instagram users have fewer than 10,000 followers, and micro-influencer accounts (50,000 to 100,000 followers) make up only 3.15% of the platform’s total population.
- The vast majority of accounts hold fewer than 10,000 followers.
- Micro-influencer accounts (50,000 to 100,000 followers) are just 3.15% of all profiles.
- Read against the 2 billion daily actives, the platform is made up of millions of small accounts, not a few big ones.
The corollary, an inference the raw data invites but does not name, is that a nine-figure follower count sits at the extreme tail of a distribution whose bulk falls under 10,000 followers. Read against the daily-actives figure above, Instagram’s structural reality sits closer to millions of small accounts trading attention with one another than to a broadcast platform where a few large accounts dominate reach.

Recent Developments
- July 29, 2026: Meta reported Family daily active people (DAP) of 3.60 billion on average for June 2026, a 3% year-over-year increase, in its Q2 2026 press release.
- July 30, 2026: On the Q2 earnings call, Meta disclosed that Instagram had reached 2 billion daily actives, with global time spent growing double digits year over year, and that Threads had crossed 500 million monthly active users, making Threads the fastest-growing conversation app to date.
- Q2 2026: Reels engagement fell to 0.48% in Q2 2026 from 0.50% in Q1 2026, the second consecutive quarter of Reels engagement decline, per Socialinsider’s 2026 benchmark tracking of 35 million posts.
- February 20, 2026: Socialinsider published its 2026 Instagram benchmark report documenting a 24% year-over-year decline in platform-wide engagement rates, based on the same 35-million-post dataset.
- November 20, 2025: Pew Research Center published its 2025 social media fact sheet, based on a survey of 5,022 U.S. adults between February 5 and June 18, 2025, confirming Instagram at 50% U.S. adult adoption, flat versus 2024.
- March 12, 2025: DataReportal’s essential Instagram statistics update reported at least 1.74 billion users in the January 2025 window, with global potential audience reach up 5.5% year over year and up 3.2% quarter over quarter (October 2024 to January 2025).
Top Followed Accounts on Instagram
Averages come from a few enormous accounts, and this is where the platform’s long, thin distribution spike lives. Instagram’s own @instagram account leads with 685 million followers, ahead of Cristiano Ronaldo at 678 million, Lionel Messi at 515 million, and Selena Gomez at 404 million, the most-followed woman on the platform. Nike, with 291 million followers, is the most-followed brand account other than Instagram itself.
- Instagram’s own @instagram account leads with 685 million followers.
- Cristiano Ronaldo follows at 678 million, then Lionel Messi at 515 million.
- Selena Gomez is the most-followed woman at 404 million; Ariana Grande sits at 363 million.
- Other giants: Justin Bieber (286 million), Taylor Swift (273 million), Neymar (241 million).
- Nike is the top brand account, bar Instagram, at 291 million followers.
| Account | Followers (millions) |
|---|---|
| @instagram (brand) | 685 |
| Cristiano Ronaldo | 678 |
| Lionel Messi | 515 |
| Selena Gomez | 404 |
| Dwayne Johnson | 382 |
| Kylie Jenner | 382 |
| Ariana Grande | 363 |
| Kim Kardashian | 344 |
| Beyoncé | 300 |
| Nike (brand) | 291 |
Source: Wikipedia List of most-followed Instagram accounts, accessed September 2026
Three categories concentrate at the top: footballers (Ronaldo at 678 million, Messi at 515 million, Neymar at 241 million), pop musicians (Ariana Grande at 363 million, Justin Bieber at 286 million, Taylor Swift at 273 million, Selena Gomez at 404 million), and reality-television personalities (the Kardashian-Jenners). Nike aside, the top follower brackets are almost entirely personal accounts rather than brand accounts.
Instagram Followers by Country
Geography does more of the work in shaping the platform’s median follower profile than any celebrity account. India leads all country markets with 472.6 million Instagram users, followed by the United States at 179.9 million, Brazil at 147 million, Indonesia at 109 million, and Japan at 61.6 million. A more recent Sprout Social aggregation, using slightly later cuts of the Meta ad-planning tools, updates the India figure. Sprout Social reports India at approximately 480.55 million users, the United States at nearly 182 million, and Brazil at 147 million.
- India leads at 472.6 million users; Sprout Social’s later cut puts it near 480.55 million.
- The United States follows at 179.9 million (about 182 million in the newer read), then Brazil at 147 million.
- Indonesia holds 109 million and Japan 61.6 million, with India, the United States, and Brazil together near 40% of the global base.
- By region: South America 237 million (13.6%), Western Europe 78.0 million (4.5%), Southern Europe 72.6 million (4.2%).
- Northern Europe adds 51.3 million (2.9%) and Oceania 17.5 million (1.0%).
- The regional roll-up gives a different lens on the same data. DataReportal’s Southern America aggregation counted 237 million active Instagram users, 13.6% of the global total; Western Europe held 78.0 million (4.5%), Southern Europe 72.6 million (4.2%), Northern Europe 51.3 million (2.9%), and Oceania 17.5 million (1.0%). South Asia and Latin America together shape the median Instagram follower profile more than North America and Western Europe, an underweighted point in most Western marketing frameworks.
Why it matters: Three markets, India, the U.S., and Brazil, together hold roughly 40% of Instagram’s global user base, so the median follower profile is shaped more by South Asia and Latin America than Western marketing frameworks tend to acknowledge, and any global follower benchmark that leans on U.S. adoption data alone systematically misreads the platform.
| Region | Active Users (millions) | Share of Global Total |
|---|---|---|
| Southern America | 237 | 13.6% |
| Western Europe | 78.0 | 4.5% |
| Southern Europe | 72.6 | 4.2% |
| Northern Europe | 51.3 | 2.9% |
| Oceania | 17.5 | 1.0% |
Source: DataReportal Essential Instagram Statistics (Kepios analysis of Meta ad-planning tools, January 2025)
Instagram Follower Demographics
The people who follow accounts on Instagram tilt slightly male globally and lean female in the United States. Meta’s January 2025 ad-planning tools report 52.7% of Instagram’s audience as male and 47.3% as female globally. In the United States, that pattern flips: 55.4% of U.S. Instagram users aged 18-plus are female, and 44.6% are male.
- Globally, Instagram’s audience is 52.7% male and 47.3% female (Meta’s January 2025 ad tools).
- In the United States, the split flips to 55.4% female and 44.6% male among users aged 18-plus.
- The average user is aged 25 to 34, and the 18-34 bloc is over 64% of the adult ad audience.
- The 25-34 male band alone is 18.4% of the global ad audience aged 18 and above, the largest single cohort.
- Age structure is more heavily concentrated than the gender split. The average age of Instagram users in January 2025 sat between 25 and 34 years old, with male users in that age band accounting for the greatest share of active users. The full Instagram demographics age×gender matrix from DataReportal is worth reading whole; the 18-34 bloc alone accounts for over 64% of the adult ad audience:
View the data
The 25-34 male band alone accounted for 18.4% of Instagram’s global ad audience aged 18 and above, the single largest cohort. For advertisers accustomed to targeting a female-skewed platform, the global male majority is a recurring surprise; the U.S. figure is a different market from the global average, not a subset of it.
Instagram Audience Growth Benchmarks
The follower flywheel that carried creator accounts through earlier years has thinned. Socialinsider’s 2026 benchmark tracks audience growth by brand size from 2024 to 2025 and finds that accounts in the 1,000-5,000 followers band grew 22.00% in 2025, down from 38.00% in 2024; 5,000-10,000 slowed from 35.00% to 20.29%; 10,000-50,000 from 33.80% to 17.20%; 50,000-100,000 from 30.00% to 13.62%; and 100,000-1,000,000 from 27.00% to 11.25%.
- 1,000-5,000-follower brands grew 22.00% in 2025, down from 38.00% in 2024.
- 5,000-10,000 slowed to 20.29% from 35.00%; 10,000-50,000 to 17.20% from 33.80%.
- 50,000-100,000 fell to 13.62% from 30.00%; 100,000-1,000,000 fell to 11.25% from 27.00%.
- The 1,000-5,000 bracket’s rate fell by roughly 42%; every bracket lost about half its growth year over year.
- The curve is monotone: every size band slowed, and the smaller the band, the sharper the slowdown in absolute percentage points. The 1,000-5,000 follower bracket’s growth rate fell by roughly 42% year over year. That’s not a rounding change; it’s the sound of the platform’s early-account tailwind losing altitude.
| Brand Size | 2024 Growth | 2025 Growth | Absolute Drop | Relative Drop |
|---|---|---|---|---|
| 1,000-5,000 | 38.00% | 22.00% | -16.00 pp | -42% |
| 5,000-10,000 | 35.00% | 20.29% | -14.71 pp | -42% |
| 10,000-50,000 | 33.80% | 17.20% | -16.60 pp | -49% |
| 50,000-100,000 | 30.00% | 13.62% | -16.38 pp | -55% |
| 100,000-1,000,000 | 27.00% | 11.25% | -15.75 pp | -58% |
Source: Socialinsider 2026 Instagram Organic Benchmarks, brand-size growth-rate matrix
Follower Count vs Engagement Rate
Follower count and engagement rate have decoupled, and the decoupling runs in the opposite direction from where large brands typically look. Nano-influencer accounts with fewer than 10,000 followers post the highest engagement rate on the platform at 6.23%, according to Sprout Social’s 2026 industry compilation. The platform-wide engagement rate sat at 0.48% in Socialinsider’s 2026 benchmark tracking, itself a 24% year-over-year decrease.
- Nano-influencer accounts under 10,000 followers post the highest engagement at 6.23%.
- Platform-wide engagement sits at 0.48%, itself a 24% year-over-year decline.
- That nano rate runs about 13x the platform average; a $50,000 spend on a nano network can outperform one mega-account.
The nano-influencer engagement rate of 6.23% runs roughly 13x the platform average of 0.48%. For brand budgets, that reversal is expensive to ignore: a $50,000 sponsorship placed with a nano-influencer network can outperform the same spend with a single mega-account, on engagement dimensions alone.
Reels, Carousels and the Follow Decision
Format is now doing more work in the follow decision than it did three years ago. Reels and carousels earn different kinds of behavior from the audience, reach vs interaction; and both matter for how a follower base grows. Carousels’ engagement rate fell to 0.50% in Q2 2026 from 0.52% in Q1 2026 but remained Instagram’s highest-performing format; Reels fell to 0.48% in Q2 2026 from 0.50% in Q1 2026 (a second consecutive quarterly decline); Images fell to 0.33% in Q2 2026 from 0.35% in Q1 2026.
- Carousels led at 0.50% in Q2 2026 (down from 0.52%), Instagram’s highest-performing format.
- Reels fell to 0.48% from 0.50%, a second straight quarterly decline; Images dropped to 0.33% from 0.35%.
- For top brand accounts, Reels drive a 2.7% engagement rate, nearly double carousels (1.4%) and static images (1.3%).
- Audiences watch a Reel for only 4 seconds before scrolling, so the hook must land immediately.
The top-brand read is different from the platform-wide one because top-brand accounts are creating more polished Reels and putting more paid amplification behind them. Dash Social’s 2026 Instagram Benchmark Report finds that for top-brand accounts, Reels drive a 2.7% engagement rate, nearly double carousel posts (1.4%) and static images (1.3%). Dash Social also notes that audiences watch a Reel for only 4 seconds before scrolling, so the hook has to land in the first second or two.
For a brand hoping to grow its follower base, the practical implication is a two-format strategy. Reels for reach and follower acquisition, carousels for engagement depth and follower retention. Static posts continue to lose share of both metrics. Compared with TikTok and Snapchat, Instagram’s format mix is broader, but Reels are where the follower-acquisition arithmetic on the platform is happening in 2026.
Instagram Adoption Among U.S. Adults
Country-level adoption gives the follower economy a demand-side ceiling in each market. In the United States, that ceiling is now roughly half of the adult population. Pew Research Center’s 2025 survey of 5,022 U.S. adults, fielded February 5 to June 18, 2025, found that 50% of U.S. adults use Instagram, unchanged from 50% in 2024 and up from 47% in 2023.
- 50% of US adults used Instagram in Pew’s 2025 survey of 5,022 respondents, flat versus 2024.
- Adoption climbed from 9% in 2012 to 28% in 2016, 40% in 2021, and 47% in 2023.
- Instagram ranks third among US platforms, behind YouTube (84%) and Facebook (71%), ahead of TikTok (37%).
- Pew fielded the survey from February 5 to June 18, 2025, and published it November 20, 2025.
- Instagram sits third among U.S. adult social platforms in Pew Research’s 2025 survey, behind YouTube at 84% and Facebook at 71%, and ahead of TikTok at 37%. The full platform-by-platform table:
The trajectory is what matters for growth planning. Instagram’s U.S. adult adoption rose from 9% in 2012 to 28% in 2016, 40% in 2021, 47% in 2023, and 50% in 2024, and stayed flat at 50% in 2025. The 2024-to-2025 flat line is the first true U.S. plateau in Instagram’s decade-plus adoption curve, and it means marginal U.S. follower growth is now a market-share fight, not a market-size fight. Compared with Pinterest and X, Instagram sits comfortably ahead on U.S. adoption, but that comparison flattens the growth story.
Instagram Ad Reach and Revenue
The commercial ceiling around the follower economy is the ad-audience number, not the DAU number. Instagram’s potential ad reach, the number of users marketers can reach through Instagram’s advertising tools, is approximately 1.91 billion worldwide, per DataReportal’s analysis. Sprout Social projects Instagram to generate $42.52 billion in U.S. ad revenue in 2026.
- Instagram’s potential ad reach is about 1.91 billion users worldwide, per DataReportal.
- Sprout Social projects $42.52 billion in US Instagram ad revenue for 2026.
- Meta’s Family ad impressions rose 14% year over year in Q2 2026, with average price per ad up 12%.
- Meta’s own Q2 2026 disclosure adds the pricing and volume decomposition. Ad impressions delivered across Meta’s Family of Apps increased 14% year over year in Q2 2026, and the average price per ad rose 12% year over year. For Instagram, which sits inside that Family of Apps aggregate, the pattern implies a rising cost per follower reached via paid distribution, a headwind that lands on top of the organic growth slowdown documented in the Social Insider benchmarks.
| Region | Active Instagram Users (millions) | Share of Global | Ad-Reach Note |
|---|---|---|---|
| Southern America | 237 | 13.6% | Ad-audience bright spot |
| Western Europe | 78 | 4.5% | Mature, plateauing |
| Southern Europe | 72.6 | 4.2% | Mature, plateauing |
| Northern Europe | 51.3 | 2.9% | Mature, plateauing |
| Oceania | 17.5 | 1.0% | Small but high-ARPU |
Source: DataReportal Essential Instagram Statistics (Kepios analysis of Meta ad-planning tools, January 2025)
That ad-cost trajectory has real consequences for e-commerce brands whose growth model was built on cheaply acquiring followers who eventually converted; the “cheap follower” era has visibly ended on Instagram, and the numbers above are how you can see it.
Follower Behavior. Time Spent and Session Depth
Followers who stay are worth more than followers who arrive, and how they spend the time inside the app decides whether the follow retains value. The average Instagram user spends 33.9 minutes a day on the app. Sprout Social’s 2026 compilation indicates that Reels account for over 50% of the daily time users spend on Instagram.
That single split explains most of the platform’s format shift: half of the time an account has with a follower is now happening inside the Reels tab, not the follow-graph feed, a redistribution that pushes brands toward Reels-first content even when carousels win on per-post engagement.
For creators trying to build a follower base, session depth is now driven by algorithm-fed content rather than follow-graph content, with two knock-on effects: a new follow no longer guarantees the feed exposure it once did, and the follow decision itself is being made off a Reel served by discovery rather than a feed post from an existing follow. Physical-space brands like Wall Pics have adjusted content strategy accordingly.
Is Instagram still growing?
Instagram’s growth in 2026 is asymmetric across metrics. DataReportal’s data shows Instagram’s global potential audience reach up 5.5% in the 12 months to January 2025, adding 90.8 million users year over year and 54.4 million (+3.2%) in the single quarter from October 2024 to January 2025.
Meta’s Q2 2026 disclosure of Instagram at 2 billion daily actives and Family DAP at 3.60 billion, up 3% year over year, tells the same story from the corporate side: the aggregate is still growing. Where growth has visibly slowed is inside mature markets. Pew’s flat 50% U.S. adoption for 2024 and 2025 is the clearest single indicator, and inside per-account audience growth, where Socialinsider’s benchmarks show every brand-size bracket cut roughly in half year over year.
How many followers do you need to make money on Instagram?
There is no single follower threshold that unlocks monetization, but the platform’s own data points make a rough benchmark visible. Nano-influencer accounts under 10,000 followers post the highest engagement on the platform at 6.23%.
Micro-influencer accounts (50,000-100,000 followers) sit at 3.15% of the platform’s total population. Practically, then, 10,000 followers is where brand deals become viable at scale; 50,000-100,000 is where a creator can plausibly earn from Instagram as a primary income source; and follower-only monetization above 1 million tends to work best when combined with off-platform revenue streams.
Conclusion
The 2 billion daily active users Meta disclosed for Instagram in Q2 2026, with time spent growing double digits year over year, is a scale ceiling few platforms have ever reached. Most accounts hold fewer than 10,000 followers; audience growth rates for brand accounts of every size have fallen sharply year over year; engagement per follower is highest at the smallest accounts and lowest at the largest ones; and Reels account for over 50% of the time users spend inside the app. The typical personal profile’s modest follower count is the honest benchmark against Cristiano Ronaldo’s 678 million.
Instagram in 2026 is a bigger platform on top and a thinner platform underneath. Looking forward, the growth story is moving abroad: India’s user base of approximately 480.55 million is roughly 2.6 times the United States at nearly 182 million. The U.S. adoption plateau at 50% in Pew’s 2024 and 2025 readings is a market-share signal, not a market-size one. Advertisers and creators watching Instagram in 2026 should track engagement-per-follower and Reels reach as the leading indicators; the next brand budget rebalance will almost certainly move in the direction they are pointing.







