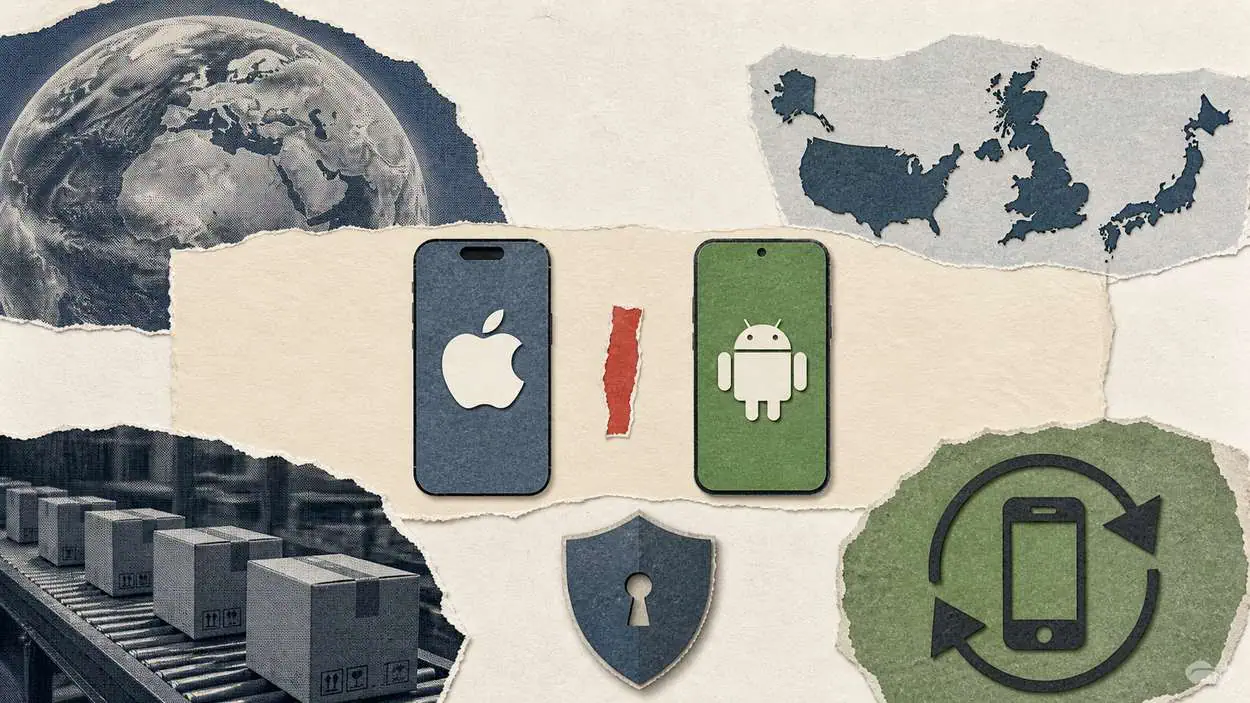






Android holds 68.36% of the mobile operating system market worldwide as of July 2026, but that global number hides a sharper regional split: iOS leads the United States at 59.58%, the United Kingdom at 53.92%, and Japan at 63.59% in the same month.
On the shipment side, according to Counterpoint, Apple led Q1 2026 global smartphone shipments at 21% for the first time, tied with Samsung at 21%, while the overall market declined 3% year over year on memory-component shortages and weaker demand. This section pulls the latest primary data from StatCounter, Counterpoint, Pew Research, and Apple’s own filings to answer the questions readers keep asking about who actually dominates the smartphone market, and where.
Key Takeaways
- Per StatCounter, Android accounts for 68.36% of worldwide mobile OS use in July 2026, according to StatCounter, versus 31.6% for iOS, a roughly 2.16-to-1 ratio at the global level.
- iOS leads the United States market at 59.58% versus Android’s 40.39% in July 2026, per StatCounter.
- Global smartphone shipments in Q1 2026 came in at Apple 21%, Samsung 21%, Xiaomi 12%, OPPO 10%, vivo 7%, and Others 29%, the first quarter Apple has led.
- Per Apple’s Q4 FY2025 release, Apple reported $102.5 billion in September-quarter revenue, up 8% year over year, and $416 billion for fiscal 2025, with its installed base of active devices at a new all-time high across all product categories and geographic segments.
- According to Pew Research, about 91% of US adults own a smartphone, up from 35% in 2011, in a survey of 5,022 US adults fielded February to June 2025.
- India runs on Android at 92.44% and Africa at 81.93%, while iOS holds only 7.5% of the Indian mobile OS market in July 2026.
- By handset vendor, StatCounter puts Apple at 31.59% of global mobile web share, ahead of Samsung’s 19.13%, Xiaomi’s 10.11%, Vivo’s 5.78% and Oppo’s 5.69% in July 2026, a snapshot Google’s own Android Developers dashboard cross-references at the device-density level.
Editor’s Choice
- Widest regional inversion: Android‘s global lead is 68.36% while iOS’s Japan lead is 63.59%, a swing of nearly 64 points on the same month’s data.
- Q4 seasonal peak: Apple’s Q4 2025 shipment share hit 25%, its highest in the six-quarter Counterpoint window.
- Q1 handoff broken: Apple led a first quarter for the first time in Q1 2026, at 21%, with Samsung ranked second at a rounded 21%, after finishing Q1 2025 behind Samsung 19-20.
- HONOR outlier: HONOR grew 31% year over year in Q1 2026 while the overall market declined 3%.
- Regional shocks: Europe fell 6% YoY, and MEA fell 7% YoY in Q1 2026; LATAM was the only region to grow, at +3%.
- US smartphone saturation: About 98% of US adults own a cellphone of some kind; 91% own a smartphone.
- iPhone 17 base spec jump: iPhone 17 shipped with 256GB base storage, double the previous entry, with pre-orders opening on September 12 and availability from September 19.
Global iPhone vs Android Market Share
- Android: 68.36% worldwide mobile OS share (July 2026, StatCounter)
- iOS: 31.6% worldwide mobile OS share (July 2026, StatCounter)
- Combined mobile + tablet: Android 67.75%, iOS 32.21%
- Global smartphone shipments (Q1 2026): Apple 21%, all non-Apple OEMs combined 79%+ (chiefly Android; HarmonyOS handsets sit inside Counterpoint’s “Others”)
| Cut | Android share | iOS share | Notes |
|---|---|---|---|
| Worldwide mobile | 68.36% | 31.6% | July 2026 StatCounter |
| Worldwide mobile + tablet | 67.75% | 32.21% | iOS gains ~0.6 pts from iPad inclusion |
| Global smartphone shipments (Q1 2026) | 79%+ (all non-Apple) | 21% (Apple) | Counterpoint Q1 2026; the non-Apple total is chiefly Android but also carries HarmonyOS inside “Others” |
Source: StatCounter Global Stats and Counterpoint Research, July 2026 and Q1 2026
The clean top-of-funnel answer to “who dominates” is Android, and by a wide margin at the worldwide level. StatCounter’s mobile OS panel puts Android and iOS in a roughly two-to-one split, with every other mobile OS (Linux, KaiOS, Windows, BlackBerry OS) at 0.01% or less. Including tablets shifts the ratio only slightly on the combined mobile-and-tablet cut for the same month.
That balance has been directionally stable through the current 12-month window. It also masks nearly every meaningful pattern in the data.
By the numbers: Android leads iOS 2.16 to 1 on the global mobile OS panel in July 2026, but tips the other way in the highest-ARPU markets, the same July 2026 dataset puts iOS at 59.58% in the United States and 63.59% in Japan.
The web-share ratio comes out to roughly 2.16 Android devices browsing for every one iOS device, which is the plain-English framing behind the platform split. Shipment share tells a different story, covered further down.
Regional Market Share: The Inversion Nobody Talks About
- United States iOS lead: 59.58% vs Android 40.39% (July 2026)
- United Kingdom iOS lead: 53.92% vs Android 46.07% (July 2026)
- Japan iOS lead: 63.59% vs Android 36.41% (July 2026)
- India Android dominance: 92.44% vs iOS 7.5% (July 2026)
- Africa Android dominance: 81.93% vs iOS 18.04% (July 2026)
- Europe (region): Android 60.44% vs iOS 39.54%
- China Android 70.37% vs iOS 29.51%
| Country / Region | Android share | iOS share | Leader |
|---|---|---|---|
| Worldwide | 68.36% | 31.6% | Android |
| United States | 40.39% | 59.58% | iOS |
| United Kingdom | 46.07% | 53.92% | iOS |
| Japan | 36.41% | 63.59% | iOS |
| Europe (region) | 60.44% | 39.54% | Android |
| Asia (region) | 78.11% | 21.84% | Android |
| China | 70.37% | 29.51% | Android |
| India | 92.44% | 7.5% | Android |
| Africa | 81.93% | 18.04% | Android |
| South America | 81.25% | 18.74% | Android |
Source: StatCounter Global Stats, mobile OS panel, July 2026
The regional split is where the “who dominates” question stops being a single question. Three of the wealthiest smartphone markets on the planet- the United States at 59.58% iOS, the United Kingdom at 53.92% iOS, and Japan at 63.59% iOS- are majority-iOS in July 2026. Two of the largest by population, India at 92.44% Android and Africa at 81.93% Android, are dominant-Android markets, with iOS holding under one-fifth of use in each.
The reason the global topline reads Android-dominant is arithmetic, not preference: the Android-dominant regions carry the population weight. India and Africa combined account for more mobile-internet users than the US, UK, Canada, Australia and Japan combined, and StatCounter’s page-view weighting reflects that. It also means anyone writing “Android is winning worldwide” is technically correct but functionally misleading; the answer flips within the very same dataset depending on which country you’re standing in.
Europe sits in between at 60.44% Android, 39.54% iOS as a region, the tension line between the UK’s iOS majority and the Android-dominant continental average. China, despite hosting Apple’s largest single-country installed base outside the US, still runs 70.37% Android on the mobile web panel.

Recent Developments
- September 9, 2025: Apple launched iPhone 17 with 256GB base storage, a 6.3-inch Super Retina XDR ProMotion display, the A19 chip, Ceramic Shield 2 with 3x better scratch resistance, and pre-orders opening September 12.
- October 30, 2025: Apple reported fiscal Q4 revenue of $102.5 billion (up 8% YoY), a September-quarter iPhone revenue record, and full-year FY2025 revenue of $416 billion.
- November 20, 2025: Pew Research updated its Mobile Fact Sheet showing US smartphone ownership at 91% (about nine-in-ten), based on 5,022 US adults surveyed between February and June 2025.
- November 24, 2025: Google published a Google Play active-device snapshot covering the 7-day period ending November 24, 2025, showing normal screens at 71.9% of active devices and the largest screen-density bucket at 56.9%.
- May 18, 2026: Counterpoint’s Q1 2026 update reported a 3% year-over-year decline in global smartphone shipments, driven by memory-component shortages and weaker consumer demand, with HONOR growing 31% YoY on overseas expansion, the standout among the brands outside Counterpoint’s named top five.
Smartphone Shipments: Apple, Samsung and the Q4-Q1 Seasonal Swap
- Apple Q1 2026 share: 21% (up from 19% in Q1 2025, +9% YoY units)
- Samsung Q1 2026 share: 21% (ranked second; Apple’s first Q1 lead)
- Q4 2025 shipment peak (Apple): 25%, highest single-quarter share in the current window
- Samsung Q4 2025 share: 18%, below its 20% Q1 2025 level
- Xiaomi Q1 2026 share: 12%; OPPO 10%; vivo 7%; Others 29%
- Overall global shipments Q1 2026: down 3% year over year
- HONOR Q1 2026 growth: +31% year over year, outside Counterpoint’s named top five
| Vendor | Q4 2024 | Q1 2025 | Q2 2025 | Q3 2025 | Q4 2025 | Q1 2026 |
|---|---|---|---|---|---|---|
| Apple | 23% | 19% | 17% | 18% | 25% | 21% |
| Samsung | 16% | 20% | 20% | 19% | 18% | 21% |
| Xiaomi | 13% | 14% | 14% | 14% | 11% | 12% |
| vivo | 8% | 7% | 9% | 9% | 8% | 7% |
| OPPO | 11% | 11% | 12% | 12% | 11% | 10% |
| Others | 29% | 29% | 28% | 28% | 27% | 29% |
Source: Counterpoint Research, Global Smartphone Market Share (through Q1 2026), May 18, 2026
Two structural patterns fall out of the six-quarter table above. The first is the holiday concentration on Apple’s side of the market. In 2025, the window’s only complete calendar year, Apple’s share peaked in Q4 at 25%, while Samsung’s Q4 share of 18% trailed its 20% Q1 level.
iPhone launches (see also iPhone statistics) in September and stock the December quarter; Samsung’s Galaxy S flagship launches in the first calendar quarter and stocks the March quarter. Read against those two launch calendars, the seasonal handoff looks to us like a release-cadence effect rather than quarter-to-quarter noise.
| Vendor | 6-quarter average | Peak quarter | Trough quarter |
|---|---|---|---|
| Apple | 20.5% | Q4 2025 (25%) | Q2 2025 (17%) |
| Samsung | 19.0% | Q1 2026 (21%) | Q4 2024 (16%) |
| Xiaomi | 13.0% | Q1-Q3 2025 (14%) | Q4 2025 (11%) |
| OPPO | 11.2% | Q2-Q3 2025 (12%) | Q1 2026 (10%) |
| vivo | 8.0% | Q2-Q3 2025 (9%) | Q1 2025 & Q1 2026 (7%) |
Source: Counterpoint Research, Q1 2026 update; averages computed from the same six-quarter series
The second pattern is what makes Q1 2026 unusual: The handoff broke. Samsung led Q1 2025 shipments outright at 20% versus Apple’s 19%. In Q1 2026, Apple pulled level with Samsung at 21% each, growing 9% YoY while the overall market declined 3%. Counterpoint attributes Apple’s Q1 lead to iPhone 17 demand, disciplined supply-chain management through the memory-chip constraint, and stronger performance in China.
Regional distress in the same quarter helps explain the overall shipment decline: Europe fell 6% year over year, Middle East and Africa fell 7%, and Latin America was the only region to grow, at 3%.
US Mobile Ownership: 91% Have a Smartphone
- Cellphone ownership (US adults, Feb-Jun 2025): 98%
- Smartphone ownership (US adults, Feb-Jun 2025): 91%
- Smartphone ownership (US adults, 2011 baseline): 35%
- Pew Research sample size: 5,022 US adults surveyed Feb-Jun 2025
- iOS share of US mobile OS (July 2026): 59.58%
The US market is now effectively saturated. Pew Research’s Mobile Fact Sheet, fielded February 5 to June 18, 2025, reports on the cellphone and smartphone ownership shares captured in the bullets above, up from just 35% in the Center’s first smartphone-ownership survey in 2011. That growth curve sets the ceiling on future US smartphone unit growth: the addressable population that has never owned a smartphone is now smaller than the segment upgrading every three or four years.
The Pew data anchors the earlier StatCounter US figure, though the two measure different things and do not multiply into a headcount: Pew reports self-reported device ownership, while StatCounter’s US mobile OS panel reports web-traffic share, where iOS holds the majority. Pew fielded this wave using address-based sampling and a multimode protocol combining web, mail, and phone, having moved off phone-only in 2023, worth noting when comparing against pre-2023 series.
Vendor Share Worldwide – Who Actually Sells the Most Phones
- Apple: 31.59% (largest single OEM slice, July 2026)
- Samsung: 19.13%
- Xiaomi: 10.11%
- Vivo: 5.78%
- Oppo: 5.69%
- Unknown / Other combined: 27.70%
Key finding: Apple is the single largest handset vendor at 31.59% of global mobile web share, but the combined Android OEM slice (Samsung, Xiaomi, Vivo, Oppo, HONOR and every “Other”) accounts for over two-thirds of the same panel.
Reading a single-vendor bar rather than an OS bar changes the ranking. StatCounter’s global mobile vendor panel for July 2026 puts Apple at 31.59% share, Samsung at 19.13%, Xiaomi at 10.11%, Vivo at 5.78%, and Oppo at 5.69%.
The Apple vendor share is essentially identical to the iOS OS share because Apple is the sole iOS OEM. Samsung, Xiaomi, Vivo, Oppo, and every “Other” Android OEM together make up the Android side.
The single-vendor view is what earns Apple the “#1 smartphone brand in the world” framing that readers ask about; it is the largest single OEM by web-panel share, even though the Android platform collectively outweighs it two-to-one. On the shipment side, Counterpoint puts Apple and Samsung in a dead heat.
Apple’s Revenue Share vs Unit Share: The $416 Billion Gap
- Apple FY2025 total revenue: $416 billion
- Apple Q4 FY2025 (Sept quarter) revenue: $102.5 billion, up 8% YoY
- Q4 FY2025 diluted EPS: $1.85, up 13% YoY (adjusted)
- Installed base of active devices: new all-time high across all product categories and geographies
- Q1 2026 shipment share: 21%, 1/5th of unit slice, roughly 3/10ths of vendor web share
| Metric | Value |
|---|---|
| Apple full-year FY2025 revenue | $416 billion |
| Apple Q4 FY2025 (Sept quarter) revenue | $102.5 billion |
| Q4 FY2025 YoY revenue growth | +8% |
Source: Apple Inc., Fiscal 2025 Fourth Quarter Results, October 30, 2025
The shipment share is not the number Apple shareholders track. The financial statements are. Apple posted quarterly revenue of $102.5 billion for its fiscal 2025 fourth quarter ended September 27, 2025, up 8% year over year, with diluted earnings per share of $1.85, up 13% year over year on an adjusted basis. The same release put full-year fiscal 2025 revenue at $416 billion, with a September-quarter revenue record for iPhone and an all-time revenue record for Services.
The gap between the unit-share slice and the revenue trace is the pricing story, average selling prices, Services attachment, and margin pool. Apple also reported that its installed base of active devices reached a new all-time high across all product categories and geographic segments in the September quarter, which is the metric Apple uses in place of a public quarterly unit-shipment number.
For anyone comparing the “who’s winning” story across OS share, shipment share, and revenue, the answer really is three answers: Android leads unit deployment 2-to-1, Apple and Samsung tie current-quarter shipments, and Apple alone captures the profit pool the analysts pay attention to. The 2026 data is unusually clean on all three counts.
iPhone Lifespan vs Android: The Longevity Question
- Apple iOS 26 line (iOS 26.6.1, August 17, 2026): Available for iPhone 11 and later; the same-day iOS 18.7.10 still patches iPhone XS, iPhone XS Max, and iPhone XR
- iPhone 11, the oldest model on that iOS 26 line, announced September 10, 2019; pre-orders September 13, in stores September 20
- Google Pixel 8 and later: 7 years of OS and security updates from US Google Store availability
- Google Pixel 6, Pixel 7 series and Pixel Fold: 5 years of OS and security updates
- Samsung Galaxy S24 series: seven generations of OS upgrades and seven years of security updates
- Samsung Galaxy A56 / A36 / A26: Up to six generations of OS and One UI upgrades, six years of security updates
- Samsung Galaxy security-update support extended by up to 7 years as of January 2024
- Xiaomi, Redmi and POCO: At least 2 years of security updates after a model’s first shipment, 3 years or longer on some models
- iPhone 17 (2025) base storage: 256GB, double the previous entry; Ceramic Shield 2 gives 3x better scratch resistance
| Platform / OEM | Published update commitment | Oldest model still covered |
|---|---|---|
| Apple iPhone (iOS 26 line) | Security updates for the current iOS release | iPhone 11 and later |
| Apple iPhone (iOS 18 line) | Security updates still shipping for the prior iOS release | iPhone XR / iPhone XS |
| Google Pixel 8 and later | 7 years of OS and security updates | Pixel 8 |
| Google Pixel 6, Pixel 7 series, Pixel Fold | 5 years of OS and security updates | Pixel 6 |
| Samsung Galaxy S24 series | 7 generations of OS upgrades, 7 years of security updates | Galaxy S24 |
| Samsung Galaxy A56 / A36 / A26 | Up to 6 generations of OS and One UI upgrades, 6 years of security updates | A56 / A36 / A26 (all launched 2025) |
| Xiaomi / Redmi / POCO | At least 2 years of security updates after first shipment, 3 years or longer on some models | Published per-model EOL list |
Sources: Apple security releases, Google Pixel Phone Help, Samsung Mobile Security, Samsung Newsroom, Xiaomi Security Center
The longevity question, “what phone can last a decade?”, is where iOS and Android diverge most sharply. On iPhone, the current lineup starts at a higher storage tier than the previous generation, with Ceramic Shield 2 providing meaningfully better scratch resistance.
Apple publishes no blanket support window, so the floor has to be read off the release list itself. Apple’s security releases page lists iOS 26.6.1, dated August 17, 2026, as available for iPhone 11 and later, alongside a same-day iOS 18.7.10 for iPhone XS, iPhone XS Max and iPhone XR. Apple announced iPhone 11 on September 10, 2019, with pre-orders from September 13 and availability from September 20.
Android longevity is a maker-by-maker question, and the makers publish it in different units. Google commits Pixel 8 and later phones to 7 years of OS and security updates, counted from when the device first became available on the Google Store in the US, and Pixel 6, Pixel 7 and Pixel Fold models to 5 years.
Samsung splits its commitment across two launch announcements. Its Galaxy S24 materials promise seven generations of OS upgrades and seven years of security updates, while the Galaxy A56, A36 and A26 carry up to six generations of Android OS and One UI upgrades with six years of security updates.
The company’s own security-update scope page sets the outer bound. Samsung dates its security-update extension to January 2024, caps it at up to 7 years for Galaxy devices, and delivers it on monthly, quarterly and biannual firmware tracks. Below the flagship tier, the published floor drops. Xiaomi’s security centre, covering the Xiaomi, Redmi and POCO brands, maintains security updates for at least 2 years after a model’s first shipment and says it may support some models for 3 years or longer.
Mid-range and budget Android splits sharply lower: A sub-$200 device from a small OEM may stop getting security updates within the second year. The gap between “iPhone lifespan” and “Android lifespan” is really a gap between iPhone lifespan and the specific Android model’s lifespan.
Google’s own distribution dashboard measures devices active on Google Play during a 7-day window ending November 24, 2025, and groups them by screen size and density.
Mobile Security: iPhone vs Android Exposure
- Apple worldwide account-request compliance, 2013: 54%
- Apple worldwide account-request compliance, peak 2021: 85%
- Apple worldwide account-request compliance, 2024: 78%
- Android global OS share (surface-area exposure): 68.36% (July 2026, StatCounter)
- iOS global OS share (surface-area exposure): 31.6% (July 2026, StatCounter)
The “who gets hacked more” question has two honest answers. On the platform-exposure side, Android’s global OS majority means Android devices are the larger surface area for opportunistic malware, all else equal. On the device-security side, both Apple and Google publish monthly security bulletins and both platforms have shipped mitigations for zero-click and physical-access attack chains recently.
The public data most readers can inspect directly is Apple’s own transparency reporting. Apple’s Transparency Report shows worldwide account-request compliance climbing from the early years to a peak in 2021, then easing back in each of the three reporting years since. The trend is a useful proxy for how frequently Apple hands over customer account data, including photos, email, iOS device backups, contacts or calendars, when governments ask.
There is no equivalent public per-request compliance rate published by Google for Android accounts, so the numeric side of “who hands over more data” cannot be compared symmetrically. What is comparable is that both platforms now publish monthly security bulletins, and both ship first-party security telemetry into research communities like Project Zero.
Is the iPhone or Android the #1 selling phone in the world?
The framing of “#1 phone” depends on which cut of the data you pick. By Q1 2026 shipments, Counterpoint ranks Apple first at 21% share, with Samsung second at a rounded 21%. By worldwide mobile OS use, Android leads Apple’s iOS about 2.16 to 1. By handset vendor web share, Apple’s 31.59% July 2026 share is the largest single-brand slice. Three different questions, three different winners.
Are iPhone sales declining?
No, not on the current data. Apple’s Q4 FY2025 (September quarter ended September 27, 2025) delivered a September-quarter iPhone revenue record and quarterly revenue up 8% year over year, and Q1 2026 Counterpoint numbers put Apple shipments up 9% year over year despite the overall global market falling 3% in the same quarter on memory-chip supply constraints and weaker demand. The unit-share line is close to flat quarter to quarter; the direction on both revenue and units is up, not down.
Are there more Android or iPhone users in the US?
There are more iPhone users in the measure that is actually published. StatCounter’s US mobile OS panel for July 2026 puts iOS at 59.58% versus Android at 40.39%, which is a share of US mobile web traffic rather than a count of people.
Set that beside Pew Research’s finding that about 91% of US adults own a smartphone, measured in its February to June 2025 survey wave, a self-reported ownership rate that never splits owners into iOS and Android. The two answer different questions and do not multiply into a headcount, so the honest reading is a traffic-share majority for iOS, not a user total. Global data flips the ranking: worldwide, Android leads iOS 68.36% to 31.6%.
Conclusion
This year’s numbers make three things clear that a single headline cannot. Android’s 68.36% global lead is real and durable, driven by India, Africa, South America and the broader Asia region where price-tier competition keeps Android dominant. Apple’s iOS lead of 59.58% in the United States, 53.92% in the UK and 63.59% in Japan is equally real and durable, driven by installed-base loyalty and carrier subsidy structures in high-income markets. The “who dominates” question is really “who dominates where”, and StatCounter’s panel makes the map easy to read.
Apple’s shipment tie with Samsung is the first time in the current six-quarter Counterpoint window that Apple has led a Q1, and its FY2025 revenue on that same shipment share shows why the profit pool sits where it sits. HONOR’s outsized growth into a shrinking market is a signal that the third tier of Android OEMs is not standing still. The pace of 5G network build-out and AR-capable hardware roll-outs from both camps will be worth watching alongside the next quarterly print.