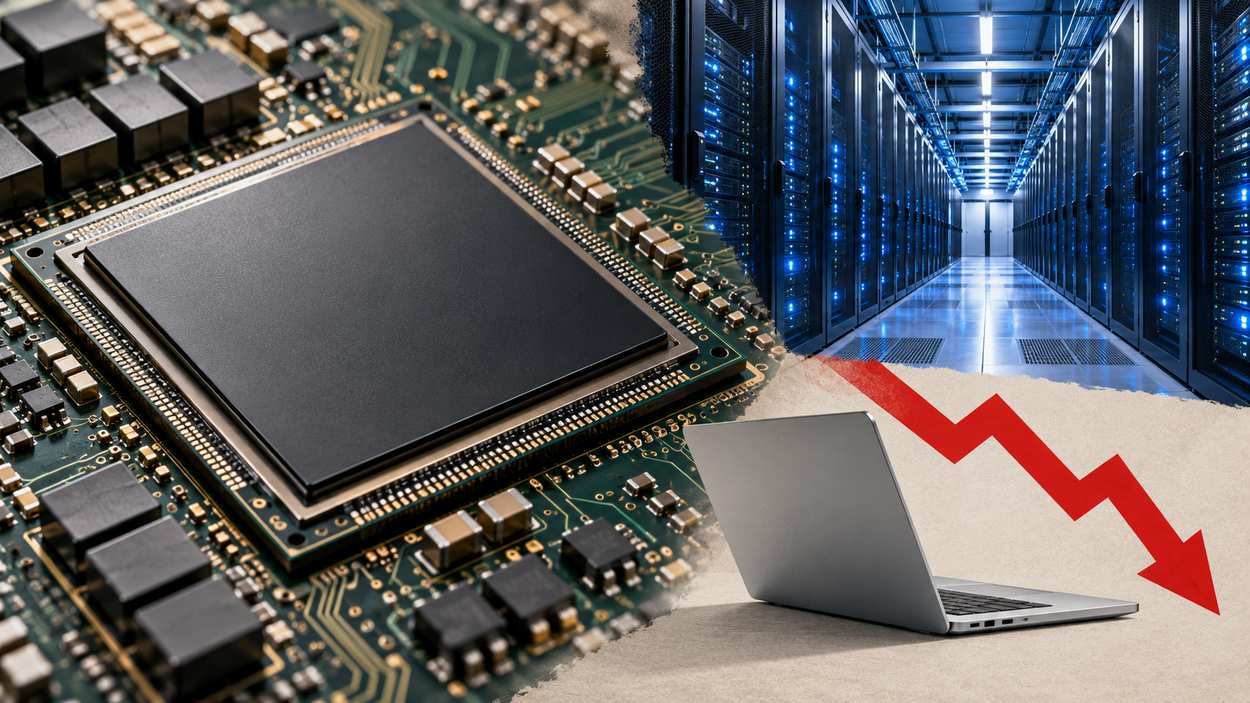


Worldwide IT spending is expected to reach $6.37 trillion in 2026, up 14.2% from 2025, according to Gartner’s latest forecast. That figure sits above the $6.15 trillion Gartner projected in February and the $6.31 trillion it projected in April, and these technology growth statistics show most of that upgrade going to data center systems built for AI.
Worldwide spending on AI is forecast to total $2.7 trillion in 2026, a 49.5% increase year over year, and the global semiconductor market is projected to grow 89.9% in 2026, reaching $1.51 trillion. PC shipments are moving the other way. Worldwide PC shipments fell 20.1% year over year in Q3 2026 to 62.7 million units, according to IDC. Technology growth is splitting in two, with spending, chips, and investment racing ahead of PC shipments.
Key Takeaways
- Gartner’s 2026 IT spending forecast rose from $6.15 trillion in February to $6.31 trillion in April and $6.37 trillion in July.
- Data center systems spending is forecast to rise from $506 billion in 2025 to $822 billion in 2026.
- AI infrastructure makes up about 55.6% of Gartner’s 2026 AI spending forecast.
- Global semiconductor sales were $159.7 billion in August 2026, 144.3% more than the August 2025 total, while PC shipments fell 20.1% in Q3 2026.
- The United States led private AI investment in 2025 with nearly $285.9 billion, 23.1 times China’s $12.4 billion.
- US employment of data scientists is projected to increase 33.5% between 2024 and 2034, against 3.1% for all occupations.
Editor’s Choice
- Worldwide IT spending, 2026: $6.37 trillion, up 14.2%.
- Worldwide AI spending, 2026: $2.7 trillion, up 49.5%.
- Semiconductor market, 2026: $1.51 trillion, per the World Semiconductor Trade Statistics (WSTS) organization’s Spring 2026 forecast.
- Global private AI investment, 2025: $344.7 billion, up 127.5%.
- NVIDIA quarterly revenue: $96.2 billion for the quarter ended July 26, 2026, up 106% from a year ago.
- People online, 2025: an estimated 6 billion, about three-quarters of the world’s population.
Technology Growth Statistics: Global IT Spending
- Overall IT spending was $5,577 billion ($5.577 trillion) in 2025, the base for this year’s forecast.
- Software spending is forecast at $1,468 billion in 2026.
- Devices spending is forecast at $868 billion in 2026.
- Services spending is forecast at $1,570 billion in 2026.
- In its April edition, Gartner said IT services, including IaaS, would see the largest overall spending, surpassing $1.87 trillion ($1,870 billion) in 2026.
- Gartner’s forecast methodology relies on analysis of the sales by over a thousand vendors across the entire range of IT products and services.
| Segment | 2025 Spending ($ billions) | 2026 Spending ($ billions) |
|---|---|---|
| Data Center Systems | 506 | 822 |
| Devices | 790 | 868 |
| Software | 1,271 | 1,468 |
| Services | 1,492 | 1,570 |
| Infrastructure as a Service (IaaS) | 222 | 287 |
| Communications Services | 1,296 | 1,354 |
| Overall IT | 5,577 | 6,369 |
Source: Gartner, July 2026
About This Data
- Compiled from 15 sources: 5 research firm forecasts (Gartner and IDC), 4 government and United Nations agency releases, 3 semiconductor industry association reports, 2 company earnings releases, and 1 university report.
- Sources are dated September 2025 to October 2026, and only primary publishers and official data qualify.
- Figures are reviewed on a rolling basis and updated when sources publish new editions.

How much is the tech industry worth?
No single official number exists, so spending is the closest yardstick. Gartner expects worldwide IT spending to reach $6.37 trillion in 2026, and software alone accounts for $1,468 billion of that total.
How Gartner’s 2026 IT Spending Forecast Changed
- Gartner’s July 2026 forecast puts 2026 IT spending at $6.37 trillion, the headline figure in the chart below.
- In February 2026, Gartner expected 2026 IT spending growth of 10.8%.
- By April, the expected growth rate had risen to 13.5%, and the July forecast put it at 14.2%.
- Gartner’s latest total is about $213.5 billion above its February forecast.
- Gartner’s 2026 growth estimate for data center systems climbed from 31.7% in February to 55.8% in April, and the July table puts it at 62.5%.
- Gartner said its July revision places greater emphasis on AI-related spending, with incremental growth increasingly concentrated in segments directly benefiting from AI adoption.
View the data
Data center systems accounted for most of the upgrade between February and July.
Recent Developments
- October 8, 2026: IDC reported that worldwide PC shipments fell 20.1% year over year in Q3 2026, the second consecutive decline.
- October 5, 2026: The Semiconductor Industry Association (SIA) reported global semiconductor sales of $159.7 billion in August 2026, up 8% from July.
- September 16, 2026: Gartner forecast worldwide AI spending of $2.7 trillion in 2026.
- August 26, 2026: NVIDIA reported Data Center revenue of $89.0 billion, up 117% from a year ago.
- July 29, 2026: Microsoft said Azure revenue surpassed $100 billion for the first time this year.
- July 27, 2026: Gartner raised its 2026 worldwide IT spending forecast to $6.37 trillion.
Data Center and Cloud Spending Growth
- Data center systems spending is forecast to grow 62.5% in 2026, the headline figure in the chart below.
- Infrastructure as a service (IaaS) spending is forecast to rise from $222 billion in 2025 to $287 billion in 2026.
- Gartner named data center systems and IaaS the top growth segments, reflecting accelerating investment in AI infrastructure, cloud platforms, and intelligent applications.
- Server spending was projected in February to grow 36.9% year over year in 2026.
- Microsoft’s Azure and other cloud services revenue increased 43% in the quarter ended June 30, 2026.
View the data
Cloud demand shows up on both sides of the ledger: providers buy the servers, then rent them out as IaaS, a pattern our cloud adoption statistics follow from the customer side. Gartner Distinguished VP Analyst John-David Lovelock also warned that technology budgets are being strained by inflation, supply shortages, rising hardware and memory costs, AI funding initiatives, and shifting priorities.
AI Spending Statistics
- Worldwide AI spending is forecast to total $2.7 trillion in 2026, a 49.5% increase year over year.
- AI infrastructure spending is forecast at $1,484,397 million ($1,484.4 billion) in 2026.
- AI services spending is forecast at $576,481 million ($576.5 billion) in 2026, and AI software at $461,637 million ($461.6 billion).
- Spending on generative AI models is forecast to grow about 2.2 times between 2025 and 2026.
- Gartner expects transformation and indirect projects to drive a $1.2 trillion opportunity in AI services by 2030.
View the data
AI cybersecurity spending is forecast to rise from $25,920 million in 2025 to $51,347 million in 2026, and the table below breaks out the largest markets.
| AI Market | 2025 ($ millions) | 2026 ($ millions) |
|---|---|---|
| AI Infrastructure | 981,920 | 1,484,397 |
| AI Services | 434,046 | 576,481 |
| AI Software | 288,168 | 461,637 |
| AI Cybersecurity | 25,920 | 51,347 |
| AI Agents and Assistants | 16,481 | 29,219 |
| Generative AI Models | 13,021 | 28,266 |
| AI Platforms for Data Science and Machine Learning | 19,405 | 26,445 |
Source: Gartner, September 2026
Which technology will dominate the future?
No forecast settles that question, but spending points to AI. Gartner expects worldwide AI spending of $2.7 trillion in 2026, with AI infrastructure at $1,484,397 million. Adoption data in our artificial intelligence statistics shows how far use has spread beyond the buyers of that hardware.
Semiconductor Market Growth
- WSTS projects the global semiconductor market to grow 89.9% in 2026, reaching $1.51 trillion.
- The Memory segment is forecast to surge by 249.5% year over year, reaching $803,941 million in 2026.
- Logic is expected to grow 37.3% in 2026, and Microprocessors 19.8% and Analog 10.2%.
- For 2027, WSTS forecasts a further 26.6% gain, reaching $1,913,683 million.
- Memory is again expected to lead 2027 growth at 32.1%.
View the data
By the numbers: WSTS expects memory revenue to climb from $230,042 million in 2025 to $803,941 million in 2026, driven by demand for AI infrastructure, high-bandwidth memory (HBM) and accelerated computing. Memory accounts for about 80.2% of the market’s added revenue in 2026.
Vendor-level revenue and supply data sits in our AI chip statistics, which track the accelerators that drive this memory demand.
Chip Sales Growth by Region
- Global semiconductor sales reached $159.7 billion in August 2026, 144.3% more than the August 2025 total of $65.4 billion.
- SIA said annual global semiconductor sales surpassed $1 trillion through August, a first, with sales projected to exceed $1.6 trillion in 2026, an October 2026 SIA projection that runs above the $1.51 trillion in the WSTS Spring 2026 forecast.
- Second-quarter 2026 sales were $403.3 billion, an increase of 35.1% compared to Q1 of 2026.
- Monthly sales are compiled by WSTS and represent a three-month moving average.
- For full-year 2026, WSTS projects the Americas to grow 112% and Asia Pacific 87%; the chart below instead shows SIA’s year-to-year sales growth for the month of August 2026.
View the data
The regional spread tracks where AI data center buyers sit, with the Americas ahead of every other region in August 2026, up 180.9% year over year.
AI Investment Statistics
- Global private investment in AI reached $344.7 billion in 2025, a 127.5% increase over the previous year.
- Generative AI companies accounted for $170.9 billion, nearly half of all private investment and an increase of over 200% from 2024.
- The number of newly funded AI companies grew 70.8% year over year in 2025.
- The United States was the global leader with nearly $285.9 billion invested, 23.1 times China.
- The United States also led with 1,953 newly funded AI companies in 2025, compared to 172 in the United Kingdom and 161 in China.
View the data
Key finding: Stanford’s AI Index reports that more than half of total US private AI investment in 2025 was generative AI-related, at $163.6 billion, while the combined generative AI investment by China and Europe was $4.7 billion. The gap is wider for generative AI than for AI overall, which concentrates model development in one market.
Round-by-round deal data in our AI funding tracker shows where this money lands month to month.
NVIDIA and Microsoft Revenue Growth
- NVIDIA reported revenue of $96.2 billion for the quarter ended July 26, 2026, up 106% from a year ago.
- NVIDIA’s GAAP and non-GAAP gross margins were both 75.0%.
- Microsoft revenue was $90.0 billion in the quarter ended June 30, 2026, an increase of 18%.
- Microsoft 365 Copilot reached over 30 million paid seats.
- Microsoft operating income was $40.6 billion, an increase of 18%.
| Company and Revenue Line | Quarterly Revenue ($ billions) | Year-over-Year Growth (%) |
|---|---|---|
| NVIDIA total | 96.2 | 106 |
| NVIDIA Data Center | 89.0 | 117 |
| Microsoft total | 90.0 | 18 |
| Microsoft Cloud | 59.3 | 27 |
| Microsoft Intelligent Cloud | 39.3 | 32 |
Source: NVIDIA Q2 fiscal 2027 results, Microsoft fiscal Q4 2026 results
Copilot seat counts sit alongside the subscriber base covered in our Microsoft 365 statistics.
PC Shipment Statistics
- Worldwide PC shipments fell 20.1% year over year in Q3 2026 to 62.7 million units, a deeper drop than the 3.8% decline in Q2.
- Shipments also slipped 9.1% sequentially, upending the usual pattern in which Q3 outpaces Q2.
- IDC named strategic inventory pull-in and higher price points driven by AI data center build-out as primary drivers of the decline.
- Lenovo, HP Inc., and Dell Technologies together ceded 4.2 points of share, and market leader Lenovo shipped 14.9 million units, down from 19.3 million in Q3 2025.
- Apple’s market share rose from 8.5% to 9.5%, even as its shipments fell 11.3%.
View the data
Why it matters: IDC said vendors and channels rushed to stock up ahead of memory-driven price hikes earlier in the year, leaving the third quarter with little demand to draw on. The same memory boom lifting chip revenue is raising device prices, so AI growth and PC weakness are two sides of one supply squeeze.
Internet and 5G Adoption Statistics
- An estimated 6 billion people, about three-quarters of the world’s population, are using the Internet in 2025, up from a revised estimate of 5.8 billion in 2024.
- The world’s online population grew by more than 240 million people in 2025.
- 2.2 billion people remain offline, down from a revised estimate of 2.3 billion in 2024.
- 5G accounts for about one-third, or around 3 billion, of all mobile broadband subscriptions worldwide.
- 5G networks are estimated to cover 55% of the world’s population in 2025.
- 84% of people in high-income countries have access to 5G, compared with only 4% in low-income countries.
View the data
Income is the widest gap in the chart: 94% of people in high-income countries use the Internet, against 23% in low-income countries. Country-by-country access figures appear in our internet statistics, and network rollout data in our 5G statistics.
How has technology influenced society?
Access is the most measurable change. An estimated 6 billion people, about three-quarters of the world’s population, use the Internet in 2025, according to the International Telecommunication Union. Still, 96% of those offline live in low- and middle-income countries, so the benefits remain uneven.
US Tech Job Growth Statistics
- Employment of data scientists is projected to increase 33.5% between 2024 and 2034, the headline figure in the chart below.
- Software developer employment is projected to grow by 267,700 jobs, the largest increase in the number of jobs among these occupations.
- Customer service representative jobs are projected to fall by 153,700 over the same decade.
- About 280,000 openings are projected each year, on average, in computer and information technology occupations.
- The median annual wage for this group was $109,470 in May 2025, against $50,980 for all occupations.
| Occupation | Projected Employment Change, 2024 to 2034 (%) |
|---|---|
| Data scientists | 33.5 |
| Information security analysts | 28.5 |
| Computer and information research scientists | 19.7 |
| Software developers | 15.8 |
| Total, all occupations | 3.1 |
| Customer service representatives | -5.5 |
Source: US Bureau of Labor Statistics, July 2026
According to the Bureau of Labor Statistics, adoption of AI technologies, including generative AI tools, is expected to fuel strong job growth among computer and mathematical occupations. The declines sit in office support roles, the same pattern our AI job loss statistics track across employers.
Most Innovative Countries in Technology
- Switzerland, Sweden, the United States, the Republic of Korea and Singapore top the Global Innovation Index (GII) 2025 ranking.
- China breaks into the GII top 10 for the first time.
- The GII uses some 80 indicators to evaluate nearly 140 world economies.
- R&D growth fell to 2.9% in 2024, a slowdown from the 4.4% increase in the year prior.
- WIPO projects R&D growth to slow further in 2025, to 2.3%.
| Rank 2025 | Economy | Rank 2024 |
|---|---|---|
| 1 | Switzerland | 1 |
| 2 | Sweden | 2 |
| 3 | United States | 3 |
| 4 | Republic of Korea | 6 |
| 5 | Singapore | 4 |
| 6 | United Kingdom | 5 |
| 7 | Finland | 7 |
| 8 | Netherlands | 8 |
| 9 | Denmark | 10 |
| 10 | China | 11 |
Source: World Intellectual Property Organization (WIPO), Global Innovation Index 2025
Which country is No. 1 in technology?
Switzerland ranks first in the World Intellectual Property Organization‘s Global Innovation Index 2025, ahead of Sweden and the United States. Ranked by private AI investment alone, the answer changes: the United States was the global leader in 2025 private AI investment, with nearly $285.9 billion.
Conclusion
Gartner’s forecast of $6.37 trillion in worldwide IT spending and its $2.7 trillion AI spending forecast describe a market growing fast but unevenly. Data center systems account for the largest share of the IT spending increase, while PC makers face the price pressure that same build-out creates.
The next tests are whether chip demand holds once data center capacity catches up, and whether device prices ease. Gartner’s quarterly revisions and the monthly sales data from the SIA will show the answer first.