





Digital payments continue to define modern commerce. Each serves millions of merchants, powering e-commerce, mobile apps, and peer-to-peer transactions worldwide. From freelancers to Fortune 100 giants, businesses rely on these systems for speed, scalability, and security. This article explores the latest statistics comparing PayPal and Stripe, uncovering how they perform across user bases, transaction volumes, pricing, and innovation.
Editor’s Choice
- PayPal processed an estimated $1.68 trillion in total payment volume (TPV) in 2024, a growth of ~10% year-over-year.
- Stripe generated around $1.4 trillion in TPV for 2024, up roughly 38% from the prior year.
- As of Q1 2025, PayPal’s active accounts reached about 436 million, up ~2% year-over-year.
- In 2025, Stripe supported about 1.35 million live websites globally as active checkout integrations.
- PayPal’s standard domestic merchant fee in the U.S. remained at 2.9% + $0.30 (for many transactions) in 2025; Stripe’s standard U.S. rate is 2.9% + $0.30, with volume discounts available.
- PayPal’s micropayment rate (for very small transactions) is 5% + $0.05 in 2025; Stripe generally uses standard pricing unless custom-negotiated.
Recent Developments
- In Q1 2025, PayPal’s TPV grew to approximately $417.2 billion, up ~3% year-over-year (4% on an FX-neutral basis).
- Simultaneously, PayPal’s total transactions dropped ~7% in Q1 2025, to about 6.0 billion transactions.
- PayPal reported that transactions per active account fell by ~1% in that period, to roughly 59.4 transactions per active account.
- Stripe’s TPV in 2025 was reported at $1.05 trillion, marking a ~16% year-over-year increase.
- Stripe’s cross-border payments in 2025 reached $58 billion, aided by improved FX tools and localized payout features.
- Stripe’s fraud-block system reportedly prevented about $2.3 billion in fraudulent transactions in 2025.
- PayPal in 2025 saw mobile payments reaching about $720 billion, representing over 43% of its overall transaction volume.
- PayPal introduced advanced merchant subscription services with monthly fees (e.g., $25/month for advanced reporting) in 2025.
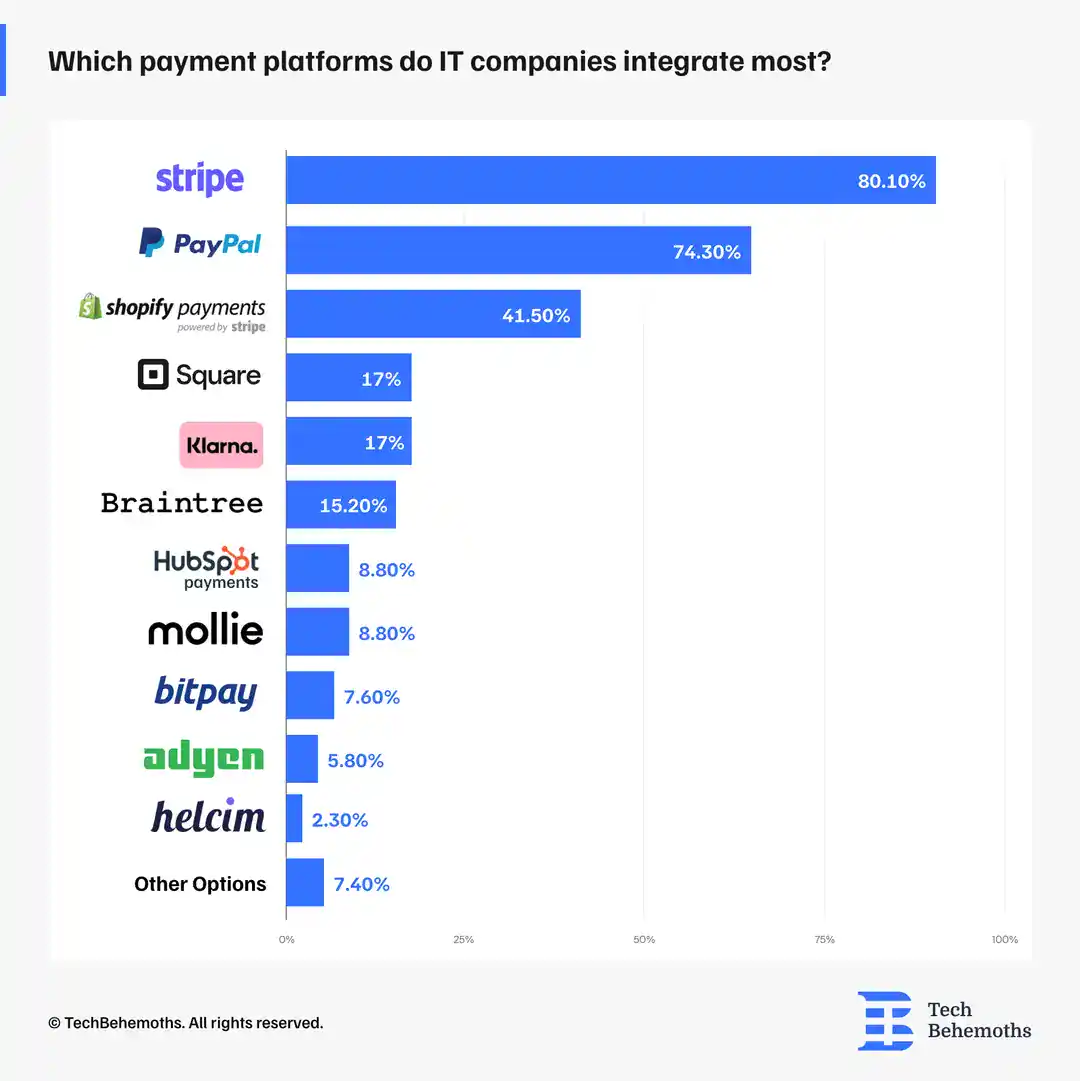
Most Integrated Payment Platforms by IT Companies
- Stripe leads with 80.1% of IT companies integrating it into their systems.
- PayPal follows closely, adopted by 74.3% of IT companies.
- Shopify Payments ranks third with a 41.5% integration rate.
- Square and Klarna are tied at 17%, showing moderate use.
- Braintree is used by 15.2% of IT companies.
- HubSpot Payments and Mollie each record 8.8% adoption.
- BitPay holds 7.6%, showing crypto payment interest.
- Adyen accounts for 5.8%, reflecting limited integration.
- Helcim is the least used, with 2.3% integration.
- Other options make up 7.4%, indicating diverse, smaller choices.
Total Payment Volume (TPV)
- PayPal crossed the $1 trillion mark in TPV in 2021 and achieved ~$1.36 trillion in 2022.
- In 2024, PayPal’s TPV reached ~$1.68 trillion, an approximate 10% increase from 2023.
- For Q1 2025, PayPal’s TPV stood at ~$417.2 billion, up ~3% year-over-year.
- Stripe’s TPV in 2023 was around $1 trillion, up ~26% over 2022.
- Stripe’s TPV reached ~$1.4 trillion in 2024, approximately 38% growth from 2023.
- Some 2025 estimates place Stripe’s TPV at ~$1.05 trillion, indicating conservative reporting or segmented data.
- PayPal’s mobile payments volume in 2025 (~$720 billion) accounted for more than 43% of its overall payment volume.
- Analysts forecast PayPal U.S. TPV might reach ~$1.2 trillion by 2025 with ~12.5% annual growth from prior years.

Active User and Merchant Base
- PayPal had ~434 million active accounts at the end of 2024, up ~1.9% year-over-year.
- In 2025, PayPal reported ~436 million active accounts (2% growth year-over-year) in Q1.
- PayPal serves over 36 million merchants across 200+ markets as of 2025.
- PayPal is accepted on over 10.3 million websites worldwide as a payment option.
- Stripe is used by ~1.35 million live websites globally as of May 2025.
- Of those websites, ~709,545 are U.S.-based, representing ~52.5% of Stripe’s live global sites.
- Stripe supports merchants in over 50 countries; more than 100 of its customers reportedly process over $1 billion per year.
- PayPal’s market penetration: ~45% of the online payment processing market in August 2024.
Global Share of Payment Technologies
- Visa leads worldwide with a 19% share of all payment technologies.
- PayPal follows with 15% of global usage.
- MasterCard holds an 11% share globally.
- American Express accounts for 8%, remaining strong in select markets.
- Stripe and Apple Pay each capture 6%, driven by digital and mobile adoption.
- Amazon Payments has a 4% share, boosted by e-commerce integration.
- Maestro, Google Pay, and Shopify Pay each record a 3% share.
- Other payment technologies collectively lead with 23%, showing a fragmented global market.

Transaction Fees and Pricing Models
- PayPal’s standard U.S. merchant rate remains 2.9% + $0.30 for many transactions in 2025.
- For international transactions, PayPal adds ~1.5% on top of standard fees in 2025.
- Stripe’s standard U.S. pricing is 2.9% + $0.30, with no setup or monthly fees.
- Stripe offers volume-based discounts for merchants processing over ~$80,000/month, according to 2025 data.
- For micropayments, PayPal charges 5% + $0.05 per transaction in 2025.
- Stripe does not publish a separate micropayment tier in most markets; custom pricing may apply.
- Comparing chargeback/dispute fees: PayPal charges $20 per chargeback in the U.S.; Stripe’s typical fee is $15.
- For in-person/QR code transactions, PayPal offers rates as low as 2.29% + $0.09 for certain USD transactions in 2025.
Micropayment Fees Comparison
- PayPal offers a “micropayments” pricing plan (for transactions typically under $10) of 5% + $0.05 per transaction in the U.S. market.
- On its standard plan, PayPal charges ~2.9% + $0.30 for U.S. merchant transactions.
- The micropayments model can yield savings for high-volume small-ticket items: for a $10 transaction, PayPal’s micropayment fee would be $0.55 vs the standard $0.59 (approx).
- PayPal micropayments are only available after a merchant application and once approved; switching means all transactions will be charged at that rate.
- For Stripe, the standard U.S. rate remains ~2.9% + $0.30 for standard online card payments.
- For merchants whose average transaction size is very low (micro-transactions), the choice of provider and fee tier can significantly impact margin due to the fixed fee component.
- If most transactions are under ~$10, PayPal’s micropayment plan may make sense; if transactions are higher, Stripe’s standard model may yield lower cost.
Most Used Payment Processors by Number of Websites Globally
- Google Pay leads with 1.84 million live website integrations.
- PayPal Button is used on 1.40 million websites globally.
- PayPal Express Checkout powers 1.34 million websites.
- Stripe follows with 1.31 million website integrations.
- Klarna appears on 0.79 million websites worldwide.
- PayPal Form is featured on 0.23 million websites.
- Amazon Payments is integrated into 0.20 million sites.
- Braintree supports payments for 0.15 million websites.
- PayPal Donate Button is used on 0.12 million websites.

Chargeback Fees and Rate
- PayPal charges U.S. merchants a standard chargeback fee of $20 per dispute.
- Stripe’s typical chargeback/dispute fee is $15 in the U.S. for standard accounts.
- Stripe refunds the fee if a merchant wins a dispute; similar policies apply for PayPal, depending on the merchant’s tier.
- For international cards, additional fees and currency conversion may raise the effective chargeback cost.
- The average chargeback rate remains below 1% across most industries for both platforms.
- Merchants with high chargeback volumes may qualify for custom pricing or risk-surcharge arrangements.
- Effective dispute handling and fraud-detection tools can reduce chargeback frequency, lowering overall cost.
Accepted Payment Types
- Stripe supports 135+ currencies and over 100 payment methods globally.
- Stripe covers online, mobile, in-person, subscription, and marketplace models through unified APIs.
- PayPal supports payments in 200+ markets, across multiple currencies and wallets (including Venmo in the U.S.).
- Offering one additional payment method beyond cards boosts conversion by ~7% on average.
- Apple Pay through Stripe leads to ~22% uplift in conversion for merchants offering it.
- PayPal offers wallet-based options, QR code payments, and “Pay Later” installments.
- Both platforms increasingly support alternative payment methods such as SEPA and local bank transfers.
Stripe Market Share by Global Region
- North America dominates with 70.2%, showing Stripe’s strongest regional foothold.
- European Union (EU) follows with 15.8%, reflecting strong European adoption.
- APAC (Asia-Pacific) holds 7.9%, indicating moderate market presence.
- Others account for 3.8%, showing a small but diverse global user base.
- LATAM (Latin America) contributes 1.5% to Stripe’s overall share.
- Africa has the smallest share at 0.8%, reflecting limited regional integration.

Credit Card Processing Comparison
- PayPal’s standard online credit/debit card rate is ~2.99% + $0.30 in the U.S.
- Stripe’s rate is 2.9% + $0.30 for domestic U.S. card transactions.
- For international cards, Stripe adds a ~1.5% cross-border fee.
- PayPal’s international transactions often incur an additional ~4% currency conversion markup.
- Stripe’s standard rate is consistent globally, though it varies slightly outside the U.S.
- In-person card rates for PayPal can go as low as 2.29% + $0.09 in select cases.
- High-volume merchants may access custom pricing or interchange-plus models.
International Transactions and Currency Support
- Stripe supports 135+ currencies and local acquiring in 46 markets.
- Stripe charges a currency conversion fee of ~0.5% (U.S.) or ~1–2% (non-U.S.) when conversion is required.
- For international cards, Stripe adds ~1.5% above the domestic rate.
- PayPal’s effective fee on international cards may reach ~4.3% plus a ~2–4% conversion markup.
- PayPal’s standard domestic rate remains ~2.99% + $0.30, with added international charges.
- Merchants must consider both base rate and FX markups when targeting global customers.
- Stripe’s broad currency and method support favor global-first merchants, while PayPal dominates in established markets.
Mobile and E-commerce Integration
- PayPal processed approximately $760 billion in mobile commerce transactions globally in 2025.
- Stripe’s mobile SDKs power ~72% of U.S. app-based commerce platforms in 2025.
- Supporting Apple Pay earlier in checkout doubled conversion compared to the end-stage prompt.
- PayPal’s express checkout improved conversion by ~28% in U.S. retailer tests in 2025.
- Stripe saw a ~41% increase in completed mobile transactions across key verticals.
- PayPal’s QR-code payments at small business venues dropped ~12% post-pandemic.
- Optimized mobile SDKs and streamlined checkouts remain critical for conversion gains.
Security and Fraud Detection Metrics
- PayPal’s AI evaluates over 500 data points per transaction across ~400 million accounts.
- PayPal blocks about $500 million in fraud every quarter through its AI-driven monitoring.
- PayPal’s fraud-to-volume ratio remains below 0.20% in 2025.
- Stripe’s Radar tool stopped $2.3 billion in fraudulent activity in 2025.
- Stripe reports 97.5% of users rated its security as “excellent” in 2025.
- Stripe achieved 99.999% platform uptime in 2025.
- PayPal introduced real-time fraud alerts powered by AI in 2025.
- Phishing campaigns targeted ~15.8 million PayPal credentials in 2025.
- Stripe provides instant payout options and faster settlement, reducing risk in fund transit.
Payouts and Transfer Speeds
- Stripe’s manual payouts in the U.S. typically arrive the same business day on a T+2 schedule.
- Stripe’s Instant Payouts appear within 30 minutes under eligible conditions.
- Stripe charges a 1.5% fee for Instant Payouts in the U.S. and 1% elsewhere.
- PayPal merchant payouts often settle within 1–2 business days, depending on account review.
- Stripe high-risk businesses may face payout delays of up to 14 days.
- Settlement times typically range from 1 to 4 business days, depending on banks.
- Stripe supports payout rails across 50+ countries.
- Faster payouts help improve merchant cash flow and working capital management.
Customer Satisfaction and Support Ratings
- Stripe achieved a 92% developer satisfaction in 2025.
- Stripe’s average support chat resolution time dropped to 2.7 minutes in 2025.
- PayPal’s overall customer satisfaction score was 78% in 2025.
- PayPal’s Trustpilot score averaged 1.1–1.3 out of 5 in 2025 for consumer users.
- PayPal scored 4.4–4.7 out of 5 on business platforms for ease of use.
- Stripe earned 4.25 out of 5 across value, security, and scalability.
- PayPal is praised for its consumer trust and brand recognition.
- Stripe’s support is preferred by developers but can challenge non-technical users.
- Both platforms prioritize faster dispute resolutions and live support expansion.
Adoption Rates in Different Industries
- Stripe powers ~78% of subscription-based SaaS companies in 2025.
- Stripe is used by 92% of Fortune 100 companies in 2025.
- About 93% of the top 500 DTC brands use Stripe.
- PayPal’s U.S. small-business adoption rate is ~64% in 2025.
- About 60% of top e-commerce stores offer PayPal checkout.
- Stripe saw a ~22% increase in solopreneur adoption in 2025.
- Marketplace usage of Stripe Connect rose by ~58% in 2025.
- PayPal dominates consumer and small-merchant payments.
- Stripe expanded to new markets like Chile, Pakistan, and Serbia in 2025.
- Platform-based businesses favor Stripe; consumer-first merchants often prefer PayPal.
Developer and Customization Features
- Stripe supports 54 programming languages and frameworks in 2025.
- Enterprise adoption of Stripe’s custom APIs grew by 41%.
- Stripe’s AI automation reduced manual workflows by 26% in 2025.
- Stripe supports crypto tools with over 150 digital currencies, with virtual-card volume at $13.4 billion.
- PayPal launched an AI-powered help assistant, improving resolution rates by 31%.
- PayPal’s developer satisfaction reached ~78% versus Stripe’s 92%.
- Stripe’s “Link” one-click checkout speeds payments by 40%+.
- Stripe added Adaptive Pricing and Embedded Payment Elements in 2025.
- PayPal offers faster setup, while Stripe offers deeper customization for platforms.
- Developer flexibility is a key differentiator in modern payment platforms.
Frequently Asked Questions (FAQs)
PayPal: 19.4%, Stripe: 12.2%.
Around 430 million.
$18.9 billion, up 11.2% from 2024.
Conclusion
PayPal and Stripe continue to dominate digital payments but serve distinct needs. PayPal excels in consumer trust, simplicity, and checkout recognition, while Stripe thrives on developer control, global scalability, and API-driven innovation. Businesses must weigh transaction costs, global reach, and customization requirements when choosing between them. As digital transactions expand and AI reshapes fraud and efficiency, both platforms remain central to the future of online commerce.