• Skip to primary navigation
  • Skip to main content
  • Skip to primary sidebar
  • Skip to footer
Sq Magazine LogoSQ Magazine

Smarter Insights for a Fast-Moving Digital World

  • Latest News
  • Statistics
  • Tools
  • About
  • Contact
  • Subscribe
Subscribe
Sq Magazine Logo
  • The Threat Index
  • Breaches
  • Phishing
  • Fraud
  • Privacy
  • Cybercrime
  • Vulnerabilities
Add as a preferred
source on Google
Home » Cybersecurity

Online Payment Fraud Statistics 2026: What You See

Published on: February 6, 2026
Sofia Ramirez
Senior Tech Writer • 695 Articles
Sofia Ramirez is a technology and cybersecurity writer at SQ Magazine. With a keen eye on emerging threats and innovations, she helps reader...
LATEST POSTS:
SaaS Affiliate Commission Rates in 2026: What the Numbers Say
Microsoft Paint RCE Fix Lands in Store, Not Windows Update
OpenSSH Fixes Critical Long-Password Bypass on Alpine Linux
Robert A. Lee
Senior Editor • 473 Articles
Robert A. Lee is a journalist at SQ Magazine who unpacks the fast-moving worlds of gaming and internet trends. He tracks everything from maj...
LATEST POSTS:
Yelp Statistics 2026: Reviews, Revenue and Advertiser Base
Education Technology Trends: What Holds Up in 2026
Anthropic Files S-1 for Nasdaq IPO Under Symbol ANT
Online Payment Fraud Statistics
As Featured In
The New York Times LogoForbes LogoWired LogoDeloitte LogoResearch.com Logo
Share on LinkedIn ChatGPT Perplexity Share on X Share on Facebook

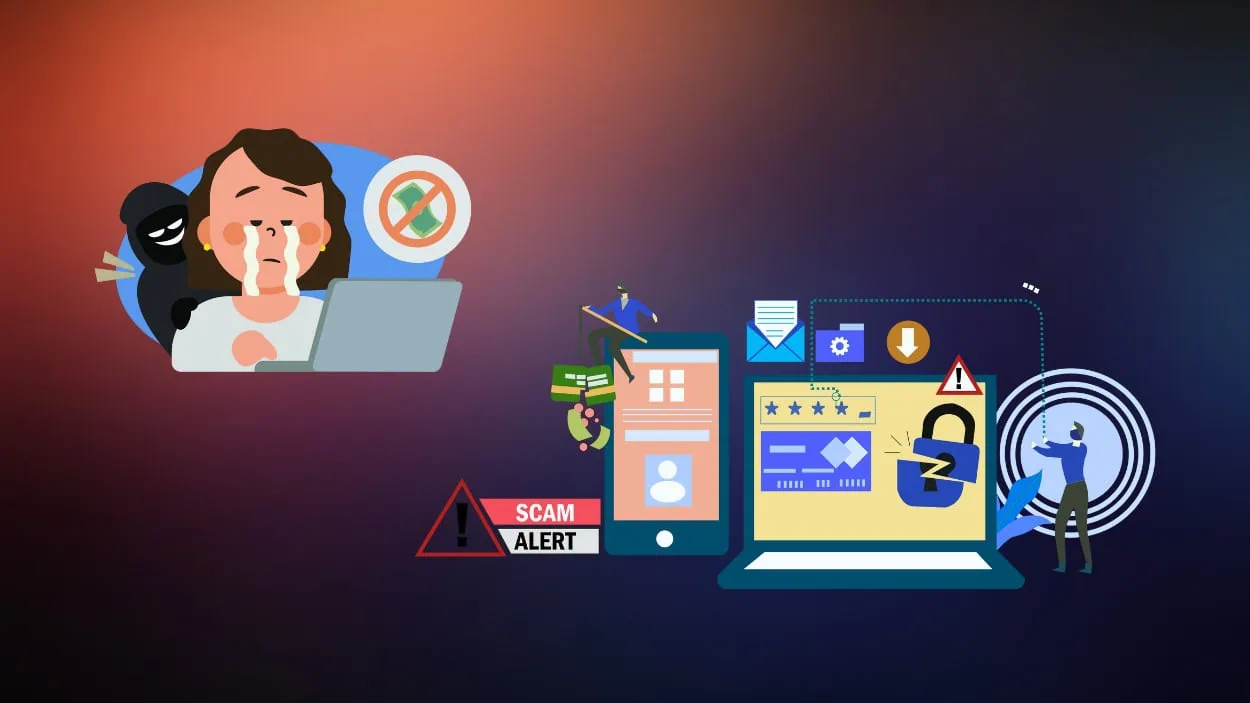
Online payment fraud sits at the intersection of rapid digital adoption and persistent criminal ingenuity. As global online transactions surge, so do fraudulent attacks that siphon money from consumers and businesses alike. This threat affects everyone from small e-commerce sellers coping with chargebacks to financial institutions defending card networks. In retail and fintech, payment fraud can mean lost revenue, rising operational costs, and strained customer trust. Dive into this article to understand the latest statistics shaping online payment fraud.

Editor’s Choice

  • 3.3% of e-commerce revenue is lost annually to payment fraud.
  • 79% of marketplaces report rising fraud rates in 2025.
  • $4.61 per $1 lost is the total cost impact on U.S. merchants for every fraud dollar in 2025.
  • 57.8% of U.S. ecommerce fraud was generated domestically in 2025.
  • 45% of merchant dispute volume is attributed to first- and third-party fraud.
  • $43.6 billion, projected global ecommerce fraud losses by 2027.

Recent Developments

  • 79% of online marketplaces reported increased fraud activity in the past year.
  • Nearly half of all scam blocks in 2025 happened in the final quarter.
  • Governments globally are tightening online fraud regulation, including rules forcing platforms to remove fraudulent ads and reimburse institutions for customer losses.
  • Machine learning and large-scale graph analysis techniques are emerging as advanced fraud detection methods in 2025 and 2026 research.
  • Telemetry shows surging e-shop scams across desktop and mobile environments.
  • Merchants are deploying more fraud detection tools, on average 5 per business, to adapt to evolving threats.
  • Credit and debit card fraud projections show steady upward pressure through 2027.

Types of Fraud

  • Phishing constitutes 90% of successful cyber attacks.​
  • Identity theft generates 12% of total fraud losses from 7% of cases.​
  • Chargeback fraud accounts for 10% of fraud cases and 9% of losses.​
  • Friendly fraud stems from 70% of all chargebacks.​
  • Card-not-present fraud losses reach $28 billion globally.​
  • Synthetic identity fraud drives 7% of losses from 4% of cases.​
  • Loyalty and gift card fraud: 57% of consumers experienced it recently.​
  • Account takeover comprises 13% of fraud occurrences and 12% of losses.​
Distribution Of Fraud Types By Cases And Losses

Fraud Losses

  • Annual global ecommerce fraud losses already sit around $48 billion per year.
  • E-commerce represents 3.3% of yearly revenue, lost to payment fraud.
  • Chargebacks alone could account for $28.1 billion in merchant losses by 2026.
  • Losses from chargebacks are projected to reach $41.69 billion by 2028.
  • U.S. merchants incur, on average, $4.61 in total cost for every $1 lost to fraud.
Newsletter
Don’t chase tech news. We track it for you.

One weekly briefing with the launches, AI developments, and breaches that matter. No filler.

Read by pros at Fortinet, TSMC, Barclays, and Deloitte.

Phishing Attacks

  • Phishing contributes 90% of successful cyber attacks.​
  • 43% of global merchants report phishing attacks.​
  • 82.6% of phishing emails contain AI-generated content.​
  • Automated tools enable 1.13 million phishing attacks quarterly.​
  • Simulated phishing tests yield click rates of 3-7%.​
  • Phishing combines with social engineering in 68% of breaches.​
  • Data breaches fuel phishing, exposing 2.6 billion records yearly.​
  • 193,407 phishing complaints were reported to the FBI.​
  • Remote purchase fraud via phishing costs $16.6 billion.​
  • 45% of professionals victim to phishing scams.

Common Methods

  • Phishing emails account for 36% of data breaches.​
  • Social engineering succeeds in 85% of targeted attacks.
  • Data breaches expose 2.6 billion personal records annually.​
  • Refund abuse affects 47% of merchants.​
  • Automated bots drive 70% of online fraud attempts.
  • Synthetic identities represent 20% of fraud cases.
  • Chargeback exploitation causes $25 billion in global losses.
How Fraud Is Most Commonly Executed

Chargeback Fraud

  • E-commerce chargeback rates average 0.6%-1% for CNP payments.​
  • Friendly fraud comprises 70% of all chargebacks.​
  • Global chargeback costs are projected at $125 billion.​
  • U.S. merchants lose $15 billion to chargeback fraud annually.​
  • Merchants spend $35 per $100 in chargeback disputes.​
  • Average chargeback value reaches $169.13.​
  • eCommerce chargeback rates surged 222% year-over-year.​
  • 72% of merchants saw friendly fraud chargeback increases.​
  • Merchants win only 17.4% of fraud-coded chargebacks.​
  • Chargeback volume is expected to grow 24% by 2028.

Friendly Fraud

  • Friendly fraud accounts for 70% of all chargebacks.​
  • 72% of merchants report increased friendly fraud disputes.​
  • Subscription services face 3x higher friendly fraud rates.​
  • Merchants lose $100 billion annually to friendly fraud globally.​
  • Average friendly fraud chargeback costs merchants $250 per incident.​
  • 65% of friendly fraud stems from customer confusion.​
  • Unclear billing descriptors contribute to 40% of disputes.​
  • Lost goods from friendly fraud total $25 billion yearly.​
  • 85% of merchants now use chargeback mitigation tools.​
  • Dispute analytics reduces friendly fraud by 45%.

Identity Theft

  • Identity theft enables 40% of credit card fraud reports.​
  • OTP scams account for 50% of cybercrime cases regionally.​
  • Social media harvesting aids 70% of account takeovers.​
Most Common Identity Theft Methods
  • Identity theft drives 12.5 billion in financial services losses.​
  • Data breaches exposed 149 million credentials recently.​
  • 80% of new account fraud uses stolen identities.​
  • Businesses lose $7 million annually to identity fraud.​
  • 323,459 credit card fraud reports tied to identity theft.​
  • Global identity fraud rate stands at 2.2%.​
  • Victims recover credit damage in 6 months.​

Card-Not-Present Fraud

  • CNP fraud losses total $28 billion globally.​
  • CNP transactions comprise 73% of e-commerce fraud.​
  • CNP drives 60% of chargeback disputes.​
  • Bots execute 80% of CNP card testing attacks.​
  • CNP fraud rates average 1.5% of transactions.​
  • Merchants incur $5.7 billion in CNP prevention costs.​
  • 3DS authentication cuts CNP fraud by 70%.​
  • CNP fraud surged 25% in high-risk categories.​
  • Global CNP volume reaches $3.5 trillion annually.

E-Commerce Fraud

  • Global e-commerce fraud losses hit $81 billion.​
  • U.S. merchants lost $55 billion to e-commerce fraud.​
  • Fraud equals 3.3% of online revenue annually.​
  • 82% of marketplaces report rising fraud rates.​
  • Mobile commerce fraud surged 33% over desktop.​
  • Peak shopping fraud spikes 200% during holidays.​
  • Small retailers face 5x higher fraud costs.​
  • Cross-border fraud rates are 3x domestic orders.​
  • Digital wallet fraud grew 45% year-over-year.

Social Engineering

  • Social engineering causes 74% of cybersecurity breaches.​
  • Phishing represents 90% of social engineering attacks.​
  • 85% of targeted social engineering attacks succeed.​
  • Business Email Compromise costs $2.9 billion annually.​
  • Urgent language boosts compliance by 67% in scams.​
  • SMS scams increased 61% year-over-year.​
Social Engineering Attack Success And Growth

Credit Card Fraud

  • Global credit card fraud losses surpass $35 billion.​
  • CNP transactions fuel 85% of credit card fraud.​
  • Credit card fraud comprises 45% of U.S. payment fraud.​
  • Fraudsters test cards with $1 micro-transactions in 75% of attacks.​
  • EMV chips cut in-store fraud by 87%.​
  • Account takeover drives 30% of card misuse.​
  • Losses projected at $43 billion by 2028.​
  • Merchants absorb 90% of CNP credit card losses.

Alternative Payments

  • Digital wallet fraud rose 25% year-over-year.​
  • BNPL fraud surged 26% in the first half of 2025.​
  • Account takeovers cause 80% of digital wallet fraud.​
  • Alternative payments exceed 50% of global e-commerce volume.​
  • P2P payment scams up 22% with billions lost.​
  • Crypto wallet fraud increased 25%.​
  • QR code scams in alt payments grew 35%.​
  • Strong authentication reduces alt payment fraud 60%.

Regional Trends

  • North America suffers $15 billion in digital payment fraud losses.​
  • U.S. online fraud losses exceed $16.6 billion.​
  • Asia-Pacific accounts for 48% of global fraud incidents.​
  • Latin America ecommerce revenue loss hits 20% to fraud.​
  • Europe’s phishing scams rose 35%.​
  • Africa’s mobile money fraud surged 28%.​
  • Cross-border fraud increased 20% globally.​
  • Latin America fraud attempts up 32%.

Industry Impacts

  • Retailers lose $207 for every $100 in fraud.​
  • Financial institutions face a $4.61 cost per $1 fraud loss.​
  • Fraud adds 3.3% to consumer prices via fees.​
  • Subscription services suffer 3x average friendly fraud.​
  • 98% of merchants are hit by fraud, impacting their experience.​
  • High fraud drops approval rates by 15-20%.​
  • Processors terminated 12% high-risk merchants.​
  • 75% plan fraud prevention budget hikes.

Frequently Asked Questions (FAQs)

Which region accounts for the largest share of digital payment fraud cases worldwide?

The Asia-Pacific region accounts for about 45% of global digital payment fraud cases.

What proportion of fraud victims are unaware of reimbursement policies related to APP scams?

71% of victims were unaware of reimbursement policies in the context of authorised push payment (APP) fraud.

What percentage of digital payment fraud incidents involve mobile devices?

Approximately 75% of digital payment fraud incidents now involve mobile devices.

Conclusion

Online payment fraud continues to evolve alongside digital commerce, creating persistent financial and operational risks. Across ecommerce, credit cards, and alternative payments, fraud losses now total tens of billions of dollars annually, affecting every region and industry. As fraud techniques grow more sophisticated, businesses must rely on accurate data, layered defenses, and informed customers. Understanding these statistics provides a foundation for building safer and more resilient payment ecosystems.


This article has been reviewed and fact-checked by Robert A. Lee. SQ Magazine follows strict Publishing Principles and a documented Fact-Check Policy to ensure accuracy, transparency, and editorial independence across all content. Our statistics are verified using a documented Research Process.

Add SQ Magazine as a Preferred Source on Google for updates! Follow on Google News
Share ChatGPT Perplexity

References

  • Statista
  • World Economic Forum
  • US Govt
  • Alloy
  • ResearchGate
Sofia Ramirez

Sofia Ramirez

Senior Tech Writer


Sofia Ramirez is a technology and cybersecurity writer at SQ Magazine. With a keen eye on emerging threats and innovations, she helps readers stay informed and secure in today’s fast-changing tech landscape. Passionate about making cybersecurity accessible, Sofia blends research-driven analysis with straightforward explanations; so whether you’re a tech professional or a curious reader, her work ensures you’re always one step ahead in the digital world.

Related Posts

Identity Theft Statistics
Cybersecurity

Identity Theft Statistics 2026: Key Fraud Data and Trends

API Security Breach Statistics
Cybersecurity

API Security Breach Statistics 2026: Hidden Threats

Cybersecurity Statistics
Cybersecurity

Cybersecurity Statistics 2026: The Latest Threats, Costs & AI Defenses

Disclaimer: The content published on SQ Magazine is for informational and educational purposes only. Please verify details independently before making any important decisions based on our content.

Reader Interactions

Leave a Comment Cancel reply

Primary Sidebar

Connect With Us

facebook x linkedin google-news telegram pinterest whatsapp email
google-preferred-source-badge Add as a preferred source on Google

You Should Also Read

Insurance Fraud Statistics 2026: Real Numbers, Big Impact
Digital Identity Statistics 2026: Vital Insights Now
Online Shopping Statistics 2026: Growth Facts

Table of Contents

  • Editor’s Choice
  • Recent Developments
  • Types of Fraud
  • Fraud Losses
  • Phishing Attacks
  • Common Methods
  • Chargeback Fraud
  • Friendly Fraud
  • Identity Theft
  • Card-Not-Present Fraud
  • E-Commerce Fraud
  • Social Engineering
  • Credit Card Fraud
  • Alternative Payments
  • Regional Trends
  • Industry Impacts
  • Frequently Asked Questions (FAQs)
  • Conclusion

Weekly stats quiz Week 45

How much of a tech geek are you?

5 fast questions from this week's verified industry data. About a minute.

Play the quiz New every Monday

Footer

SQ Magazine Logo

Smarter Insights for a Fast-Moving Digital World

Connect With Us

Follow Us on Google News

Editorial & Trust

  • About
  • Publishing Principles
  • Fact-Check Policy
  • Corrections Policy
  • Ethics Policy
  • Disclaimer
  • Cookie Policy

Worth Checking

  • The Tech Index
  • The Threat Index
  • Social Media Attention Span Stats
  • Instagram Followers Stats
  • Google Usage Stats
  • LLM Hallucination Stats
  • Gen Z Social Media Stats
Contact Us
13570 Grove Dr #189,
Maple Grove, MN 55311,
United States
10 a.m. to 6 p.m. | Every day

Copyright © 2022–2026 SQ Magazine. All Rights Reserved. Powered by the Neural Stack.

  • Privacy Policy
  • Terms
  • Accessibility Statement
Company
  • About Us
  • Our Team
  • Our Mission
  • Core Values
Discover
  • Brand Assets
    Brand Assets
  • Stats Methodology
    Stats Research Process
  • Glossary
    Glossary
Categories
  • Internet
  • Technology
  • Artificial Intelligence
  • Gaming
Internet
Yelp Statistics 2026: Reviews, Revenue and Advertiser Base
Influencer Marketing Platform Statistics 2026: Market and Spend
Dailymotion Statistics Users Views and Market Share
Dailymotion Statistics 2026: Users, Views and Market Share
Average Attention Span Statistics The Cross-Domain Numbers
Average Attention Span Statistics 2026: The Cross-Domain Numbers
How Many Videos Are on YouTube Statistics
How Many Videos Are on YouTube Statistics 2026: Key Data
How Many People Work at WhatsApp
How Many People Work at WhatsApp 2026: Employee Count and History
Technology
RevenueCat Statistics Apps Revenue and Market Share
RevenueCat Statistics 2026: Apps, Revenue and Market Share
Linux Distro Market Share Statistics Most Popular Distributions
Linux Distro Market Share Statistics 2026: Most Popular Distributions
Average US Salary Statistics Median Income by Age and State
Average US Salary Statistics 2026: Median Income by Age and State
Aptoide Statistics 2026: Downloads, Users and App Store Share
AppsFlyer Statistics Customers Revenue and Market Position
AppsFlyer Statistics 2026: Customers, Revenue and Market Position
How Many iPhones Has Apple Sold
How Many iPhones Has Apple Sold in 2026? Units Sold by Year
Artificial Intelligence
NotebookLM Statistics Users Growth and Adoption
NotebookLM Statistics 2026: Users, Growth and Adoption
Cursor AI Statistics 2026: Users, Revenue and Developer Adoption
AI Search Engine Statistics Usage Market Share and Adoption
AI Search Engine Statistics 2026: Usage, Market Share and Adoption
AI Music Statistics
AI Music Statistics 2026: Generation, Adoption and Industry Impact
AI Coding Statistics
AI Coding Statistics 2026: Adoption, Productivity and Market Data
How Much Content on Social Media Is AI Generated Statistics
How Much Content on Social Media Is AI Generated Statistics 2026: Hidden Truths
Gaming
Clash Royale Statistics Revenue Players and Engagement
Clash Royale Statistics 2026: Revenue, Players and Engagement
Gaming Statistics
Gaming Statistics 2026: Market Size, Players, Revenue, and Platforms
Roblox vs Minecraft Statistics
Roblox vs Minecraft Statistics 2026: Players, Revenue, Creators
Online Gambling Regulations Statistics
Online Gambling Regulations Statistics 2026: Global Compliance and Enforcement Data
Fantasy Sports Statistics
Fantasy Sports Statistics 2026: Users, Revenue & Trends
Apex Legends Statistics 2026: Players, Revenue, and Esports
Categories
  • Artificial Intelligence
  • Cybersecurity
  • Technology
  • Internet
Artificial Intelligence
Elevenlabs And Soundcloud Partnership Ai Music
ElevenLabs Adds Direct SoundCloud Publishing for AI Music
Chatgpt Work Codex Limits
ChatGPT and Codex to Share Usage Limits as Work Tab Merges
Nvidia Nemotron 3 5 Transcribe Model
Nvidia Releases Open Nemotron 3.5 Transcribe Model for 40 Languages
Google Deepmind Genie 4 Adds Native Audio And Live Scene
Google DeepMind Genie 4 Adds Native Audio and Live Scene Edits
Anthropic European Consultancy Firms
Anthropic and Hg to Launch AI Consultancy for European Firms
Google Cloud Brings Openai Models
Google Cloud Brings OpenAI Models to Enterprise Customers
Cybersecurity
Windows Paint Patch Store
Microsoft Paint RCE Fix Lands in Store, Not Windows Update
Openssh Alpine Linux Flaw Patch
OpenSSH Fixes Critical Long-Password Bypass on Alpine Linux
Ubuntu Debian Apt Patch Fix
Debian and Ubuntu Patch APT Flaw That Hands Attackers Root
Dreamhost Data Breach Confirmed
DreamHost Confirms Hackers Stole Session Tokens and Logins
Siemens Gateway Vulnerabiltiy Exploit
Siemens IoT2050 Flaw Exploited to Plant Node-RED Backdoors
Google Videostrong Android Tv Botnet Disruption
Google Disrupts Massive Android TV Botnet, Bans Device Maker
Technology
Apple App Store Romantic Ai Apps Removal
Apple Moves Romantic AI Companions and Dating Apps to 18+
Amazon Echo Time Smart Device Launch
Amazon Unveils Echo Time: A Smarter Alarm Clock
Arc Browser Shutdown Confirmed
The Browser Company Will Shut Down Arc on December 22
Spotify Family Plan Qr Sharing
Spotify Adds QR Checks to Verify Family Plan Households
Apple Music New Logo Rebrand
Apple Music Rebrands With a Logo Made by Fred Again’s Music
Apple Homepod Mini 2 Preorder Featured 1
Apple Launches HomePod Mini 2 with £149 and Opens Pre-Order
Internet
Anthropic Files S 1 Ipo With Sec
Anthropic Files S-1 for Nasdaq IPO Under Symbol ANT
Microsoft 365 Family Sharing Storage Cuts
Microsoft 365 Family Faces Massive OneDrive Storage Cut
Meta Launched Meta One Subscription
Meta One Bundles Instagram, Facebook, WhatsApp Into One AI Subscription
Apple Wallet Ids Launch In Oklahoma
Apple Wallet IDs Launch in Oklahoma in Major Expansion
Meta to Pay 18 Billion in Landmark Teen Safety Deal
Meta to Pay $18 Billion in Landmark Teen Safety Deal
Whatsapp Brings Passkeys 2fa
WhatsApp Hits 1 Billion Passkey Users, Adds 2FA Passwords
Security Calculators
  • Random Password Generator Strong random passwords, with the strength of each shown.
  • Uptime Calculator Downtime an uptime target allows, from a day to a year.
  • Download Time Calculator How long a file takes at your connection speed.
Network Tools
  • What Is My IP Address Your public IP, provider and location, read at the edge.
  • IP Subnet Calculator Network, broadcast, host range and mask for any IPv4 block.
  • What Is My User Agent What a user agent string says about the browser behind it.
  • What Is My Screen Resolution Your screen size, pixel ratio and viewport, read live.
  • TXT Record Lookup TXT, SPF and DMARC records for any domain.
All 8 Network Tools
AI Tools
  • Token Counter Token counts for GPT-4o and GPT-4 encodings.
All 12 tools
Newsletter

Too much tech noise?

We respect your time. One high-signal briefing a week: tech, AI, and security. Nothing else.

Read by pros at Fortinet, TSMC, Barclays, and Deloitte.