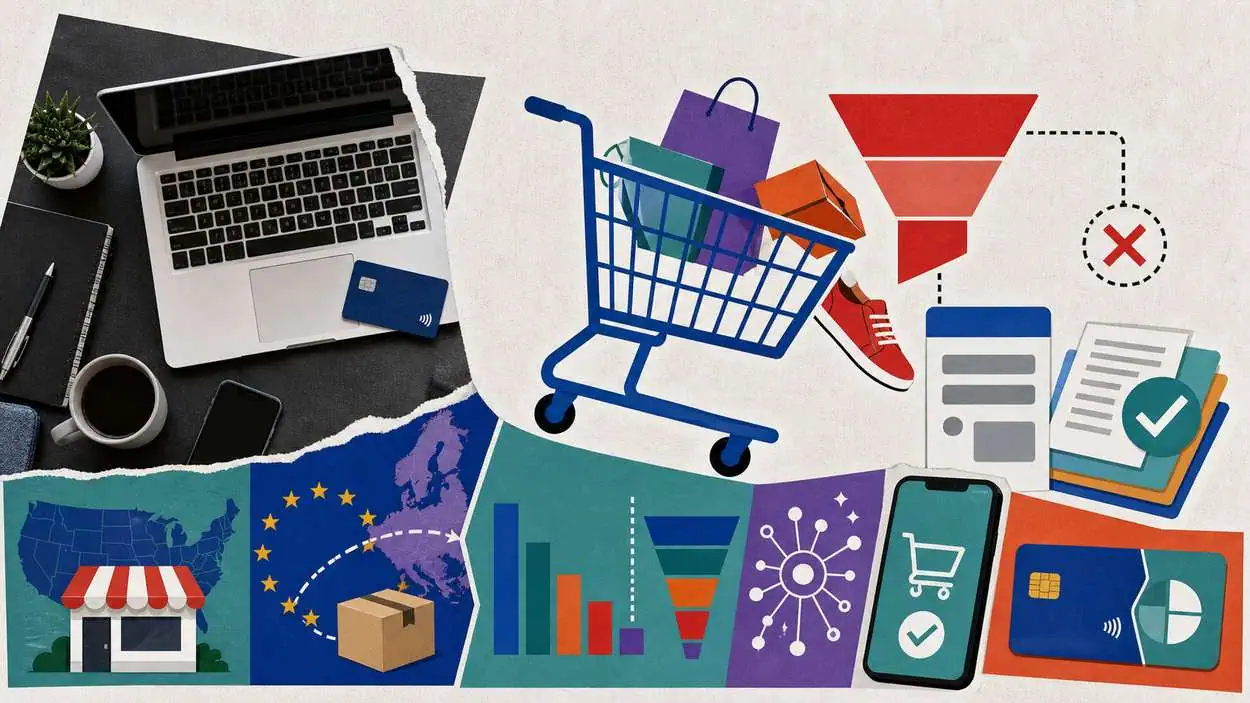






Online shopping continues to reshape how consumers discover, compare, and purchase products. From same-day grocery delivery to AI-powered product recommendations, e-commerce now supports industries like retail, logistics, and digital payments at scale. As brands refine mobile experiences and optimize checkout flows, data reveals where growth accelerates and where friction remains. Let’s explore the latest online shopping statistics to understand what drives this evolving market.
Editor’s Choice
- Global ecommerce sales are expected to exceed $3.8 trillion in 2026, reflecting sustained growth in digital retail.
- Online sales accounted for nearly 25% of total retail sales by 2025, up from about 10% in 2017.
- The average global cart abandonment rate remains high at around 69.8% in 2026.
- Mobile cart abandonment rates reach 85%+, showing persistent friction in mobile checkout.
- AI-driven tools influenced 19% of global online orders, highlighting automation in e-commerce.
Recent Developments
- Global ecommerce continues to grow steadily, with digital channels gaining share even during economic uncertainty.
- Buy now, pay later (BNPL) spending reached $18.2 billion in the U.S. holiday season, up 9.6% year over year.
- Global online holiday spending surpassed $1.2 trillion, signaling strong international demand.
- Product returns increased by 28% year over year, driven by flexible shopping behaviors.
- AI-based recommendations contributed to nearly 1 in 5 online purchases globally.
- Online shoppers increasingly compare across brands, with households engaging with multiple retailers annually.
- Checkout friction remains a barrier, with up to 60–70% of high-value shoppers abandoning purchases due to complexity.
Global Online Shopping Concerns
- Fraud and longer wait times are the top concerns, each affecting 48% of online shoppers globally, highlighting trust and delivery speed issues.
- Custom charges worry 41% of consumers, indicating concerns around unexpected costs in cross-border shopping.
- 34% of shoppers prefer buying locally, as they believe they can find everything within their own country.
- 29% of consumers prioritize supporting their local economy, reflecting growing preference for domestic purchases.
- Return-related challenges remain significant, with 27% concerned about return costs and 26% about complex return processes.
- 22% of shoppers are hesitant due to unfamiliar delivery providers, showing trust gaps in logistics partners.
- Data protection and security concerns impact 21% of users, emphasizing the importance of secure transactions.
- Another 21% are unsure about consumer protection laws, especially in international purchases.
- Limited payment options affect 17% of shoppers, creating friction at checkout.
- 17% also cite a lack of simple tracking, indicating demand for better shipment visibility.
- Language barriers impact 16% of consumers, making cross-border shopping less accessible.

Trends in U.S. Online Shopping
- Mobile commerce drove over half of U.S. online purchases, highlighting device shift trends.
- U.S. cart abandonment rates average around 79% in North America, slightly above the global average.
- Nearly 48% of U.S. shoppers abandon carts due to unexpected costs, especially shipping fees.
- Desktop cart abandonment rates remain lower at around 70–73%, compared to mobile.
- E-commerce conversion rates in the U.S. average 2.9% overall, with higher desktop performance.
- Add-to-cart rates hover around 6–7% across devices, indicating early funnel drop-offs.
- Retailers lose billions annually due to cart abandonment, with estimates exceeding $18 billion in lost revenue.

Demographic Insights of Online Shoppers
- Around 2.77 billion people worldwide shopped online in 2025, representing over one-third of the global population.
- In the U.S., over 80% of adults shop online, with penetration highest among ages 25–44.
- Millennials account for nearly 36% of total ecommerce spending, making them the largest buyer segment.
- Approximately 57% of online shoppers are female, though the gap continues to narrow.
- About 73% of consumers prefer brands that personalize shopping experiences, especially younger demographics.
- Rural ecommerce adoption grew by over 20% since 2020, driven by improved logistics and mobile access.
- High-income households spend 2.6x more online annually than low-income households in the U.S.
- Nearly 60% of global consumers shop across borders, highlighting international e-commerce demand.
Online Shopping Experience Improvement
- Free delivery is the most important improvement factor, cited by 65% of online shoppers, making it the top driver of purchase decisions.
- 43% of consumers want faster delivery, highlighting the growing demand for speed and convenience in e-commerce.
- Free returns and better products are equally valued, each preferred by 40% of shoppers, emphasizing product satisfaction and risk-free purchasing.
- Secure payment and higher quality products matter to 34% of users, showing the importance of trust and product standards.
- 30% of shoppers prioritize better customer service, indicating the need for responsive and reliable support.
- Site security is a concern for 27% of consumers, reinforcing the need for safe and protected shopping environments.
- 27% also want simple browsing options, reflecting demand for smoother and more user-friendly website experiences.

Mobile Shopping
- Mobile commerce accounts for over 60% of global ecommerce sales in 2025, continuing its upward trajectory.
- In the U.S., smartphones drove 54.5% of online sales during peak shopping periods.
- Mobile users are 2x more likely to abandon carts compared to desktop users due to friction.
- Average mobile conversion rates hover around 2.3%, lower than desktop at ~3.8%.
- Over 70% of e-commerce traffic comes from mobile devices, reflecting browsing dominance.
- Mobile wallets like Apple Pay and Google Pay are used by over 30% of U.S. shoppers, improving checkout speed.
- Push notifications drive up to 9x higher engagement rates compared to email campaigns in ecommerce apps.
- Page load delays of just 1 second can reduce mobile conversions by up to 20%, emphasizing UX optimization.
- Over 80% of shoppers use mobile devices to research products before purchasing, even if they complete on a desktop.
Social Commerce
- Global social commerce sales are projected to reach $1.2 trillion by 2025, accounting for a growing share of e-commerce.
- Nearly 49% of consumers have made a purchase via social media platforms, including Instagram and TikTok.
- Gen Z users are 2x more likely to shop directly through social apps than older generations.
- About 78% of consumers say social media impacts their buying decisions, especially for fashion and beauty.
- TikTok users spend an average of 95 minutes per day on the app, increasing exposure to shoppable content.
- Facebook remains a leading platform, with over 2 billion users engaging with marketplace features monthly.
- Livestream shopping conversion rates can reach 30%, far exceeding traditional ecommerce averages.
- Social commerce adoption in the U.S. is expected to grow by over 20% annually through 2026.
Online Shopping Cart Abandonment
- The global average cart abandonment rate remains at 69.8% in 2026, showing persistent checkout friction.
- Mobile cart abandonment rates exceed 85%, the highest across devices.
- Unexpected extra costs cause 48% of shoppers to abandon carts, making it the top reason.
- Mandatory account creation leads to 24% of abandoned checkouts, highlighting UX barriers.
- Long or complicated checkout processes drive 17% of users to leave, emphasizing simplicity.
- Slow delivery estimates contribute to 22% of cart abandonment cases, impacting logistics decisions.
- E-commerce brands lose an estimated $18 billion annually due to cart abandonment.

Payment and Checkout Statistics
- Digital wallets accounted for over 50% of global e-commerce transaction value in 2025, making them the leading payment method.
- Credit and debit cards still represent around 40% of U.S. online payments, showing continued reliance on traditional methods.
- About 17% of online shoppers abandon purchases due to a lack of preferred payment options, highlighting checkout limitations.
- One-click checkout solutions can increase conversions by up to 35%, reducing friction.
- Nearly 70% of consumers expect a seamless checkout experience across devices, emphasizing omnichannel consistency.
- Guest checkout options improve conversion rates by 20–30%, especially for first-time buyers.
- Subscription-based ecommerce payments are growing, with over 15% of online shoppers using subscription services regularly.
Order Fulfillment
- Around 48% of consumers abandon carts due to high shipping costs, directly affecting revenue.
- Meanwhile, click-and-collect (BOPIS) usage grew over 18% YoY, bridging online and offline retail experiences.
- Retailers offering flexible delivery options achieve up to 30% higher customer retention rates.
- At the same time, returns processing costs can reach 30% of total order value, particularly in apparel.
- Nearly 67% of shoppers review return policies before buying, highlighting the importance of transparency.
- Additionally, warehouse automation adoption rose over 15% globally in 2025, enhancing fulfillment efficiency.
Online Shopping Category
- Global online fashion and apparel sales will reach about $1.3 trillion in 2026, keeping apparel among the top two e-commerce categories by revenue.
- Global e-commerce electronics revenue will surpass roughly $1.1 trillion in 2026, driven by sustained demand for high-ticket devices and accessories.
- Online food and grocery (including beverages) sales will exceed around $1.2 trillion globally by 2026, making it one of the fastest-growing categories.
- Global beauty and personal care e-commerce revenue will reach approximately $180 billion to $190 billion in 2026, fueled by high repeat purchases and strong digital engagement.
- Online furniture and home goods spending will remain above about $220 billion in 2026, supported by home-improvement demand and better visualization tools.
- Digital goods and subscriptions will account for roughly 15% to 18% of global online transactions in 2026, driven by growth in streaming, software, and subscription boxes.
- The global resale and second-hand market (online and offline) will reach about $550 billion to $580 billion in 2026, with e-commerce platforms capturing a growing share.

Holiday Online Shopping Statistics
- In 2026, U.S. online holiday sales are expected to build on 2025’s $257.8 billion total, which grew 6.8% year over year.
- In 2025’s Cyber Week (indicator for 2026), U.S. consumers spent $48.5 billion online, with Cyber Monday alone generating $14.25 billion in sales.
- For the 2025 holiday season heading into 2026, smartphones accounted for 56.4% of U.S. online holiday transactions.
- In the latest season before 2026, BNPL holiday spending reached about $20 billion, up 9.8% from the prior year, with over $1 billion on Cyber Monday alone.
- Adobe and Salesforce reported that deeper holiday discounts helped drive record online sales, with many key categories seeing average markdowns in the 20%–30% range.
- On Cyber Monday 2025, global online sales hit $53 billion, with peak hours reaching about $16 million per minute in ecommerce sales.
- For Cyber Monday 2025, 79.4% of BNPL transactions occurred on mobile devices, underscoring mobile-first peak shopping behavior headed into 2026.
Frequently Asked Questions (FAQs)
E-commerce is expected to account for around 24% of total global retail sales in 2026.
More than 2.7 billion people globally shop online, representing over one-third of the population.
The U.S. ecommerce market is estimated at about $1.38 trillion in 2026.
The average cart abandonment rate remains high at around 69% to 70% globally.
Conclusion
Online shopping today reflects a market that continues to expand while becoming more complex. Mobile commerce, social platforms, and flexible payment options now shape how consumers move from discovery to purchase. At the same time, challenges like cart abandonment, fulfillment costs, and checkout friction remain critical areas for improvement.
For businesses, the takeaway is clear: success depends on optimizing the entire customer journey, from mobile browsing to final delivery. As e-commerce evolves, brands that rely on data-driven decisions and seamless experiences will capture more value in an increasingly competitive digital marketplace.