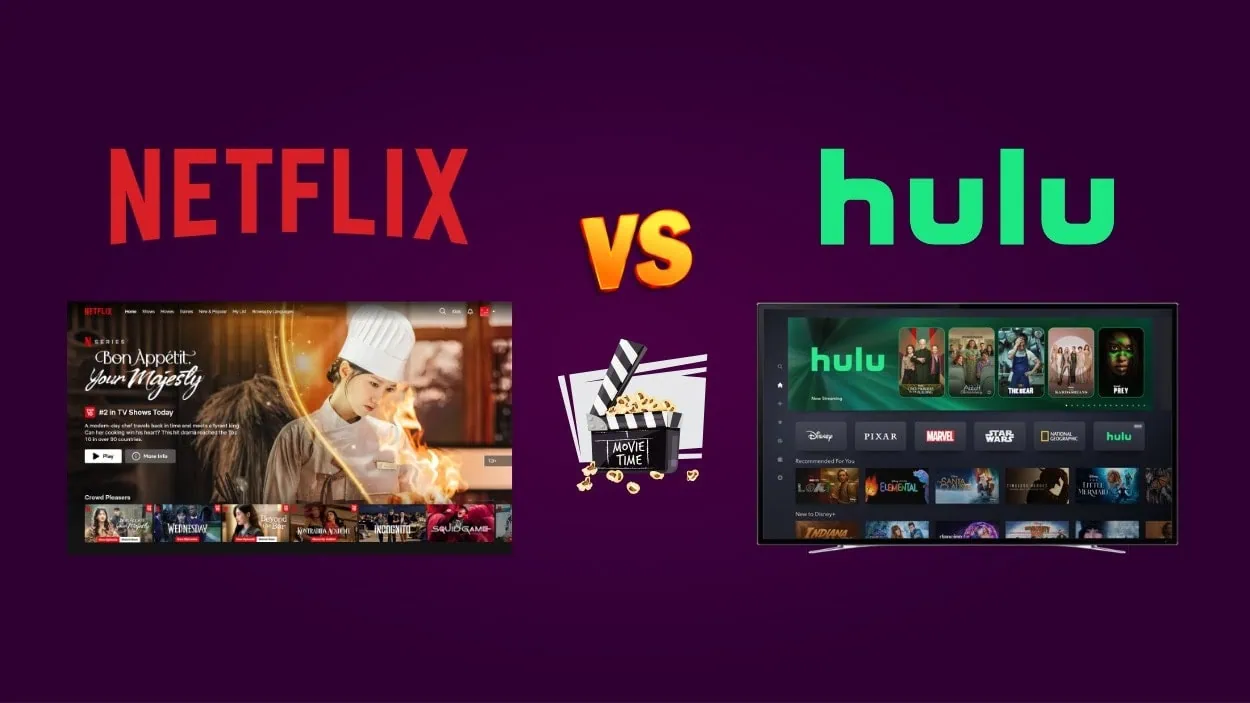
The average US household spends $69 per month on streaming video services across an average of four paid services, according to Deloitte’s 20th annual Digital Media Trends survey of 3,575 US consumers. Spending has held flat year over year while consumer tolerance has not, with more than 61% of respondents saying they would cancel their favorite service if monthly prices increased by $5. The 2026 subscription landscape is bigger, more profitable for incumbents, and more fragile at the household level than at any point in the streaming era.
The data below covers subscription economy growth, streaming subscriber counts, household spend, churn and fatigue, music, gaming, ad-supported tiers, and the app-store subscription tier that quietly dwarfs the pure-play streamers.
Key Takeaways
- Subscription Economy Index companies have grown 3.4x faster than the S&P 500 over the past 12 years, with 2023 revenue growth of 10.4% versus the S&P 500’s 6%, per Zuora’s April 2025 report.
- Apple crossed 1 billion paid subscriptions across first-party services and App Store-billed third-party apps during its fiscal Q2 2026 quarter.
- Alphabet reported 350 million Google paid subscriptions in Q1 2026, with YouTube and Google One as the primary drivers.
- Spotify reached 293 million Premium subscribers and 761 million monthly active users as of March 31, 2026.
- US streaming subscribers churn at an all-time high of 44% annually per Antenna’s Q4 2024 State of Subscriptions report, while 41% of consumers canceled at least one paid SVOD in the prior six months.
- Disney+ and Hulu generated $5.49 billion in Q2 fiscal 2026 revenue (up 13%) with operating income of $582 million (up 88%); the first quarter the segment broke the 10% operating-margin barrier.
Editor’s Choice
- Netflix audience now approaches 1 billion people globally, against an estimated 5% of global TV view share and under 45% TAM penetration of broadband households.
- Netflix Q1 2026 revenue was $12.25 billion, up 16% year over year, with operating income of $3.96 billion.
- Apple Services revenue reached an all-time high of $30.98 billion in fiscal Q2 2026, up from $26.64 billion a year earlier.
- Xbox Game Pass Ultimate was cut to $22.99 per month on April 21, 2026, reversing the October 2025 hike to $29.99 that Microsoft acknowledged cost the service “millions of subscribers.”
- YouTube Music and Premium grew non-trial subscribers by their largest quarterly increase since the June 2018 launch in Q1 2026, with prior disclosed totals of 125 million subscribers including trials.
- PlayStation Network monthly active users hit a record 132 million in December 2025.
- Sony’s Game and Network Services segment posted ¥463.3 billion in operating profit for fiscal 2025, a 12% year-over-year gain and the segment’s record.
Recent Developments
- April 21, 2026: Microsoft cut Xbox Game Pass Ultimate to $22.99 per month, reversing the October 2025 hike to $29.99 after the company acknowledged the service had lost “millions of subscribers.”
- April 24, 2026: Alphabet reported 350 million Google paid subscriptions in its Q1 2026 earnings, with YouTube ad revenue of $9.88 billion (up 11% year over year) and a record quarterly increase in YouTube Music and Premium non-trial subscribers since the platform’s June 2018 launch.
- April 28, 2026: Spotify reported revenue of €4.5 billion with a first-quarter-record gross margin of 33.0% and operating income of €715 million.
- April 30, 2026: Apple posted fiscal Q2 2026 revenue of $111.2 billion, up 17% year over year, with Services hitting an all-time-high run rate.
- May 6, 2026: Disney reported Disney+ and Hulu revenue of $5.49 billion, up 13%, and operating income of $582 million, up 88%; the first quarter the segment topped a 10% operating margin.
- March 2026: Deloitte published its 20th annual Digital Media Trends report, based on a census-representative survey of 3,575 US consumers.
Subscription Economy Market Size and Growth
The subscription economy continues to outpace the broader equity market by a wide margin. Zuora’s Subscription Economy Index, the longest-running benchmark of recurring-revenue businesses, reported in April 2025 that SEI companies had grown 3.4x faster than the S&P 500 over the prior 12 years. In 2023, SEI companies achieved an average revenue growth rate of 10.4%, compared with 6% for the S&P 500. The gap narrowed in the most recent two-year window, with SEI companies growing 11% faster than the broader economy rather than the 3.4x multi-year average.
- SEI companies have grown 3.4x faster than the S&P 500 over 12 years
- In 2023, SEI companies grew revenue at 10.4% versus 6% for the S&P 500
- Revenue per billing account improved 118% over four years; 68% of US consumers subscribed to a new service for the first time in 2024
| Metric | Subscription Economy Index | S&P 500 |
|---|---|---|
| 12-year revenue growth multiple | 3.4x | baseline |
| 2023 annual revenue growth | 10.4% | 6.0% |
| Trailing 2-year growth premium | +11% | baseline |
| 4-year revenue per billing account uplift | +118% | n/a |
Source: Zuora Subscription Economy Index 2025
Adoption keeps widening. The consumer survey of more than 3,000 U.S. adults found that 68% of consumers subscribed to a new service for the first time in 2024, and SEI companies improved revenue per billing account by 118% over the last four years as they tuned pricing tiers, bundles, and family plans to subscriber behavior.
By the numbers: Per Zuora, Subscription Economy Index companies have grown 3.4x faster than the S&P 500 over 12 years, with 68% of US consumers signing up for a new subscription service for the first time in 2024 and revenue per billing account climbing 118% over four years.

Streaming Video Subscribers by Platform
The streaming leaderboard is bifurcating between platforms that still publish subscriber counts and platforms that have stopped. Netflix still discloses paid memberships annually rather than quarterly, with Q1 2026 revenue of $12,250 million, up 16% year over year, and an audience the company now describes as approaching 1 billion people globally. Netflix penetrated less than 45% of its total addressable market of broadband households at the end of 2025, with an estimated 5% of global TV view share, a deliberate framing that keeps growth potential in front of investors.
- Netflix Q1 2026 revenue was $12,250 million, up 16% year over year, with audience approaching 1 billion people
- Spotify Premium Subscribers grew 9% year over year to 293 million as of March 31, 2026
- Disney stopped reporting Disney+ and Hulu subscriber counts in fiscal 2026, citing metrics that “have become less meaningful”
| Platform | Subscriber Count | As of | Notes |
|---|---|---|---|
| Spotify Premium | 293 million | March 31, 2026 | +9% year over year |
| YouTube Music and Premium | 125 million | March 2025 (most recent disclosed) | Including trials |
| PlayStation Plus | ~50 million | March 31, 2026 | Tiered: Essential, Extra, Premium |
| Xbox Game Pass | 35 to 37 million | Early 2026 | Microsoft stopped exact figures |
| Disney+ and Hulu | Not disclosed | Q2 fiscal 2026 onward | Revenue and margin only |
| Netflix | Not disclosed quarterly | 2025 onward | Audience “approaching 1 billion” |
Source: Netflix Q1 2026 Shareholder Letter, Spotify Q1 2026 earnings call, Disney Q2 FY2026 8-K, Microsoft FY26 Q3 commentary, Sony FY25 disclosures
Spotify is the other clear disclosure leader. Premium Subscribers grew 9% year over year to 293 million as of March 31, 2026, with 3 million net additions in Q1, while monthly active users surpassed 760 million. Disney, by contrast, has gone the other way. The Walt Disney Company stopped reporting Disney+ and Hulu subscriber numbers in fiscal 2026, saying those metrics “have become less meaningful to evaluating the performance of our businesses”. The disclosure retreat coincides with a margin breakout, covered below.
US Household Spending on Streaming
Household streaming spend has flattened, but the composition of that spend is changing fast. Deloitte’s Digital Media Trends report found that the average subscribing US household spends $69 per month on streaming video, consistent year over year, across an average of four paid streaming video services. Self-identified fans spend $71 per month on an average of four services, while non-fans spend $56 per month on three. Price elasticity is sharp at the margin: more than 61% of respondents say they would cancel their favorite service if monthly prices increased by $5.
- Average US subscribing household spends $69 per month across an average of four paid streaming video services
- Self-identified fans spend $71 per month; non-fans spend $56 per month on three services
- More than 61% of respondents say they would cancel their favorite service if prices increased by $5
Worth noting: Per Deloitte’s 2026 Digital Media Trends survey, the $69 per month household streaming bill has held flat for a year, but 61% of subscribers say a $5 price hike on their favorite service would trigger cancellation. The ceiling is real even when the line item is not yet moving.
Subscription Fatigue and Cancellation Statistics
Subscription fatigue has shifted from anecdote to measurable cohort behavior. Deloitte’s survey found that 41% of US consumers report canceling at least one paid SVOD service in the past six months, while nearly 47% felt they had too many streaming services. The fatigue concentrates by generation. Antenna’s State of Subscriptions reporting found that 87% of Gen Z streaming subscribers reported subscription fatigue, with 37% canceling at least one service since December 2025 specifically because of it.
- 41% of US consumers canceled at least one paid SVOD in the past six months per Deloitte
- Nearly 47% felt they had too many streaming services
- 87% of Gen Z streaming subscribers reported subscription fatigue; 37% canceled a service since December 2025
At the platform level, Antenna’s panel data shows video-on-demand churn reached an all-time high of 44% in Q4 2024. The headline obscures a wide tier gap. Tier-1 platforms like Netflix sit at 2-3% monthly churn, while smaller services often see double-digit monthly churn.
Music and Audio Subscription Statistics
Music streaming is the cleanest subscription category in 2026, with two clear leaders publishing regular subscriber data. Spotify’s 293 million Premium subscribers as of March 31, 2026, grew 9% year over year, and the platform paid out a record more than $11 billion to rights holders in 2025, a figure Spotify publishes in its annual Loud and Clear report. Engagement on the music side is also unusually deep: nearly 70% of Premium users work out monthly, and users have created more than 150 million workout-centered playlists, which Spotify cited when announcing a fitness hub partnership with Peloton.
- Spotify Premium subscribers grew 9% year over year to 293 million as of March 31, 2026
- Spotify paid out a record more than $11 billion to rights holders in 2025
- YouTube Music and Premium last disclosed 125 million subscribers (including trials) as of March 2025; subscription business generates approximately $20 billion per year
| Service | Subscribers | As of | Year-over-Year |
|---|---|---|---|
| Spotify Premium | 293 million | March 31, 2026 | +9% |
| YouTube Music and Premium | 125 million (with trials) | March 2025 | Most recent disclosed |
| Spotify MAU (all tiers) | Over 760 million | March 31, 2026 | +12% |
| YouTube subscription business revenue | ~$20 billion | 2025 run rate | Music a key driver |
| Spotify rights-holder payouts | $11 billion | 2025 | Record |
Source: Spotify Q1 2026 earnings call, Alphabet Q1 2026 disclosures, Music Business Worldwide reporting on Alphabet
YouTube Music and Premium is the other engine. Alphabet last disclosed 125 million YouTube Music and Premium subscribers as of March 2025, up from 100 million in February 2024, and the service posted its largest quarterly increase in non-trial subscribers since its June 2018 launch during Q1 2026. YouTube’s subscription business overall is now generating roughly $20 billion per year when YouTube Music, Premium, TV, and other add-ons are combined.
A separate breakdown of YouTube platform-wide metrics sits alongside the Premium subscriber data above.
Gaming Subscription Statistics
Gaming subscriptions delivered the year’s most visible pricing reversal. Microsoft cut Xbox Game Pass Ultimate to $22.99 per month on April 21, 2026, reversing the October 2025 hike to $29.99 that the company itself said had cost the service “millions of subscribers”.
- Xbox Game Pass Ultimate was cut to $22.99 per month on April 21, 2026, after Microsoft acknowledged losing “millions of subscribers”
- PlayStation Plus holds the gaming subscription lead at approximately 50 million subscribers; Xbox Game Pass has 35-37 million
- Sony Game and Network Services posted ¥463.3 billion in operating profit for fiscal 2025, up 12% to a segment record
| Service | Subscribers | Price (US) | Year-over-Year |
|---|---|---|---|
| PlayStation Plus (all tiers) | ~50 million | $11.99 to $17.99 per month | Stable |
| Xbox Game Pass | 35 to 37 million | $22.99 (Ultimate, post-cut) | Down “millions” |
| PlayStation Network MAU | 132 million (December 2025 peak) | Free (account) | Record |
| Sony G&NS operating profit | ¥463.3 billion | n/a | +12%, record |
| Microsoft gaming revenue | Down 7% in FY26 Q3 | n/a | Trigger for cut |
Source: Microsoft FY26 Q3 earnings, Sony FY25 supplementary materials, Xbox Wire price announcement April 21, 2026
Xbox Game Pass reached 35-37 million subscribers by early 2026, with PlayStation Plus holding the market lead at approximately 51.2 million total subscribers across its Essential, Extra, and Premium tiers.
The financial backdrop matters. Microsoft‘s FY26 Q3 (quarter ended March 31, 2026) showed Xbox content and services revenue down 5% and gaming overall down 7%, part of what triggered the price walk-back. Sony’s Game and Network Services segment generated ¥4.69 trillion in revenue and ¥463.3 billion in operating profit during fiscal year 2025, with operating profit climbing 12% to a segment record. PlayStation Network monthly active users hit a record 132 million in December 2025, slipping to 125 million by March 2026 as holiday engagement normalized.
The takeaway: Microsoft’s April 21, 2026 reversal of the Game Pass Ultimate price to $22.99 is the first time a major US digital subscription platform has publicly walked back a headline price hike after admitting it cost the service subscribers. The 2022 to 2025 across-the-board price-increase era has hit a measurable ceiling.
Ad-Supported Tier Adoption Statistics
Ad-supported tiers were a backup plan for most streamers two years ago. They are now the default growth engine. Deloitte’s Digital Media Trends survey found that around 68% of streaming subscribers now pay for ad-supported tiers, an increase of over 20 percentage points from 2024, the steepest two-year shift since SVOD launched. The economic logic is direct: Netflix’s advertising revenue is on track to reach $3 billion in 2026, up 2x year over year, with Netflix itself naming ad revenue as the third leg of growth alongside membership and pricing.
- Around 68% of streaming subscribers now pay for ad-supported tiers, up over 20 percentage points from 2024
- Netflix advertising revenue is on track to reach $3 billion in 2026, up 2x year over year
- Biddable ad inventory represents more than a third of Spotify ad revenue and is growing quickly
| Ad-Tier Signal | Share or Run Rate | Source |
|---|---|---|
| Streaming subscribers on ad-supported tiers | 68% | Deloitte 2026 DMT |
| Two-year jump in ad-tier adoption | +20 percentage points | Deloitte 2026 DMT |
| Netflix 2026 ad revenue target | $3 billion (2x YoY) | Netflix Q1 2026 letter |
| Spotify biddable ad revenue share | More than one third | Spotify Q1 2026 call |
Source: Deloitte 2026 Digital Media Trends, Netflix Q1 2026 Shareholder Letter, Spotify Q1 2026 earnings call
Spotify is rebuilding its ad stack toward the same goal. Biddable ad inventory now represents more than a third of Spotify ad revenue and is growing quickly, according to Co-CEO Alex Norström on the Q1 2026 call. The cross-platform pattern is uniform: where price elasticity caps subscription revenue at the top of the funnel, ad-tier monetization fills the gap with lower-friction inventory the audience has signaled they will tolerate.
App Store Subscription Statistics
The category that quietly outweighs every pure-play streamer is the app-store subscription stack.
- Apple has crossed 1 billion paid subscriptions across first-party services and third-party app subscriptions billed through the App Store.
- Services reached $30.98 billion from $26.64 billion in the prior-year period.
- Google reported 350 million paid subscriptions in Q1 2026, driven primarily by YouTube and Google One.
- The two app-store gatekeepers represent roughly 1.35 billion paid subscription relationships combined, a count exceeding the global Premium bases of Netflix, Spotify, Disney+, Hulu, PlayStation Plus, and Xbox Game Pass combined.
Key finding: Apple disclosed 1 billion paid subscriptions on its fiscal Q2 2026 earnings call and Alphabet reported 350 million Google paid subscriptions in Q1 2026. Together they represent roughly 1.35 billion paid subscription relationships, dwarfing the sum of pure-play media services. For broader category context see the media and services overview.
Disney+ Hulu and Bundled Streaming Statistics
Disney’s Q2 fiscal 2026 results captured the trade-off every legacy streamer is now making: drop subscriber disclosures, push ARPU and margin. Disney+ and Hulu generated $5.49 billion in Q2 fiscal 2026 revenue, up 13%, with operating income jumping 88% to $582 million.
- Disney+ and Hulu generated $5.49 billion in Q2 fiscal 2026 revenue, up 13% year over year
- Operating income jumped 88% to $582 million, breaking a 10% operating margin for the first time
- Disney stopped disclosing subscriber counts in fiscal 2026, focusing instead on revenue and margin
| Metric | Q2 FY2026 | Year-over-Year |
|---|---|---|
| Disney+ and Hulu revenue | $5.49 billion | +13% |
| Disney+ and Hulu operating income | $582 million | +88% |
| Segment operating margin | 10.6% | First time over 10% |
| Total Disney revenue | $25.17 billion | +7% |
| Adjusted EPS | $1.57 | Up from $1.45 |
| Disney+ and Hulu subscriber count | Not disclosed | Disclosure dropped Q1 FY2026 |
Source: Disney Q2 FY2026 8-K filing dated May 6, 2026
The segment broke a 10% operating margin for the first time, hitting 10.6%, and Disney said it remains on track to achieve at least 10% for full fiscal year 2026. Total quarterly revenue was $25.17 billion, up 7%, for the three months ended March 28, with Adjusted EPS rising in line with the headline revenue gain.
Subscription Churn Rate by Service Tier
Churn now varies more by tier than by category. Antenna’s industry data shows monthly churn ranging from 5-30% across OTT services, with tier-1 platforms like Netflix at 2-3% monthly and smaller services often in double digits. The annualized peak hit a 44% churn rate in Q4 2024, an all-time high in Antenna’s panel.
- Annualized SVOD churn reached an all-time high of 44% in Q4 2024 per Antenna panel data
- Tier-1 platforms such as Netflix hold monthly churn at 2-3%; smaller services often see double-digit monthly churn
| Service Tier | Typical Monthly Churn | Annualized Range |
|---|---|---|
| Tier 1 (Netflix, leaders) | 2% to 3% | 22% to 32% |
| Tier 2 (mid-tier streamers) | 5% to 10% | 46% to 71% |
| Tier 3 (niche, smaller) | 10% to 30% | 72% to 98% |
| All-platform Q4 2024 peak | n/a | 44% churn rate |
Source: Antenna State of Subscriptions reporting, 2024-2026
How Many Streaming Services Does the Average US Household Subscribe To?
The average US subscribing household pays for four streaming video services, the same as in each of the prior three years according to Deloitte’s Digital Media Trends survey of 3,575 US consumers. Self-identified fans average four services at $71 per month, while non-fans average three services at $56 per month. The stable count masks heavy in-and-out behavior, with 41% of consumers reporting canceling at least one paid SVOD service in the past six months.
Is Subscription Fatigue Real?
Subscription fatigue is measurable in 2026. Antenna’s State of Subscriptions reporting shows 87% of Gen Z streaming subscribers reported having experienced subscription fatigue, and 37% canceled at least one service since December 2025 specifically because of it. At the all-population level, nearly 47% of consumers feel they had too many streaming services per Deloitte, and video-on-demand churn reached a 44% rate in Q4 2024, an all-time high in Antenna’s panel data.
What Is the Largest Subscription Platform by Paid Subscribers?
Apple disclosed 1 billion paid subscriptions during its fiscal Q2 2026 earnings call across first-party services and third-party app subscriptions billed through the App Store. Alphabet reported 350 million Google paid subscriptions in Q1 2026. Spotify’s Premium Subscribers grew 9% year over year to 293 million as of March 31, 2026, and PlayStation Plus leads the gaming subscription market with 51.2 million subscribers across its tiers.
Conclusion
Digital platform subscriptions are bigger this year than at any previous point on record. The average US household pays $69 per month across four services: Apple at 1 billion paid subscriptions, Alphabet at 350 million, and Premium Subscribers growing 9% year-over-year to 293 million as of March 31, 2026. The category is more fragile than at any point in the streaming era, and next year’s data will turn on whether ad-supported tiers and app-store-intermediated billing produce durable margin.