
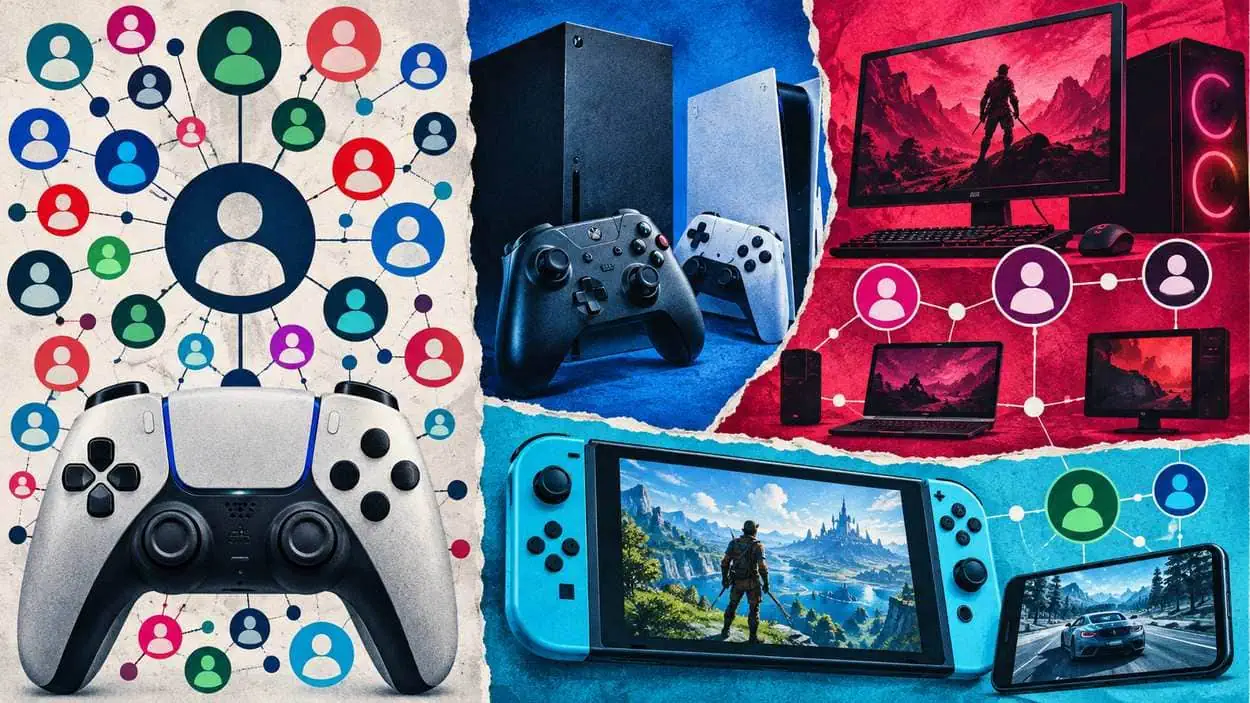






Epic Games counted 972 million cross-platform accounts at the end of 2025, up 8% year over year, against 317 million total PC players. The distance between those two numbers is the most useful single measure of how cross-platform gaming works: far more platform identities exist than there are people on any one device.
On the console side, Sony reported that total PlayStation monthly active users reached 125 million accounts in June, up 2% year on year and a record high for the month of June. Developers have already adjusted to that reality, with 72% of studios saying they prioritise cross-play. The cross-platform gaming statistics below draw on platform filings, investor presentations and two industry surveys published between January and September 2026.
Key Takeaways
- Cross-platform accounts grew 8% to 972 million, while total PC players stood at 317 million.
- Playing on a mobile device is the most popular across all age groups at 80%, while PC and console gameplay is more common with Gen Alpha, Gen Z, and Millennials.
- In Unity’s developer survey, 72% of studios prioritise cross-play, while 38% name a consistent user experience across devices as their primary obstacle.
- PlayStation monthly active users rose 2% to 125 million accounts even as total play time in the quarter fell 4%.
- Per the Entertainment Software Association, US consumer spending reached $60.7 billion in 2025, of which $52.3 billion went to content.
- More than half of players, 58%, downloaded a game for free in the past 12 months, against 43% who purchased a game.
- Microsoft reported that Xbox content and services revenue decreased 10% in the same window that Roblox revenue grew 36%.
Editor’s Choice
- 972 million cross-platform accounts, up 8% on the prior year.
- 212.3 million Americans play video games every week, up 3% compared with 2025.
- 125 million PlayStation monthly active accounts in June.
- 156.59 million Nintendo Switch hardware units sold worldwide, per Nintendo’s investor relations data.
- $60.7 billion in total US consumer spending on video games in 2025.
- 6.65 billion total store gameplay hours on the Epic Games Store in 2025.
- 93.95% of surveyed Steam clients run Windows, in Valve’s hardware survey.
Who Plays, and How Often
- Weekly US play reached 212.3 million Americans, up 3%, an increase of 7.2 million people compared with 2025.
- 67% of Americans aged 5 to 90 now play video games one or more hours per week, which makes the weekly habit a majority behaviour rather than a niche one.
- The average player age has risen to 37, so the audience spans work-issued laptops, living-room consoles and commuter handsets.
- Participation splits 53% of men and 46% of women actively playing.
- Among the youngest cohorts, more than 80% of Gen Alpha, aged 5 to 13, and Gen Z, aged 14 to 29, play video games.
- Older women outplay older men in one generation: 52% of Boomer women play games compared with 47% of men.
| Measure | Value |
|---|---|
| Americans playing weekly | 212.3 million |
| Year-on-year change | +3% (+7.2 million) |
| Share of Americans aged 5 to 90 playing weekly | 67% |
| Average player age | 37 |
| Share of men actively playing | 53% |
| Share of women actively playing | 46% |
Source: ESA 2026 Essential Facts About the U.S. Video Game Industry
About This Data
Figures here are compiled from ten source captures across nine primary sources: nine Tier 1 (industry association, company investor relations and official platform dashboards) and one Tier 2 (a developer survey). The compilation window runs from 2026-01 to 2026-09. Only first-party platform disclosure, industry association data, and surveys with published methodology qualified. Figures are reviewed on a rolling basis and updated when the underlying sources publish new editions.

Is 52% of gamers female?
No. ESA puts participation at 53% male and 46% female among all players. The 52% figure matches a narrower cut of the same research: 52% of Boomer women play games compared with 47% of men. That is a generational reversal, not an overall majority.
Cross-Platform Gaming Statistics: Accounts vs PC Players
- Account holders outnumber device users heavily, with 972 million cross-platform accounts against 317 million total PC players.
- Storefront reach peaked at 78 million monthly active users in December 2025, an all-time record, up 6%.
- The steady-state figure sits lower, at 67 million average monthly active users, down 1%.
- Daily engagement landed at 31 million average daily active users, down 2%.
- Players logged 6.65 billion total store gameplay hours in 2025, down 14%, while hours in third-party titles rose 4% to 2.78 billion.
- Spending held up against the hours decline: PC players spent $1.16 billion on the Epic Games Store, up 6% year over year.
Recent Developments
- September 2026: Valve’s rolling hardware survey put Windows at 93.95% of surveyed Steam clients, up 0.28% on the prior month.
- August 2026: Nintendo’s investor relations sales data, current as of June 30, 2026, recorded 23.68 million Nintendo Switch 2 hardware units and 58.17 million software units.
- July 2026: Sony’s Q1 FY2026 presentation reported total play time down 4% year on year during the quarter alongside the June monthly-active record.
- July 2026: Microsoft’s fiscal Q4 results showed Xbox content and services revenue decreased 10%.
- July 2026: Roblox told shareholders that revenue grew 36% year over year to $1.5 billion in the June quarter.
- June 2026: The ESA published its 2026 Essential Facts report, recording 212.3 million weekly American players.
Which Devices Players Actually Use
- Handsets lead everywhere: playing on a mobile device is the most popular across all age groups at 80%.
- Desktop and console play skews younger, since PC and console gameplay is more common with Gen Alpha, Gen Z, and Millennials.
- Genre preference tracks the device rather than the player. Puzzle is the top genre on mobile at 66% and on PC at 60%.
- Console play inverts that order, where action reaches 66%, shooter 60%, and arcade 60%.
- Spending on extras concentrates in younger cohorts: 69% of Gen Alpha, 78% of Gen Z, and 67% of Millennial players have purchased in-game content, typically spending $20 per month at the median.
| Platform | Top genre | Share of players citing that genre |
|---|---|---|
| Mobile | Puzzle | 66% |
| PC | Puzzle | 60% |
| Console | Action | 66% |
| Console | Shooter | 60% |
| Console | Arcade | 60% |
Source: ESA 2026 Essential Facts About the U.S. Video Game Industry
What platform do most gamers use?
Mobile, by participation. ESA data shows mobile play as the most popular across all age groups at 80%, ahead of PC and console. That ranking counts people who play on a device at all, not hours spent, and the same person still appears in PC and console counts.
Cross-Play Adoption Among Game Studios
- Online multiplayer is near-universal on the supply side, with 83% of polled studios saying they support online multiplayer features.
- Session design has shrunk, as 55% focus on smaller sessions for groups of 2 to 9 players.
- Cross-play now reads as a default rather than a premium feature, with 72% of studios prioritising it.
- The hard part has moved downstream: 38% of surveyed respondents said that ensuring a consistent user experience across devices and environments is their primary obstacle.
- Smaller teams push hardest on reach, where 74% say they are targeting new platforms and 42% are exploring multiple genres.
- Platform expansion is part of a wider revenue hedge, with nearly a quarter, 24%, moving beyond core sales into partnerships, in-game monetisation and platform expansion.
Worth noting: Unity’s 38% consistency obstacle matters more than the 72% adoption headline. Cross-play that ships with mismatched frame rates, input latency or content parity between a handset and a console splits the community it was built to merge, which is why the remaining engineering cost sits in experience parity rather than in netcode.
Are most games cross-platform now?
Most studios plan for it. Unity found 72% of studios prioritise cross-play and 83% support online multiplayer features, from a 2025 Cint survey of 300 game developers. Prioritising cross-play is a roadmap signal rather than a shipped-feature count, so studio intent runs ahead of the installed catalogue.
PC Player Counts vs Console Player Counts
- The three biggest public numbers measure three different things, so a direct ranking is not available from first-party disclosure.
- Sony reports monthly actives: 125 million PlayStation monthly active users in June, up 2% year on year, defined by the company as an estimated total number of unique accounts that played games or used services online on PlayStation during the last month of the quarter.
- Epic reports a storefront population: 317 million total PC players and 78 million peak monthly active users.
- Nintendo reports lifetime hardware, not active users, at 156.59 million Nintendo Switch units and 23.68 million Nintendo Switch 2 units sold worldwide as of June 30, 2026.
- Valve reports an opt-in client survey rather than a player count, covering Windows at 93.95% and Linux at 3.90% of surveyed clients.
| Platform | Reported metric | Latest value | As of |
|---|---|---|---|
| PlayStation | Monthly active accounts | 125 million | June 2026 |
| Epic Games Store | Total PC players | 317 million | December 2025 |
| Epic Games Store | Peak monthly active users | 78 million | December 2025 |
| Nintendo Switch | Lifetime hardware units | 156.59 million | June 30, 2026 |
| Nintendo Switch 2 | Lifetime hardware units | 23.68 million | June 30, 2026 |
Source: Sony Q1 FY2026 investor presentation, Epic Games Store 2025 Year in Review, Nintendo IR sales data 2026
Anyone comparing these four numbers is comparing an account census, a storefront population, and two hardware ledgers. Our PC gaming market share and usage data track the desktop side on its own terms, which is the only honest way to read either total.
Nintendo’s Install Base Across Eight Hardware Platforms
- Nintendo’s current generation is still early: Nintendo Switch 2 stands at 23.68 million hardware units and 58.17 million software units.
- Its predecessor remains the company’s best-selling platform ever, at 156.59 million hardware units and 1,561.95 million software units.
- The handheld line dominates the back catalogue, with Nintendo DS at 154.02 million units and Game Boy at 118.69 million units.
- Home consoles trail the handhelds, with Wii reaching 101.63 million units and Wii U 13.56 million units.
- Mid-tier platforms fill the gap, with Game Boy Advance at 81.51 million units and Nintendo 3DS at 75.94 million units.
The PC Side Is Not One Platform Either
- Windows holds the surveyed PC base almost entirely, at 93.95% of Steam clients, up 0.28% month-on-month.
- Within Windows, the generational shift has completed: Windows 11 64-bit reaches 70.97%, up 0.71%, while Windows 10 64-bit has fallen to 22.90%, down 0.40%.
- Linux remains a rounding error in aggregate at 3.90%, down 0.11%, though it is the base that handheld PC hardware runs on.
- SteamOS specifically accounts for 0.82% of surveyed clients, down 0.07%.
- Community distributions follow closely behind, with CachyOS at 0.60% and Arch Linux at 0.34%.
The survey is opt-in and covers only users who accept it, so treat it as a directional read on client mix rather than a census. Longer-run movements in that mix sit in our Steam platform statistics.
Where Cross-Platform Spending Lands
- US consumer spending on video games totalled $60.7 billion in 2025.
- Content took the overwhelming majority at $52.3 billion, which is the portion that travels with a player across devices rather than sitting in one box.
- Hardware accounted for $5.4 billion and accessories for $2.95 billion.
- The wider footprint is larger still: the US video game industry supports more than 250,000 jobs and generates $95.8 billion in total economic impact.
- Age-rating volume gives a sense of catalogue scale, with 90% of the 6,761 ESRB ratings assigned in 2025 falling into E, E10+, or T.
By the numbers: Content absorbed $52.3 billion of the $60.7 billion Americans spent on video games in 2025, against $5.4 billion on hardware, per ESA’s 2026 Essential Facts. A spending mix that lopsided is what makes cross-platform entitlement commercially rational: the money follows the library, and the library is portable.
How Players Acquire Games
- Free acquisition is the most common route, with more than half of players, 58%, downloading a game for free in the past 12 months.
- Outright purchase follows at 43%.
- Subscriptions reached 35%, the mechanism that most often carries entitlements between a console and a PC.
- Borrowing persists at 19%.
- Free distribution does real volume on storefronts too: Epic offered 100 free games in 2025, and players claimed 662 million titles through the programme.
- Value framing follows the same pattern, since 82% of players say there is a video game for everyone.
Platform Revenue Momentum Diverges
- Sony’s Game and Network Services segment recorded essentially flat sales, with operating income up 37% year on year, on the yen figures shown below.
- Microsoft’s console-adjacent line moved the other way, with Xbox content and services revenue down 10% and More Personal Computing revenue at $12.9 billion, down 4%.
- Roblox pulled sharply ahead on the top line at 36% revenue growth to $1.5 billion, with bookings growth of 8% landing at the low end of its guidance range.
- Epic’s PC storefront grew modestly, at $1.16 billion in PC player spending, up 6%, and $400 million on third-party PC games, up 57%.
| Platform | Metric | Latest period | Change |
|---|---|---|---|
| Sony Game and Network Services | Segment sales | Q1 FY2026 | ¥936.5 billion to ¥937.1 billion |
| Sony Game and Network Services | Operating income | Q1 FY2026 | +37% to ¥202.0 billion |
| Microsoft Xbox | Content and services revenue | FY2026 Q4 | -10% |
| Roblox | Revenue | Q2 2026 | +36% to $1.5 billion |
| Epic Games Store | PC player spending | Full-year 2025 | +6% to $1.16 billion |
Source: Sony Q1 FY2026 investor presentation, Microsoft FY2026 Q4 earnings release, Roblox Q2 2026 shareholder letter, Epic Games Store 2025 Year in Review
Read those four lines against their own period labels rather than as one window: three of them sit in the April-to-June 2026 quarter, while the Epic figure is a full-year 2025 total. Console-attached content revenue fell at Microsoft while account-based engagement platforms grew, a split visible in our separate Xbox platform figures.
Family and Social Play Cross Devices Too
- Household participation is high: 75% of parents play video games.
- Among those who do, 81% have played video games with their children and 52% play with their children weekly.
- Social outcomes rank alongside entertainment ones, with 55% saying games helped them make lasting memories and 49% saying games help them stay connected to friends and family.
- Relationship formation shows up directly: 47% have met people through video games they otherwise would not have met, and 37% have met a good friend, spouse, or significant other through video games.
Roblox as a Cross-Platform Bellwether
- Roblox posted revenue growth of 36% year over year to $1.5 billion in the June 2026 quarter.
- Cash generation outpaced revenue, at $318 million in operating cash flow, up 60% year-over-year, and $294 million in free cash flow, up 66% year-over-year.
- Bookings lagged the top line, with year-over-year bookings growth of 8% landing at the low end of the guidance range.
- The company attributes the gap to monetisation rather than reach, citing a decline in per-hour monetisation, most notably with younger cohorts in the U.S. and Canada.
- Its stated ambition frames the platform strategy: capturing 10% of the global gaming market and an even greater share of the U.S. market.
| Metric | Q2 2026 value | Year-on-year change |
|---|---|---|
| Revenue | $1.5 billion | +36% |
| Operating cash flow | $318 million | +60% |
| Free cash flow | $294 million | +66% |
| Bookings growth | Low end of guidance | +8% |
Source: Roblox Q2 2026 Shareholder Letter
The takeaway: Roblox grew revenue 36% while bookings rose only 8%, and the company attributes the gap to falling per-hour monetisation among younger North American players. Reach and revenue per hour are now separate problems on account-based platforms, and the second one is harder to fix with a platform launch. Our Roblox player and revenue figures track that divergence quarter by quarter.
Are there more PC gamers or console gamers?
Neither side publishes a number that settles it. Epic counted 317 million total PC players on its own storefront, Valve’s survey covers only opt-in Steam clients, and Sony counted 125 million PlayStation monthly active accounts, while Nintendo publishes lifetime hardware units rather than active users. Those are four different populations measured four different ways, and none of them is a global PC or console census.
What the data does support is overlap. Epic reported 972 million cross-platform accounts against 317 million total PC players. A gap that wide means many players hold identities on more than one device, so adding a PC total to a console total double-counts real people. ESA found that playing on a mobile device is the most popular across all age groups at 80%, while PC and console gameplay is more common with Gen Alpha, Gen Z, and Millennials, which points the same way.
What is the #1 gaming platform in the world?
By participation rate, mobile. ESA’s 2026 survey found that playing on a mobile device is the most popular across all age groups at 80%, ahead of PC and console on the same measure. Among the platforms that disclose active accounts, Sony reported 125 million PlayStation monthly active users in June, a record high for the month of June.
Those answers do not conflict, because they measure different things. Participation rate counts anyone who plays on a device, while monthly actives count unique accounts on one network. Nintendo’s figure is a third measure again, at 156.59 million Nintendo Switch hardware units, counting hardware sold rather than people playing.
Is gaming growing or dying?
Growing in reach, mixed in revenue. 212.3 million Americans play video games every week, up 3% compared with 2025; cross-platform accounts grew 8% to 972 million, and PlayStation monthly active users rose 2% to 125 million accounts.
Revenue and engagement tell a less uniform story, and the periods differ: the Epic figures below are full-year 2025 rather than the April-to-June 2026 quarter. Sony’s total play time decreased 4% year on year, Epic’s total store gameplay hours fell 14% to 6.65 billion, and Xbox content and services revenue decreased 10% while Roblox revenue grew 36%. Across our platform statistics coverage, the pattern of slowing growth against deepening engagement is familiar, though gaming in 2026 shows the reverse in places: more accounts, fewer hours per account.
Conclusion
972 million cross-platform accounts against 317 million total PC players remains the figure that reframes everything else here. Player totals per device no longer add up to an audience, because the same person now carries a console account, a PC storefront login and a handset. Sony counted 125 million PlayStation monthly active users, 72% of studios prioritise cross-play, and US demand holds at 212.3 million weekly players against $60.7 billion in 2025 consumer spending, of which $52.3 billion went to content.
The unresolved problem is parity rather than plumbing, since 38% of surveyed respondents said that ensuring a consistent user experience across devices and environments is their primary obstacle. For players, cross-play availability is close to settled, and the quality of that experience is what still merits checking before committing to a platform. For publishers, the divergence between Roblox revenue growth and falling Xbox content revenue suggests the account-based model is where the next few years of platform competition will be decided.







