Back in 2018, a teenager in Ohio posted a short dance clip on TikTok. Within hours, her video was stitched, duetted, and remixed by thousands worldwide. A year later, a fashion influencer in LA racked up millions of views from a single Instagram Reel on sustainable style tips. What began as casual content quickly turned into a global phenomenon.
Fast forward to 2025, the line between entertainment, influence, and income has never been blurrier, or more powerful. As TikTok and Instagram continue to shape how people connect, create, and consume, the data tells a story of evolving dominance, fierce competition, and shifting user behavior.
Editor’s Choice
- TikTok reached 1.88 billion monthly active users globally by Q2 2025, surpassing Instagram’s 1.63 billion.
- Instagram Reels now account for 41% of all time spent on the app.
- The average TikTok user spends 61 minutes per day on the platform, 12 minutes more than the average Instagram user.
- Instagram Stories engagement dropped by 9.5% year-over-year, while TikTok’s video comment activity rose by 17%.
- 43% of Gen Z in the US identify TikTok as their primary search tool, overtaking Google and Instagram.
- Brands report a 32% higher ROI from influencer campaigns on TikTok compared to Instagram in 2025.
- TikTok creator payouts under the Creativity Program Pro increased to over $2 billion annually.
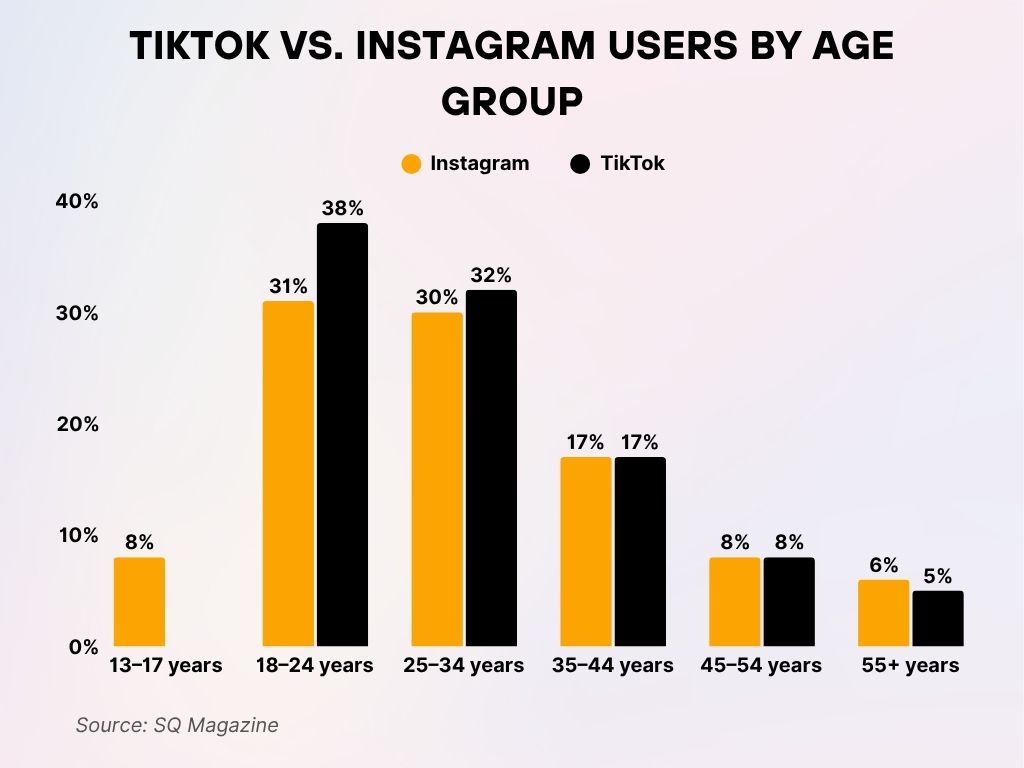
TikTok vs. Instagram Users by Age Group
- Ages 13–17: Instagram holds a small lead with 8% of users, while TikTok has virtually no users in this group.
- Ages 18–24: TikTok dominates this segment with 38% of users, surpassing Instagram’s 31%. This age group is TikTok’s largest user base.
- Ages 25–34: Both platforms are close, but TikTok leads slightly with 32% compared to Instagram’s 30%.
- Ages 35–44: Usage is even, with both TikTok and Instagram capturing 17% of their respective audiences.
- Ages 45–54: Engagement drops for both apps, each attracting just 8% of users in this demographic.
- Ages 55 and older: Instagram still leads slightly with 6%, while TikTok accounts for 5% of its users from this age group.
Global User Base Comparison
- TikTok surpassed Instagram in active global user count in early 2025, reaching 1.88 billion, compared to Instagram’s 1.63 billion.
- Instagram remains ahead in Western markets, with 79% of US social media users active on Instagram vs. 66% on TikTok.
- TikTok dominates in Asia, especially in Southeast Asia, where it holds 74% market penetration in countries like Indonesia and Vietnam.
- In India (where TikTok remains banned), Instagram has seen year-over-year growth of 14%, driven largely by Reels.
- TikTok gained over 100 million new users from Africa and Latin America combined since early 2024.
- Instagram’s user growth in Europe plateaued at +1.2%, while TikTok’s growth was a healthier +3.9% in the same region.
- TikTok is now available in 160+ countries, compared to Instagram’s 170+.
Engagement Rates and Time Spent
- The average time spent per user per day is 61 minutes on TikTok and 49 minutes on Instagram.
- TikTok leads in engagement with an average 7.4% video engagement rate, compared to Instagram Reels’ 4.3%.
- Instagram’s photo engagement rate continues to decline and currently stands at 0.9%.
- TikTok’s For You feed personalization drives an 18% higher retention rate over the first 7 days compared to Instagram Explore.
- Instagram saw a 16% drop in carousel post engagement as users shifted toward Reels.
- TikTok Live has grown rapidly, with daily watch time for Live streams up 34% year-over-year.
- TikTok videos under 30 seconds get more than twice the completion rate of Reels of the same length.
- TikTok’s average comment-per-post ratio is 1.8x higher than Instagram’s in user-generated content.
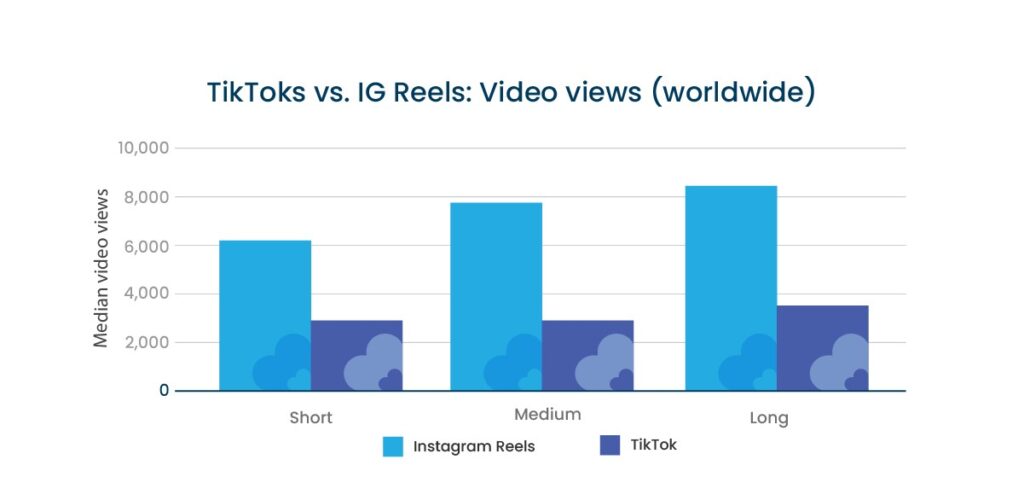
TikTok vs. Instagram Reels: Median Video Views
- Short videos: Instagram Reels outperformed TikTok with about 6,200 median views, while TikTok only reached around 2,800 views.
- Medium videos: Instagram maintained the lead with roughly 7,900 views, more than double TikTok’s 2,900 views.
- Long videos: Instagram Reels saw the highest engagement with around 8,600 median views, compared to TikTok’s 3,500 views.
Content Formats and Popularity Metrics
- Short-form video remains the most consumed format on both platforms, but TikTok leads with 81% of users engaging daily with videos under 60 seconds.
- Reels account for 41% of Instagram’s total content views.
- TikTok videos with trending audio see 52% higher completion rates than those without.
- Instagram still has a strong base for carousel posts, but engagement dropped by 16% YoY in favor of video.
- TikTok’s “Series” format (long-form paid content) gained traction in 2025, with creator earnings up 24% in Q1 alone.
- Augmented reality (AR) filters on TikTok are now used in 1 out of every 3 videos globally.
- Instagram’s Stories are viewed by 57% of daily active users, though interaction rates fell by 11% this year.
- TikTok’s Duet and Stitch features are used in 19% of videos, promoting collaborative trends more than Instagram Collabs.
- The average TikTok user watches 265 videos per day, compared to 177 on Instagram.
- Music-backed content continues to dominate TikTok, with 62% of viral videos featuring trending audio tracks.
Advertising Revenue and Market Share
- Instagram’s advertising revenue in 2025 is projected at $54.7 billion, while TikTok is forecasted to hit $28.3 billion globally.
- TikTok’s ad business grew by 32% year-over-year, outpacing Instagram’s 12% growth.
- The average cost-per-click (CPC) on Instagram is $1.29, compared to TikTok’s $0.89, making TikTok more attractive for mid-sized brands.
- TikTok’s Spark Ads see 2.1x higher engagement rates than traditional in-feed Instagram ads.
- Instagram retains a stronger ad market share in the US, with 68% of social ad spend routed through Meta platforms.
- TikTok saw a 41% growth in small business ad adoption in 2025.
- Click-through rates (CTR) for TikTok ads average 1.6%, while Instagram averages 1.1%.
- Instagram’s AI-driven ad placements for Reels improved conversion by 18% versus early 2024.
- TikTok introduced programmatic ad support in 2025, increasing campaign reach by 25% on average.
- Instagram still leads in brand-safe perception, preferred by 64% of Fortune 500 advertisers.
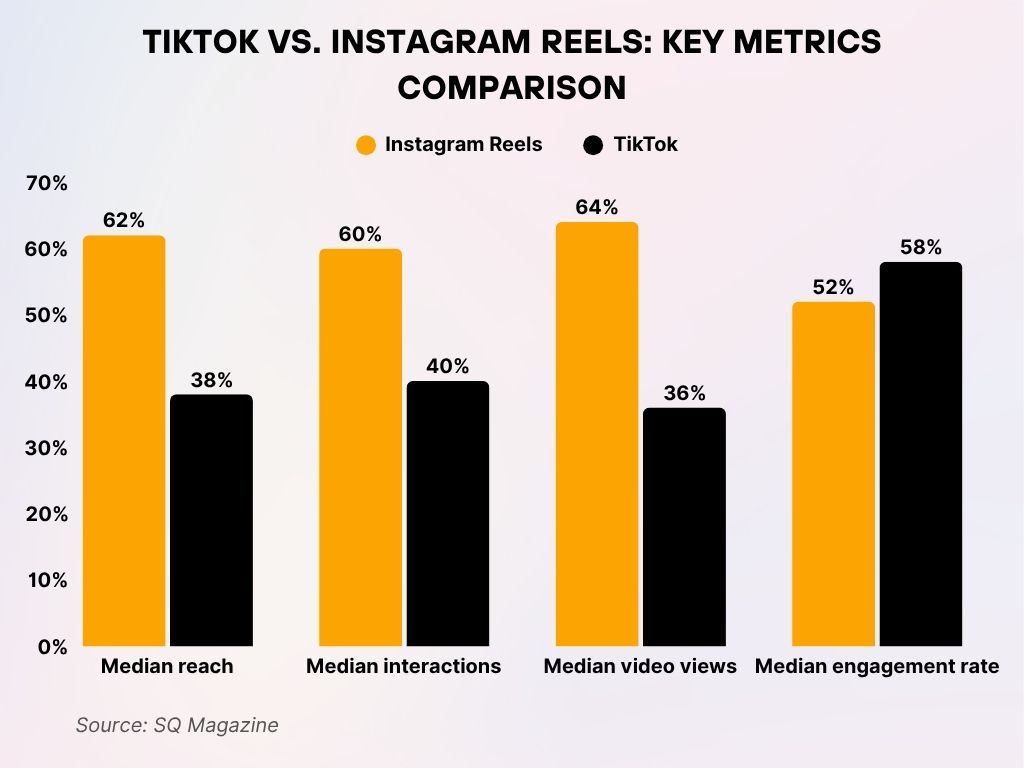
TikTok vs. Instagram Reels: Key Metrics Comparison
- Median Reach: Instagram Reels leads significantly with 62%, while TikTok trails behind at 38%. This highlights Instagram’s broader visibility across sister pages.
- Median Interactions: Instagram also dominates here with 60%, compared to TikTok’s 40%, indicating higher user engagement on Reels.
- Median Video Views: Instagram Reels pulls ahead again, garnering 64% of video views versus TikTok’s 36%.
- Median Engagement Rate: TikTok takes the lead in this one metric, achieving a higher 58% engagement rate, slightly surpassing Instagram’s 52%.
Influencer Earnings and Sponsorship Trends
- Top TikTok creators earned an average of $54,000/month through platform monetization and brand deals in 2025.
- Instagram creators with over 1 million followers reported an average of $45,000/month, primarily from brand sponsorships.
- TikTok’s Creator Marketplace usage grew by 47%, while Instagram’s Brand Collabs Manager plateaued.
- Nano-influencers (1K–10K followers) on TikTok are seeing 28% higher engagement than those on Instagram.
- Sponsored Reels cost an average of $1,200 per post, compared to $1,800 for TikTok branded content with similar reach.
- Brands reported a 34% increase in TikTok ROAS (Return on Ad Spend) compared to Instagram over Q1 2025.
- TikTok LIVE gifting features contributed over $780 million in creator earnings globally so far this year.
- Instagram remains dominant for fashion and lifestyle sponsorships, while TikTok leads in tech and gaming verticals.
- 61% of Gen Z users say they trust product reviews more on TikTok than on Instagram.
- TikTok’s revenue-sharing model under its Creativity Program Pro is now available in 30+ countries, boosting mid-tier influencer earnings by 39%.
User Growth Trends Over the Years
- TikTok’s global user base grew by 18.4% from 2024 to 2025, while Instagram saw 7.2% growth.
- Between 2020 and 2025, TikTok’s monthly users increased by over 1.3 billion, a 216% growth rate.
- Instagram added 110 million new users in 2025, slower than its 2023 peak of 130 million.
- TikTok had faster penetration in emerging markets like Nigeria, Brazil, and the Philippines in 2025.
- Instagram’s growth in mature markets is slowing, with negative user growth in Germany and Japan.
- TikTok Lite (data-saving version) accounts for 12% of new installs globally in low-bandwidth regions.
- Instagram remains more stable in user retention, especially among users over 40.
- In the US, TikTok added 9.6 million users in 2025, while Instagram added just under 6.4 million.
- The average TikTok user has used the app for 2.6 years, while Instagram’s average user tenure is 4.9 years.
- TikTok is projected to surpass Facebook’s user base in Southeast Asia by late 2025.
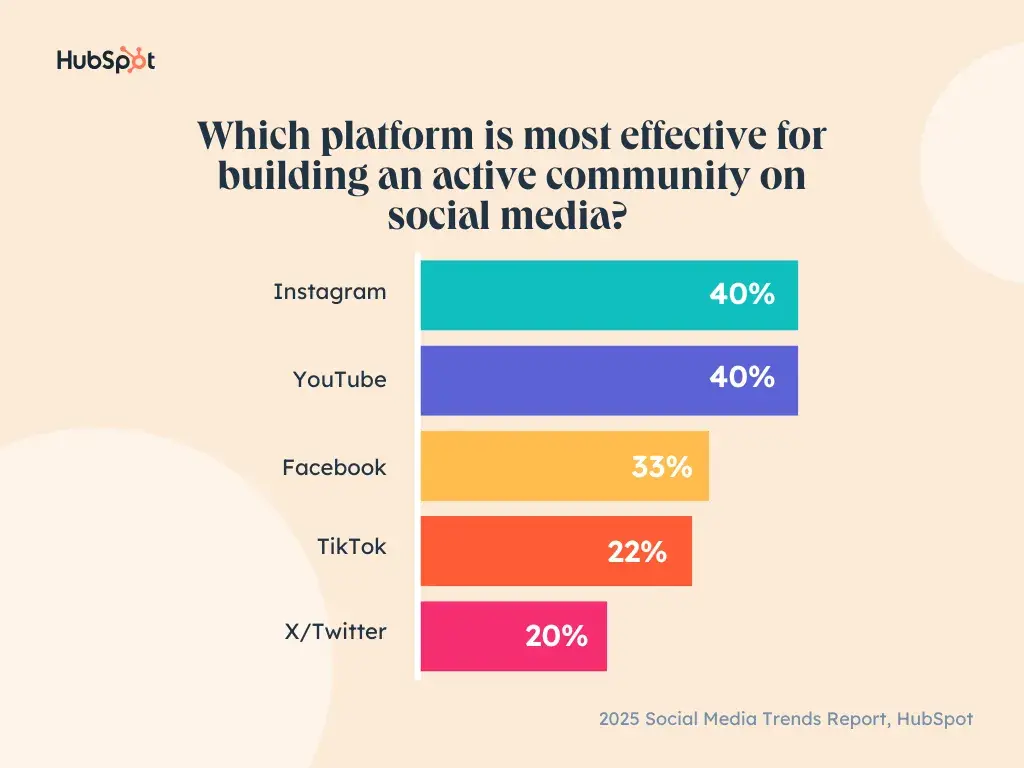
Best Platforms for Building an Active Community on Social Media
- Instagram and YouTube are tied as the top platforms, with each considered most effective by 40% of respondents.
Facebook follows with 33%, remaining a strong player in fostering active communities. - TikTok ranks lower at 22%, despite its popularity among younger audiences.
- X/Twitter comes in last with just 20%, signaling weaker perceived community-building potential.
Platform Algorithm Impact on Reach
- TikTok’s recommendation engine contributes to 85% of video views, whereas Instagram’s Explore/Reels algorithm accounts for 57%.
- Instagram has reduced organic reach for photo posts by 22% over the past year to prioritize Reels.
- TikTok creators report 50% higher reach when posting at peak algorithm-trigger windows (based on user behavior and engagement signals).
- Instagram’s feed now integrates more AI recommendations, leading to 13% longer session durations.
- TikTok videos with higher save-to-view ratios are boosted more aggressively than Instagram’s like/comment metrics.
- TikTok’s algorithm now includes “watch-depth” tracking, favoring content watched to near-completion.
- Instagram has introduced predictive video curation in Reels, increasing engagement in testing by 19%.
- Cross-platform TikTok content performs 32% worse on Instagram, indicating platform-native optimization is critical.
- TikTok’s new contextual hashtags recommendation feature improves discovery by up to 44%.
- Creators on TikTok using AI-generated content saw a 33% spike in reach in Q2 2025, aided by its new Creator AI Toolkit.
App Downloads and Regional Popularity
- TikTok was the most downloaded app globally in Q1 and Q2 of 2025, with over 310 million installs, surpassing Instagram’s 265 million.
- In the United States, TikTok saw 28 million new downloads from January to May 2025, compared to 19 million for Instagram.
- Instagram holds dominance in India, with over 95 million active users in 2025, while TikTok remains banned.
- TikTok’s fastest-growing regions in 2025 include Brazil, Pakistan, and Egypt, each showing 30%+ download growth year-over-year.
- Instagram still sees strong uptake in Western Europe, especially among Millennial and Gen X users.
- TikTok Lite has fueled its growth in Africa and Southeast Asia, now accounting for 1 in 5 downloads in emerging markets.
- In Japan and South Korea, Instagram remains preferred for its integration with shopping and creator commerce.
- TikTok became the #1 app on Google Play and Apple App Store in 92 countries as of mid-2025.
- Instagram added a dedicated Reels app in some Latin American countries, contributing to 8 million installs in Q2.
- The US, Indonesia, Brazil, and Mexico represent over 50% of TikTok’s new downloads in 2025.
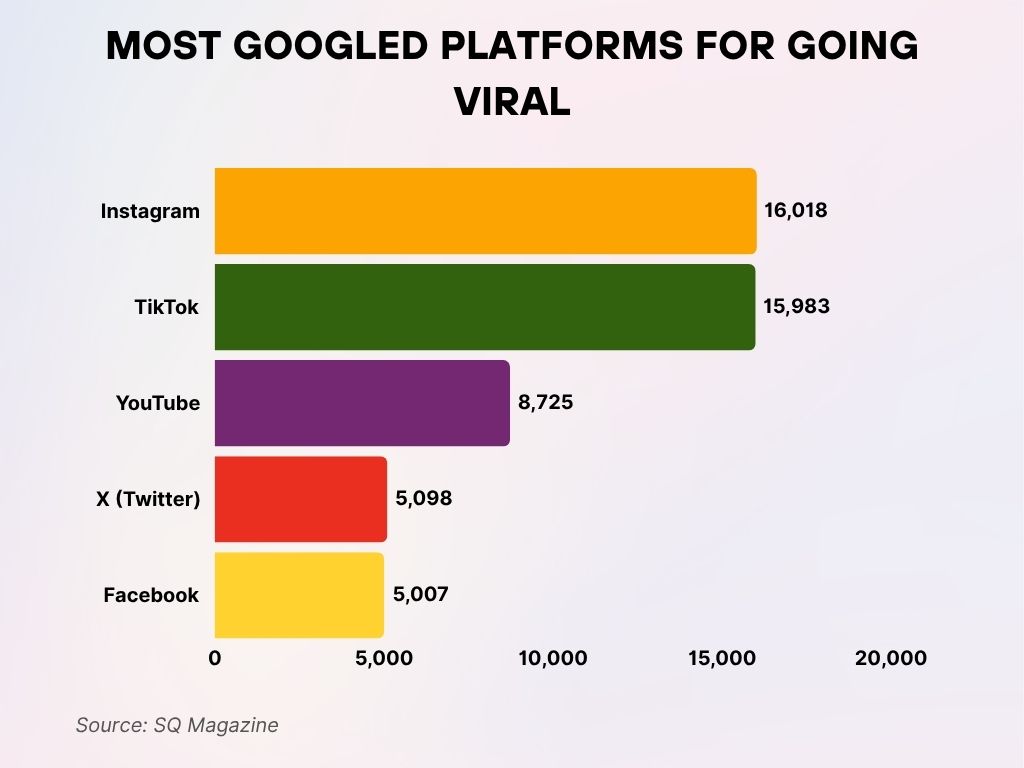
Most Googled Platforms for Going Viral
- Instagram topped the list with 16,018 monthly Google searches related to growing followers or going viral.
- TikTok followed closely with 15,983 searches, showing nearly equal interest in viral growth strategies.
- YouTube garnered a moderate 8,725 searches, signaling consistent curiosity but less than half of Instagram’s volume.
- X (Twitter) saw 5,098 searches, indicating limited interest in growth strategies on the platform.
- Facebook had the lowest at 5,007 searches, suggesting declining user curiosity about going viral on the platform.
Brand Engagement and Marketing ROI
- TikTok delivers a 6.1% average engagement rate for branded content, significantly higher than Instagram’s 3.4%.
- For every $1 spent on TikTok ads, brands are seeing an average return of $4.13, compared to $3.21 on Instagram.
- Instagram still leads in direct shopping conversion, with 18% of users making in-app purchases monthly.
- TikTok’s integration with Shopify and WooCommerce led to a 45% spike in social commerce campaigns in early 2025.
- Branded hashtag challenges on TikTok receive an average of 8.4 billion views, outperforming most Instagram campaigns.
- TikTok users are 21% more likely to engage with UGC-based ads than traditional branded content.
- Instagram remains strong for luxury and premium brands, with 43% of high-end campaigns still preferring the platform.
- TikTok’s product tagging feature, introduced in 2024, helped increase click-through rates by 29% year-over-year.
- Brands running dual-platform campaigns saw a 13% lift in recall when TikTok was the primary medium.
- 65% of DTC brands in the US now include TikTok in their top three marketing channels.
Privacy Concerns and Data Usage
- 74% of US adults express moderate to high concern over TikTok’s data practices in 2025.
- Instagram, while not free of scrutiny, has a trust score 18% higher than TikTok among US respondents.
- TikTok’s parent company ByteDance remains under investigation in the EU for cross-border data transfers.
- Instagram was flagged for data over-collection tied to its facial recognition feature, sparking a class-action suit early this year.
- TikTok introduced region-specific data centers for the US and Europe to appease regulatory pressure.
- In April 2025, Instagram faced backlash over ad targeting linked to private messages, which Meta later denied.
- 58% of Gen Z users said they are aware but unconcerned about data usage on TikTok if it improves personalization.
- TikTok announced a new “Privacy Dashboard,” allowing users to limit tracking by activity type, boosting transparency.
- Instagram now requires biometric consent for in-app payment features, aligning with newer US digital policy standards.
- Despite concerns, neither platform saw significant churn directly tied to privacy issues, and user retention remained stable.
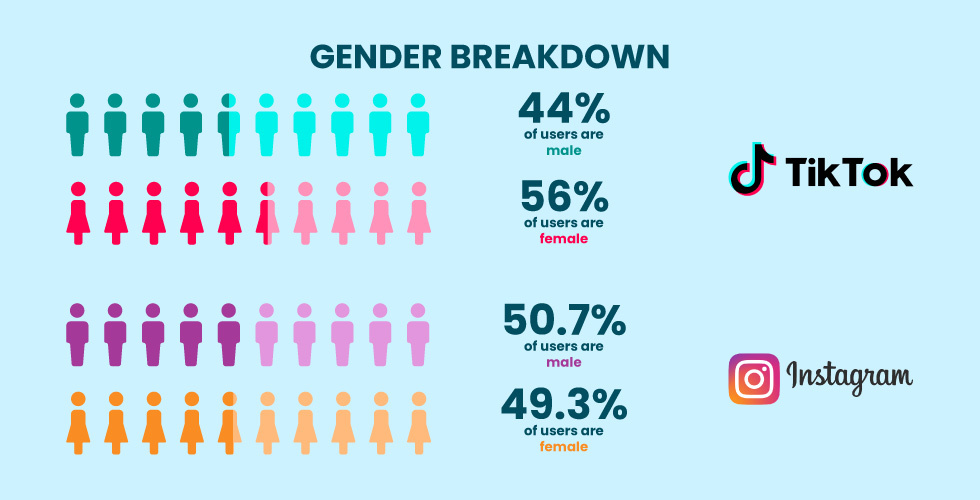
TikTok vs. Instagram: Gender Breakdown of Users
- TikTok has a predominantly female user base, with 56% identifying as female and 44% as male.
- Instagram shows a near-even split, with 50.7% of users identifying as male and 49.3% as female.
User Retention and Churn Rates
- TikTok maintains a retention rate of 42% after 30 days, slightly ahead of Instagram’s 38%.
- The average weekly active user rate for TikTok is 72%, compared to Instagram’s 68%.
- TikTok’s user churn in the US dropped to 9.1%, reflecting improved stickiness.
- Instagram’s churn increased slightly in Q1 2025, especially among users aged 18–24, with a 13% drop in activity.
- TikTok users open the app 9 times per day on average, while Instagram users average 6.7 opens.
- Retention spikes on TikTok are often triggered by viral trends, accounting for 26% of returning user sessions.
- Instagram improved its onboarding sequence, boosting 7-day retention by 7.5% in new installs.
- TikTok’s rewards-based engagement tools, such as badges and shoutouts, drove higher reactivation rates for dormant users.
- Among creators, TikTok maintains a creator retention rate of 61%, compared to 49% on Instagram.
- Users spending over 2 hours per day on TikTok are 42% more likely to stay active after 90 days.
Recent Developments in TikTok and Instagram
- TikTok launched its Creator AI Toolkit in 2025, enabling automatic video scripting, voiceover, and editing tools for creators.
- Instagram introduced AI-generated highlight stories that summarize user activity and visual memories monthly.
- TikTok added a Shop Tab in the main navigation, boosting social commerce interaction by 38% in Q1.
- Instagram Reels received a redesign in April 2025, focusing on swipe navigation and smart previews.
- TikTok LIVE Shopping gained traction in the US, with over 12 million monthly shoppers using the feature.
- Instagram started testing NFT-based creator rewards, although adoption remains limited to selected beta testers.
- TikTok partnered with Adobe for in-app design tools, enabling creators to generate templates within the app.
- Instagram has begun integrating voice-controlled navigation for visually impaired users across Reels and Stories.
- TikTok’s “Topic Channels” now allow users to explore niche content feeds, seeing 27% more engagement than standard feeds.
- Both platforms have integrated Gen AI moderation tools to detect and filter out misleading or harmful content.
Conclusion
TikTok and Instagram have evolved beyond mere social platforms; they’re now entertainment giants, ad engines, search portals, and digital storefronts rolled into one. The story of 2025 is clear: TikTok is leading in growth, engagement, and innovation, while Instagram retains strength in brand safety, social commerce, and mature audience segments.
As brands and creators adapt to this ever-shifting digital terrain, understanding the nuanced strengths of each platform will be key to maximizing influence and return. The numbers don’t just reflect a rivalry; they reveal two divergent ecosystems shaping how the world creates and connects.

