As retail investing continues to reshape global markets, understanding who participates, how they invest, and what influences their decisions has never been more crucial. Stock ownership in the U.S. is reaching levels not seen since before the 2008 crisis, with younger generations, mobile platforms, and new asset classes like ETFs driving this shift.
In India and Southeast Asia, mobile-first trading is closing gaps between urban and rural populations. Meanwhile, institutional players still hold the reins over liquidity and strategy. This article unpacks the numbers behind this evolution. From generational patterns to barriers and sector preferences, explore the full scope of today’s retail and institutional investment landscape.
Editor’s Choice
- The percentage of U.S. adults owning stock in 2025 is 62%, returning to pre-Great Recession levels.
- Retail investors now account for approximately 20.5% of daily trading volume in U.S. equity markets.
- 84% of U.S. adults with a college degree own stock, compared to 42% with only a high school education.
- In 2025, two-thirds of new brokerage accounts are being opened by investors under 45.
- The top traded stocks in 2025 by volume are dominated by Tesla, NVIDIA, and other large-cap tech firms.
- Mobile apps now account for 75% of all retail stock trades globally.
- Lack of financial literacy is the most cited reason for non-participation, especially among lower-income groups.
Recent Developments
- U.S. stock ownership rose to 62% in 2025, the highest since 2008.
- Retail trading now constitutes ~20.5% of total U.S. equity market volume.
- Commission-free trading, fractional shares, and ETF growth have democratized access.
- Robo-advisor adoption reached 36% among investors under 40 in 2025.
- Mobile trading app installs rose 28% YoY as of Q2 2025.
- U.S. investors put over $105 billion into equities via ETFs in H1 2025 alone.
- Gen Z and Millennials combined account for over 60% of retail trading activity.
- ESG investing among retail participants grew by 18% in 2025 YoY.
- Women investors are joining at a faster rate, with a 45% increase in new female-led accounts.
- Rural investing saw a 19% YoY growth, narrowing the urban-rural gap.
Racial and Ethnic Participation in Stock Markets
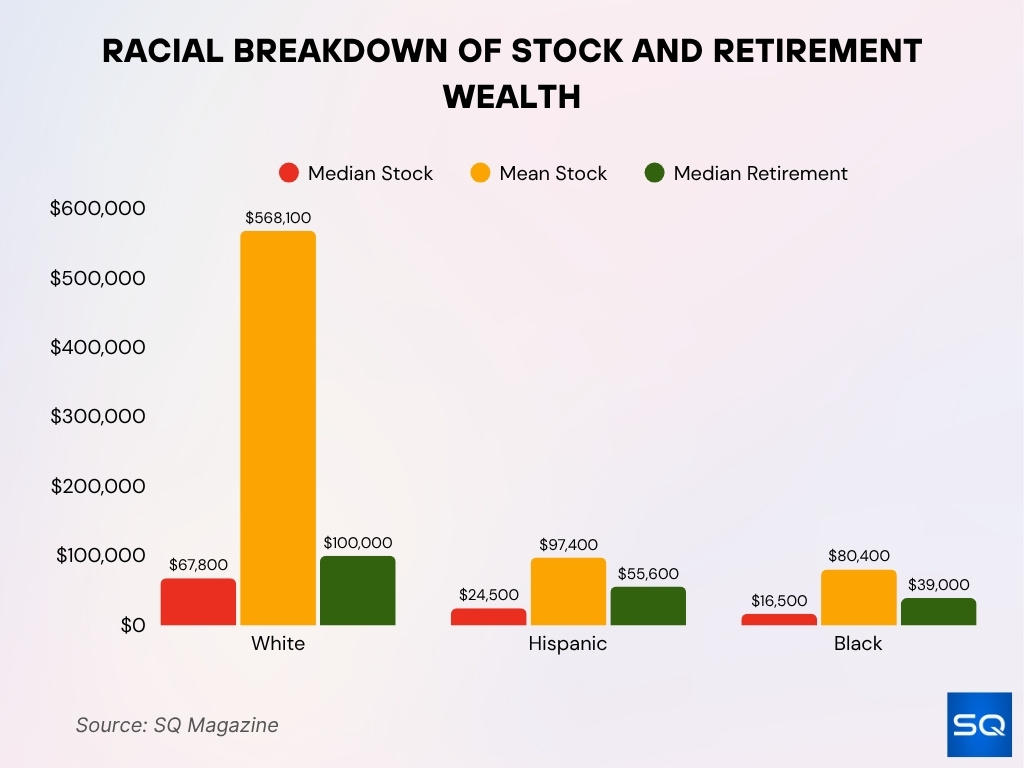
- Median stock holdings were $67,800 (White), $24,500 (Hispanic), and $16,500 (Black) in 2025.
- Mean stock holdings widened the gap at $568,100 (White), $97,400 (Hispanic), and $80,400 (Black).
- Retirement account medians reached $100,000 (White), $55,600 (Hispanic), and $39,000 (Black).
- Racial ownership gaps persist, with African American and Hispanic stock ownership still around 6–7% historically.
- Persistent structural disparities highlight the need for targeted financial literacy and inclusion programs.

Stock Market Participation by Country
- U.S.: 62% of adults own stocks in 2025, compared to 61% in 2023.
- India: Stock market participation stands at 7.4%, up from 5.2% in 2020.
- China: Around 13% of adults hold equity investments, largely via state-sanctioned platforms.
- Germany: Approximately 15% of citizens own stocks, ETFs, or mutual funds.
- UK: Retail investor participation is 34%, up from 27% in 2020.
- Canada: Roughly 40% of households hold equities directly or via funds.
- Australia: Over 50% of adults own stocks, largely through retirement superannuation accounts.
- South Korea: Retail investors make up 70% of daily trades, particularly active in tech stocks.
- Japan: Participation remains below 20%, despite efforts to expand through NISA reforms.
- Brazil: Retail ownership increased from 3% to 5.8% between 2020 and 2025.
Demographic Breakdown of Participants
- 62% of U.S. adults own stocks in 2025, up from 58% in 2022.
- Adults aged 30–49 have the highest participation rate at 67%.
- Black American stock ownership rose to 38%, narrowing the racial wealth gap.
- Hispanic participation increased from 28% in 2020 to 34% in 2025.
- White households remain the most likely to own stocks, at 66%.
- Married individuals are 25% more likely to own stocks than singles.
- Households with children show higher rates of participation, at 70%, due to education planning.
- Asian American ownership surpassed 50%, driven by tech-savvy adoption and high income.
- LGBTQ+ investors report a 20% increase in brokerage signups between 2023 and 2025.
- Veterans and military families are investing more, with 37% now owning stock, aided by targeted financial programs.
EPS Growth Forecast by Sector
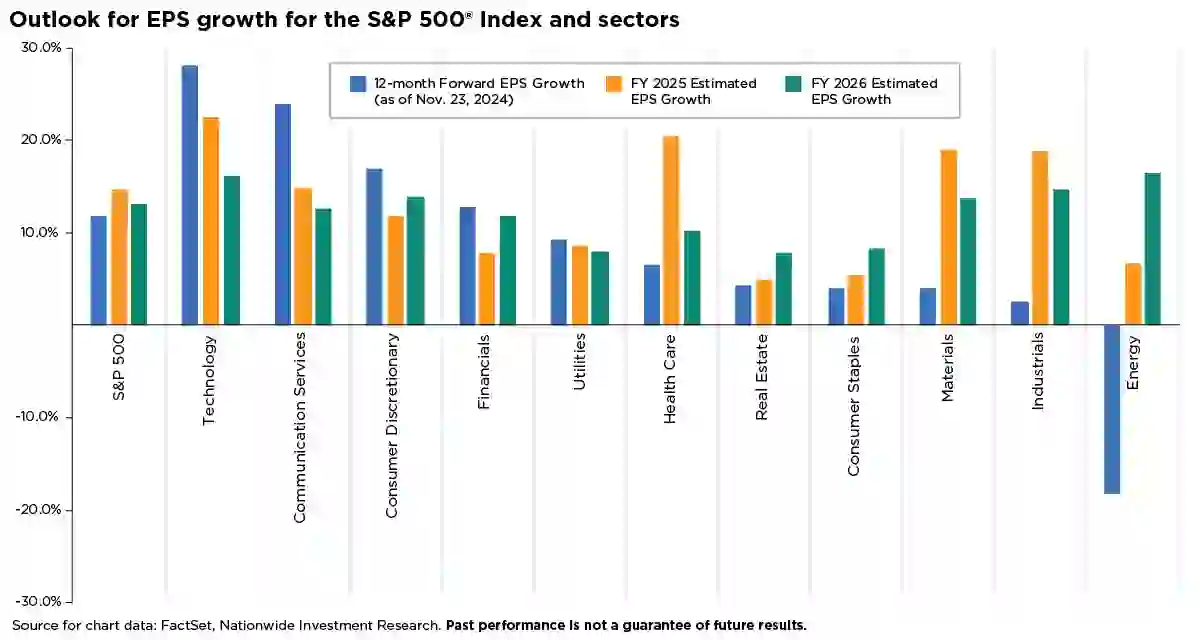
- S&P 500 earnings are projected to grow 12.5% in the next year, rising to 14.5% in 2025 and 14.0% in 2026.
- The technology sector leads with 28.0% EPS growth short term, followed by 22.5% (2025) and 17.0% (2026).
- Communication Services expects 25.0% EPS growth next year, then 15.0% in 2025 and 13.5% in 2026.
- Consumer Discretionary projects 18.0% EPS growth, with 13.5% (2025) and 14.5% (2026).
- Financials forecast 14.0% EPS growth, tapering to 10.0% in 2025, then rebounding to 13.0% in 2026.
- Utilities show stable EPS growth at 10.0% (2024), 9.0% (2025), and 9.0% (2026).
- Health Care begins with 8.0% EPS growth, surges to 22.0% in 2025, then moderates at 12.5% in 2026.
- Real Estate posts modest gains with 5.5% EPS growth, followed by 6.5% (2025) and 8.0% (2026).
- Consumer Staples mirror that with 5.5% (2024), 7.0% (2025), and 9.5% (2026) EPS growth.
- Materials EPS jumps from 5.0% now to 21.0% in 2025, then 16.5% in 2026.
- Industrials start low at 4.0% EPS growth, rebound sharply to 20.5% (2025) and 16.0% (2026).
- Energy sector faces -22.0% EPS decline short term, but rebounds to 9.0% in 2025 and 17.5% in 2026.

Gender Distribution of Stock Market Participants
- Men still lead in direct stock ownership: 68% vs. 58% for women.
- However, women-led investment accounts grew by 45% between 2022 and 2025.
- In millennial demographics, the gender gap is closing: 63% of women vs. 66% of men own stock.
- Women are more likely to invest in funds and ETFs, men in individual stocks.
- Female investors tend to have lower portfolio turnover and less speculative behavior.
- Social platforms like Ellevest and Public have driven female participation growth.
- 42% of new Robinhood users in 2025 identify as female.
- Financial education content geared toward women increased engagement by 2.5x.
- Black and Latina women showed the fastest growth in stock participation in the past 2 years.
- Women show higher ESG alignment, with 28% prioritizing impact investing, compared to 17% of men.
Participation by Income Level
- Households earning $100,000+ have a participation rate of 88%.
- Households under $40,000 see stock ownership below 28%.
- Middle-income households ($50K–$99K) own stock at a rate of 60%.
- Participation jumps dramatically when income crosses $75,000.
- Use of fractional shares is 30% higher among those earning under $50K.
- Tax-advantaged accounts like Roth IRAs increase participation among middle-income earners.
- Government incentives in Canada and Australia show higher low-income engagement.
- Emergency savings correlate directly with stock ownership across all income groups.
- Wealthier households tend to diversify more, with ownership across stocks, bonds, and alternatives.
- In India, the top 10% income group makes up over 80% of retail stock transactions.
Global Equity Market Performance
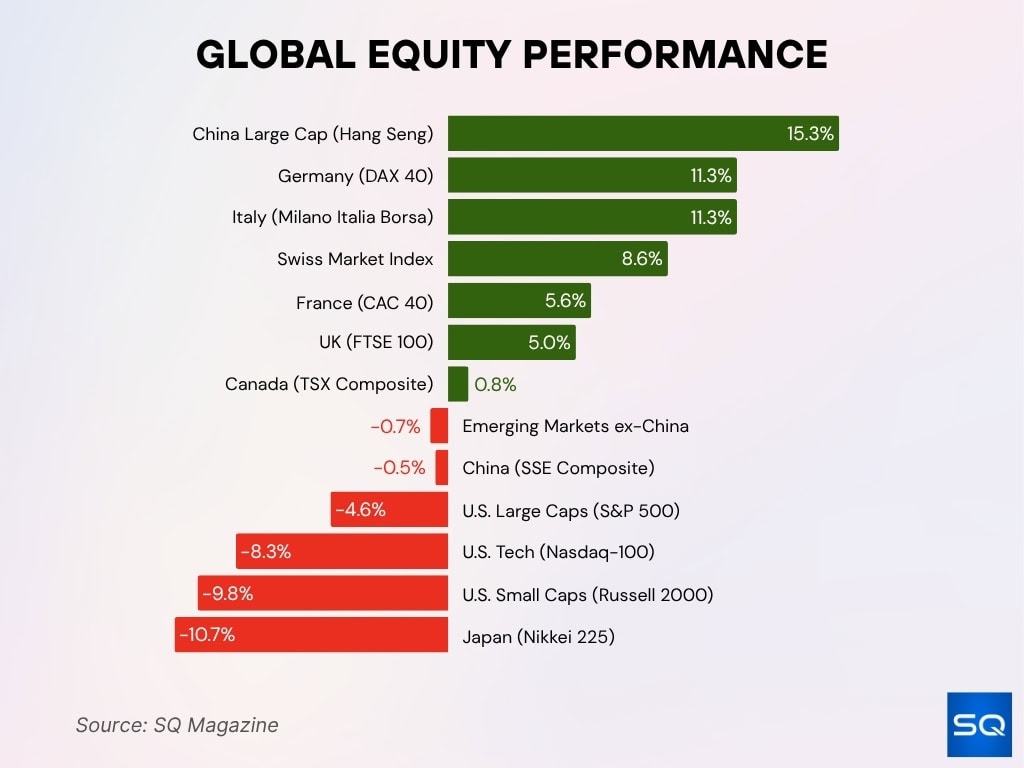
- China Large Cap (Hang Seng) led with a +15.3% return, boosted by tech and consumer rebounds.
- Germany (DAX 40) and Italy (Milano Italia Borsa) gained +11.3%, driven by strong industry and resilient data.
- Switzerland (SMI) delivered a +8.6% return, supported by healthcare and financials.
- France (CAC 40) and the UK (FTSE 100) rose +5.6% and +5.0%, showing steady developed‑market strength.
- Canada (TSX Composite) inched up +0.8%, supported by commodities and financials.
- Emerging Markets ex‑China slipped –0.7% amid outflows and currency weakness.
- China (SSE Composite) edged down –0.5% despite large‑cap gains.
- U.S. Large Caps (S&P 500) fell –4.6%, pressured by earnings revisions and rate uncertainty.
- U.S. Tech (Nasdaq‑100) dropped –8.3%, marking a correction in mega‑cap growth stocks.
- U.S. Small Caps (Russell 2000) declined –9.8% as investors exited risk assets.
- Japan (Nikkei 225) was weakest at –10.7%, hit by a stronger yen and soft global demand.

Participation by Education Level
- Among U.S. adults with a college degree or higher, 84% report owning stock, versus 42% for those with a high school diploma or less.
- Adults without college: only ~28% of those in households earning under $50,000 report stock ownership.
- In surveys of global retail investors, 50% of investors hold at least a bachelor’s degree.
- In Japan, China, and India, participation rates among even college-educated groups remain under 15% in many regions.
- Research shows that each additional year of formal education increases the probability of stock participation by about 1.3 percentage points on average.
- Non-owners with lower educational attainment are 40% more likely to cite lack of knowledge as a barrier than those with a college education.
- In digital platform markets, users with higher education are more likely to adopt robo-advisor tools and algorithmic investing.
- Even with digital access, lower-education households still lag. In China, investor nudges via educational content lifted participation materially only after onboarding.
Stock Market Participation by Generation (Gen Z, Millennials, Gen X, Boomers)
- 30% of Gen Z report starting investing during university or early adulthood, only 6% of Boomers did so.
- Among combined Gen Z and Millennials, 41% say they would allow an AI assistant to manage their investments, while only 14% of Boomers would.
- In 2025, trading activity, nearly half of Gen Z trade weekly, with 25% trading daily.
- 45% of Gen Z and Millennials began investing in early adulthood compared to 15% of Gen X and Boomers.
- Among new brokerage accounts in 2025, two-thirds were opened by investors under age 45.
- Millennials now lead ETF adoption in the U.S., 58% of millennials use ETFs vs. 47% of Gen X and 37% of Boomers.
- Younger cohorts are far more comfortable with app-based trading and thematic strategies.
- Boomers and Gen X remain more likely to use human advisors, younger groups shift to hybrid or purely digital advice.
Top Global ETF Performance Rankings
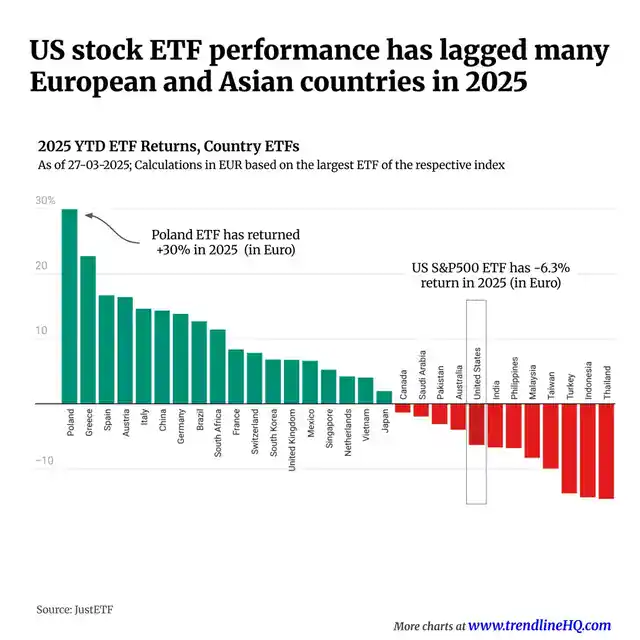
- Poland leads globally with a +30.0% return, making it the top-performing country ETF in 2025 so far.
- Greece (+22.0%) and Spain (+18.0%) followed with strong gains backed by European momentum.
- Italy (+17.0%), Germany (+15.0%), and France (+11.0%) outpaced most global ETF peers.
- Brazil (+13.0%), South Africa (+12.0%), and Mexico (+8.0%) led among emerging market ETFs.
- South Korea (+9.0%), Singapore (+6.0%), and Vietnam (+4.0%) posted moderate ETF returns.
- US S&P 500 ETF fell –6.3%, marking one of the weakest performances among developed markets.
- India (–7.0%), the Philippines (–8.0%), Malaysia (–9.0%), and Thailand (–12.0%) underperformed in Asia.
- Canada (–1.0%), Saudi Arabia (–2.0%), and Sweden (–3.0%) dipped but outperformed US losses.

Digital vs. Traditional Participation (Mobile, App, Online Platforms)
- In mid-2025, retail investors account for ~20.5% of daily U.S. equity trading volume.
- Retail accounts for 20–35% of daily volume in major markets (U.S., U.K., South Korea), in India and China, retail share climbs to 40–80%.
- As many as 75% of retail trades globally are now executed via smartphone apps.
- In Germany, switching from desktop to mobile increased the odds of risky-asset purchases by 67%, and return-chasing by 71%.
- After the introduction of mobile apps in a Chinese advisory firm, trading volume rose 80% and investor attention jumped 143%.
- Mobile proficiency correlates positively with willingness to invest; more skilled smartphone users invest more.
- Digital investors are more reactive to news and short-term momentum, amplifying market volatility.
- Despite mobile access, underlying knowledge gaps still limit deeper engagement among less sophisticated users.
Geographic Distribution (Urban vs. Rural Participation)
- New account data indicate that two-thirds of new retail investors in 2025 originate from urban areas.
- Rural regions, however, recorded ~19% growth in new account openings year over year, narrowing the urban–rural gap.
- In developing markets, rural smartphone penetration enables entry-level investing, but participation still lags urban rates by 10–15 percentage points.
- In China and India, urban investors dominate equity market participation; rural participation is often constrained by infrastructure and financial literacy.
- In the U.S., rural households are statistically less likely to hold equities; surveys show rural participation ~5–10 percentage points below the national average.
- Access to the internet, brokerage services, and financial outreach is more limited in rural areas.
- Some fintech platforms now target rural regions with fractional investing and micro-education modules to reduce the gap.
- The expansion of mobile networks has a positive correlation with increases in rural participation over time.
Barriers to Stock Market Participation
- 44% of Black nonowners and 43% of Hispanic nonowners cite low financial knowledge as the main barrier, compared to 35% for White nonowners.
- Adults without a college degree are 40% more likely than graduates to say they don’t invest due to a lack of knowledge about stock markets.
- Nearly 50% of nonparticipants report perceived volatility and risk during economic uncertainty as their primary deterrent.
- Fees and account minimums are cited by 43% of low-income individuals as obstacles keeping them out of the market.
- 36% of non-investors say the time and effort required to manage investments prevents them from participating.
- Behavioral biases like loss aversion and inertia keep at least 55% of cautious savers from ever buying stocks.
- Distrust of financial platforms and scams is cited by 31% of nonparticipants, especially among older and first-time investors.
- In rural and low-income communities, lack of access to advice or tailored guidance restricts entry for over 25% of potential investors.
- Fixed entry and trading costs are found to constitute about 2% of average annual permanent income, acting as a structural participation barrier.
- Overall participation rates remain low in Asia’s emerging economies (just 7% in China and 6% in India) despite high mobile device usage, mainly due to knowledge, trust, and access issues.
Changes in Stock Market Participation Over Time
- From 2015 to 2025, retail investing has grown severalfold in both account numbers and dollar flows.
- U.S. flows into investment accounts in early 2025 matched or exceeded pandemic-era peaks.
- From 2010 to 2023, the retail share of U.S. equities trading rose from under 10% to over 20%.
- During 2023–2025, retail pent-up flows increased by ~50% after normalization from pandemic extremes.
- The proportion of stock-owning U.S. adults has hovered around 62% in 2025, returning to pre-2008 levels.
- In some emerging markets, digital access has lifted participation by 5–8 percentage points in recent years.
- New regulations and innovation, zero-commission, fractional shares, and robo-advisors have driven the attrition of legacy barriers over time.
- Despite advances, participation rates remain much lower in less developed regions and among disadvantaged groups, showing uneven progress.
Institutional vs. Retail Investor Participation
- Retail investors now account for ~20.5% of daily U.S. equity trading volume, a noticeable rise from below 10% a decade ago.
- In July 2025, institutional investors were net sellers of $26.8 billion in U.S. stocks, while retail investors net bought $10.08 billion.
- Retail participation as a share of S&P 500 inflows touched 12.63%, a relatively high level historically.
- Retail investors and ETFs combined were net buyers of $155.3 billion in equities during H1 2025, the largest recorded in that span.
- Institutional flows are now often routed through passive funds and ETFs, with index/ETF vehicles net buying $22.78 billion in July 2025.
- Retail flows display stronger persistence, and their net flow autocorrelations can help predict short-term volatility.
- Retail and ETF/institutional vehicles are increasingly the marginal price-setters in many equity movements.
- Institutional investors continue to dominate ownership of large blocks, directed strategies, and private markets, but their daily trading share is under pressure.
- Dark pool and off-exchange trading are estimated to account for over 50% of U.S. equities volume in early 2025.
Most Traded Stocks and Market Liquidity
- The New York Stock Exchange sees an average closing auction liquidity of $18.9 billion per day.
- In September 2025, NYSE reported ~1.36 billion shares traded daily on average, while Nasdaq exceeded 9 billion shares in daily turnover.
- Among the most actively traded U.S. stocks in 2025 are Tesla, NVIDIA, and other large-cap tech firms.
- High liquidity stocks attract both institutional and retail flows, creating tight bid–ask spreads and easier execution.
- Liquidity maps show concentration in the top 500 names; smaller stocks have thinner liquidity and more slippage.
Sectoral Distribution of Stock Market Activity
- The technology sector accounted for 29% of total stock market capitalization in Q3 2025, maintaining its lead position.
- Financials represented approximately 15% of the overall market value, ranking as the second largest sector by capitalization.
- Health Care stocks made up around 12.4% of the market cap, with biopharma and medical device firms dominating sub-sector activity.
- Communication Services, including social media and telecom, contributed nearly 10% to aggregate trading volume across major exchanges in Q3 2025.
- Sector rotation in Q3 2025 saw Energy post a 13% gain, outperforming Consumer Staples, which declined by 2%.
- Retail investors increased allocation to hyper-growth groups, with EV sector trading volumes jumping by 18% quarter-over-quarter.
- Biotech and semiconductor segments attracted 22% of new retail inflows via thematic ETFs during the period.
- Index fund inflows caused $84 billion of capital to move across sector ETFs in Q3, promoting diversified holdings.
- Volatility pushed sector correlation higher, with intra-sector price movements rising 16% in periods of macro uncertainty.
- In emerging markets, energy and commodities made up 38% of retail trading activity, far exceeding participation in technology stocks.
Influencing Factors Behind Participation Rates
- In 2025, 62% of Americans report owning stocks, up from 52% in 2016, directly influenced by rising financial literacy.
- Individuals with high financial literacy are 2.7 times more likely to own stocks compared to those with low literacy.
- Participation rates jump by 0.7 percentage points for every 10% increase in broadband penetration, driven by digital access.
- Social network effects increase stock market entry probability, with peer connections boosting participation, especially among wealthier groups.
- Retail investor inflows reached about $130-150 billion in early 2025, spurred by enhanced access through mobile apps and digital platforms.
- Investors in the top income quartile are 4 times more likely to engage in stock markets than those in the bottom quartile.
- Fees and minimums deter engagement, with 43% of low-income investors citing cost as their primary barrier.
- Trust in financial system: 31% of non-participants say lack of fairness is the key reason for staying out of equities.
- Tax incentives and macro policy moves drove a 9% structural rise in retail account openings in Q3 2025.
Frequently Asked Questions (FAQs)
62 % of U.S. adults report owning stock in 2025.
The top 1 % holds 50 % of U.S. stock wealth, worth about $23 trillion.
Retail investors received about 32 % of IPO share allocations in 2025.
Retail investors account for approximately 20.5% of daily U.S. equity trading volume.
Conclusion
Stock market participation is characterized by heightened retail influence, evolving liquidity dynamics, and persistent structural imbalances. While institutional investors retain dominance over capital allocation and strategy, retail flows now meaningfully shift pricing and momentum, especially in liquid, high-profile names. The sectors that capture attention, technology, health, and growth segments, see disproportionate traffic, though broader capital dispersal persists via funds and indices.
Going forward, the frontier lies in expanding participation among underrepresented groups, those constrained by income, education, geography, or trust. Because participation isn’t purely about access, but also about capability (literacy, networks) and incentives (costs, digital infrastructure).


