It starts with a familiar flick of the thumb. A notification pops up during breakfast, a reel plays in the background while brushing teeth, and before we know it, half the morning has disappeared into a scroll. This isn’t just anecdotal, it’s a digital behavior woven into the daily routine of billions. In 2025, social media screen time is more than a habit; it’s a full-scale cultural shift. With new platforms evolving and older ones reengineering their algorithms to retain attention, screen time has reached record highs.
This article unpacks the numbers behind our social media consumption in 2025, who spends the most time, what platforms dominate, and how it all adds up across generations and geographies.
Editor’s Choice
- The average person spends 2 hours and 41 minutes on social media daily in 2025.
- TikTok leads as the most time-consuming app with 59 minutes per day per user globally.
- Gen Z now logs the highest usage, with an average of 3 hours and 18 minutes of daily social media time.
- In the US, daily screen time across all platforms has surpassed 4 hours, with social media accounting for 65% of that duration.
- Women aged 18–29 spend the most time on social platforms, averaging 3.5 hours daily.
- The Philippines maintains the top spot for social media usage by country, with 4 hours and 14 minutes per day.
- AI-curated feeds and short-form video have boosted screen time by over 21% among users aged 13–17 compared to last year.
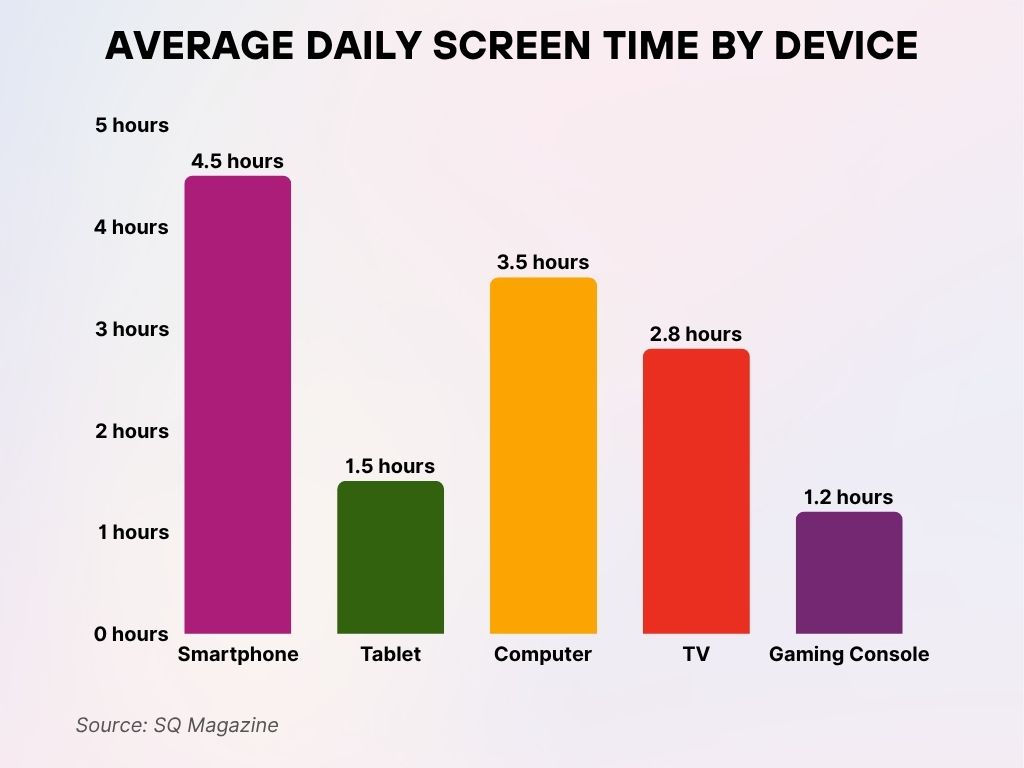
Average Daily Screen Time by Device
- Smartphones dominate with the highest average daily screen time at 4.5 hours, showing their central role in everyday digital life.
- Computers come second, with users spending an average of 3.5 hours daily, reflecting their importance for work, study, and browsing.
- TV viewing accounts for 2.8 hours per day, highlighting its continued relevance for entertainment despite the rise of mobile streaming.
- Tablet users spend around 1.5 hours daily, suggesting more limited but purposeful use compared to smartphones and computers.
- Gaming consoles have the lowest screen time, averaging 1.2 hours per day, likely due to more niche or recreational usage patterns.
Average Daily Social Media Screen Time Worldwide
- In 2025, the global average screen time on social media hit 2 hours and 41 minutes, up from 2 hours and 35 minutes in 2024.
- India, Brazil, and South Africa report the highest year-over-year growth in screen time, each rising by over 6%.
- Developed economies like the United States, the UK, and Australia hover around the 2.5 to 3-hour mark, with steady upward trends.
- Urban dwellers report 24% more social media screen time compared to rural users globally.
- Mobile usage dominates, accounting for 92% of all social media screen time.
- The average time on messaging apps (WhatsApp, Messenger) stands at 43 minutes per day, indicating continued heavy overlap with social media.
- YouTube Shorts and Instagram Reels have driven a 16% increase in average session lengths across platforms.
- In 2025, 1 in 5 users check a social media app within five minutes of waking up.
- Global screen time surpasses 3 hours per day in over 22 countries, including Indonesia, Argentina, and Nigeria.
Screen Time by Gender
- Women lead in daily social media usage, averaging 2 hours and 59 minutes, 17 minutes more than men.
- Men report 2 hours and 42 minutes, with gaming-related communities and platforms driving a chunk of engagement.
- Non-binary users were tracked, spending an average of 3 hours and 12 minutes daily, showing higher interaction rates on platforms like Tumblr and Discord.
- Among teenagers, girls aged 13–17 average 3.7 hours per day, nearly 45 minutes more than boys in the same age group.
- Men dominate usage on platforms like Reddit and Twitter (now X), while women engage more with Instagram, Pinterest, and TikTok.
- In the 35–44 age group, the gap narrows significantly, with both genders logging around 2 hours and 30 minutes daily.
- Women over 50 have shown the highest year-over-year growth in screen time, increasing by 11% in 2025.
- Usage patterns show that men scroll less frequently but for longer sessions, especially on YouTube and long-form content platforms.
- Females in North America outpace global averages, driven by video-based content, health communities, and parenting networks.
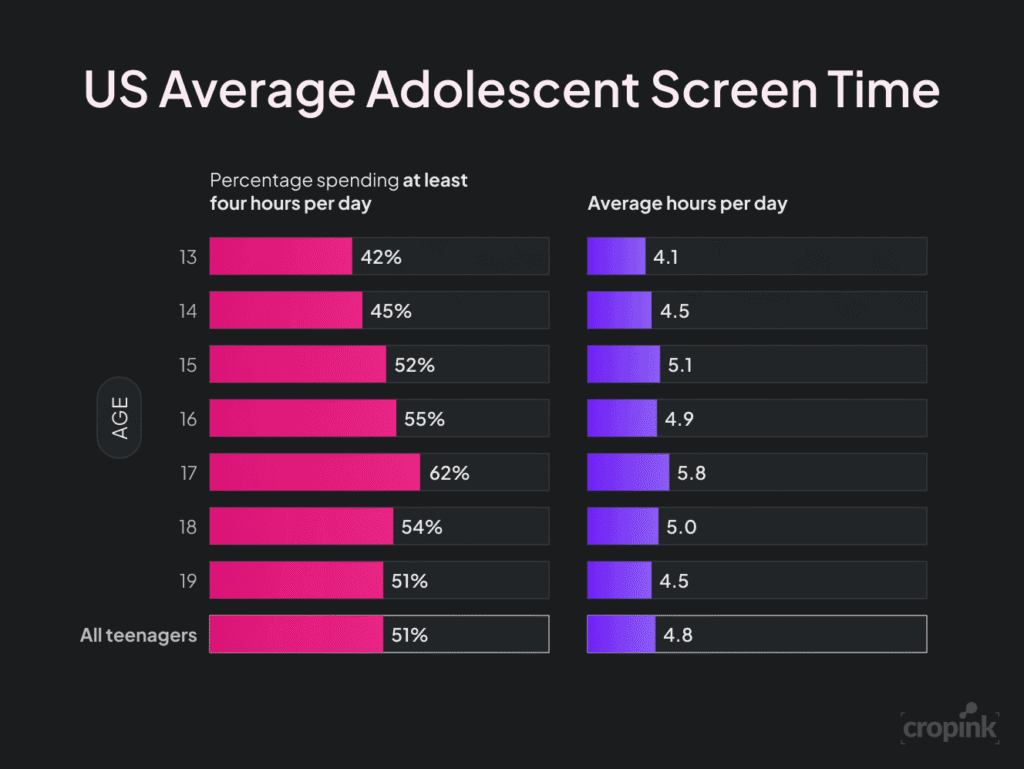
US Average Adolescent Screen Time
- Teens aged 17 spend the most time on screens, averaging 5.8 hours per day, with 62% using screens for at least 4 hours daily.
- 15-year-olds also show high usage, clocking in 5.1 hours on average, and 52% spend 4+ hours per day on screens.
- Average screen time peaks between the ages of 15 to 18, ranging from 4.9 to 5.8 hours, reflecting increased digital dependency in mid-to-late teens.
- The youngest group (age 13) has the lowest screen time, with 4.1 hours daily and 42% exceeding the 4-hour threshold.
- All teenagers combined average 4.8 hours of screen time per day, and 51% spend at least 4 hours daily on screens.
Most Time-Consuming Social Media Platforms
- TikTok remains the most time-consuming app in 2025, with users spending an average of 59 minutes per day.
- YouTube follows closely at 54 minutes, especially strong among Gen Z and Gen Alpha.
- Instagram users log an average of 42 minutes daily, driven by Reels and Stories.
- Facebook, while slightly declining, still garners 33 minutes daily, with strong retention in older demographics.
- Snapchat holds strong among US teens, averaging 38 minutes per day in this group.
- Twitter/X clocks in at 29 minutes, skewed more toward male and news-oriented audiences.
- Pinterest use grew to 19 minutes daily, driven by DIY, wellness, and travel content.
- LinkedIn averages 16 minutes per day among professionals, with spikes during weekday business hours.
- Reddit saw an average daily use of 23 minutes, popular with Gen Z and millennial males.
- Threads, Meta’s newest text-based app, gained traction in 2025 with users spending 12 minutes per day on average.
Mobile vs Desktop Screen Time on Social Media
- Mobile dominates social media screen time, accounting for 92% of all usage in 2025.
- On average, users spend 2 hours and 29 minutes daily on mobile compared to just 12 minutes on desktop.
- YouTube is the only platform with near-equal desktop/mobile distribution due to longer video formats.
- Gen Z users average over 3 hours on mobile daily, using phones for virtually all social interactions.
- Desktop social media use is concentrated among professionals (especially on LinkedIn) and desktop gamers using Discord.
- The average mobile session length increased by 9%, from 5.7 minutes in 2024 to 6.2 minutes in 2025.
- Tablet usage for social media dropped by 13%, now making up less than 2% of total screen time.
- Short-form video and story formats contributed significantly to mobile time increases across all age groups.
- Emerging markets rely almost entirely on mobile for social access, with desktop access under 5%.
- In the US, 87% of Facebook usage and 95% of Instagram usage now happens via smartphones.
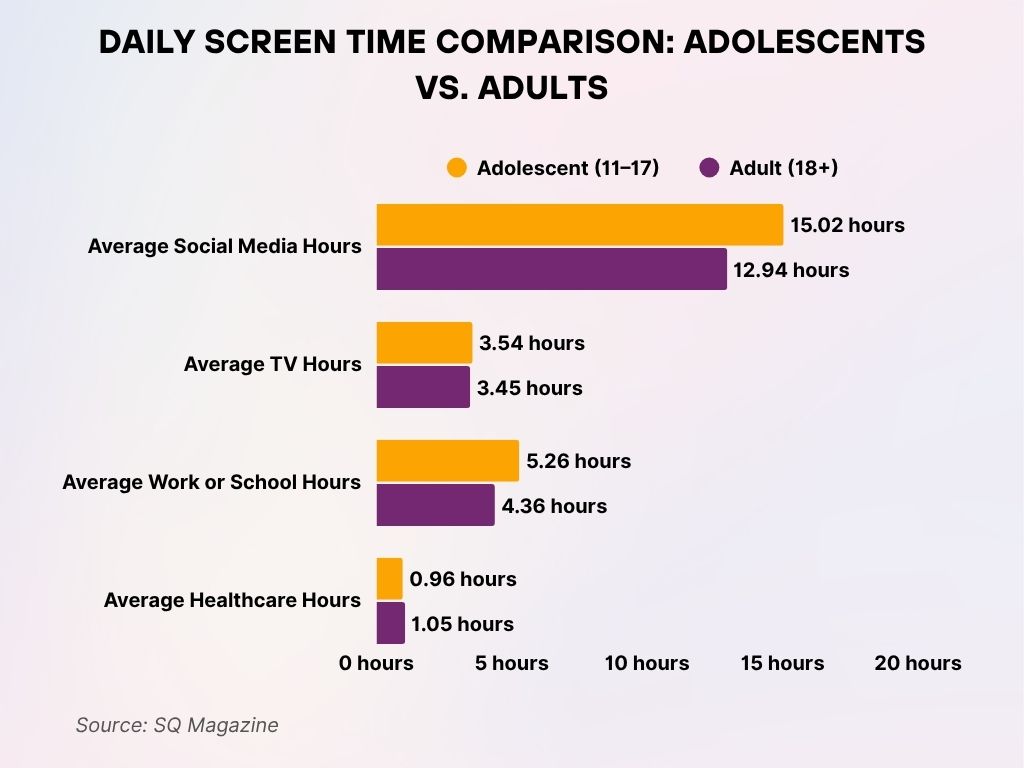
Daily Screen Time Comparison: Adolescents vs. Adults
- Adolescents (11–17) spend a staggering 15.02 hours daily on social media, significantly higher than adults (18+), who average 12.94 hours.
- TV viewing time is nearly the same across both groups, with adolescents at 3.54 hours and adults at 3.45 hours per day.
- Work or school-related screen time is higher among adolescents at 5.26 hours, compared to 4.36 hours for adults.
- When it comes to healthcare-related screen usage, adults lead slightly with 1.05 hours daily, while adolescents average 0.96 hours.
Social Media Screen Time Trends Over the Years
- Global screen time on social media has increased by 38% over the past five years.
- In 2020, the global average was 2 hours and 4 minutes, rising to 2 hours and 41 minutes in 2025.
- COVID-19 in 2020–2021 saw the biggest spike, with a 24-minute jump in average daily usage.
- From 2022 to 2024, the growth slowed but stabilized, now resuming a gradual upward trend in 2025.
- The shift to short-form video between 2023 and 2025 added nearly 30 minutes of additional screen time per week.
- Time spent on AI-recommended content increased by 44% from 2023 to 2025, significantly boosting passive engagement.
- Weekly screen time crossed 18.8 hours globally in 2025, compared to 17.3 hours in 2024.
- Older users (55+) increased their weekly time by 18%, driven by more intuitive interfaces and interest-based content.
- Screen fatigue led to slight dips in usage on certain platforms like Facebook and Twitter/X in mid-2024 but rebounded in late 2025.
- By the end of 2025, 65% of total mobile screen time will be spent on social and messaging apps combined.
Impact of Screen Time on Mental and Physical Health
- In 2025, 68% of users aged 13–24 reported that social media negatively impacts their mental well-being at least once a week.
- Sleep quality is significantly affected, with 1 in 3 users reporting difficulty falling asleep due to late-night scrolling.
- Anxiety symptoms are reported in 42% of heavy users (defined as 4+ hours/day on social platforms).
- Users who reduced screen time by 30 minutes per day reported a 22% improvement in mood over four weeks.
- Posture-related issues and digital eye strain are prevalent in over 51% of users spending more than 3 hours daily online.
- Teens aged 14–17 report a 27% higher rate of depressive symptoms compared to those with less than 1.5 hours of screen time.
- A 2025 meta-study found that limiting social media use to under 90 minutes per day significantly reduced cortisol levels.
- Parents of young users are increasingly concerned, with 76% reporting that screen time affects their child’s physical activity.
- On the positive side, 45% of users say social media helps them feel more connected, especially those in remote areas.
- Platforms have introduced “Take a Break” features, but only 12% of users consistently utilize them.
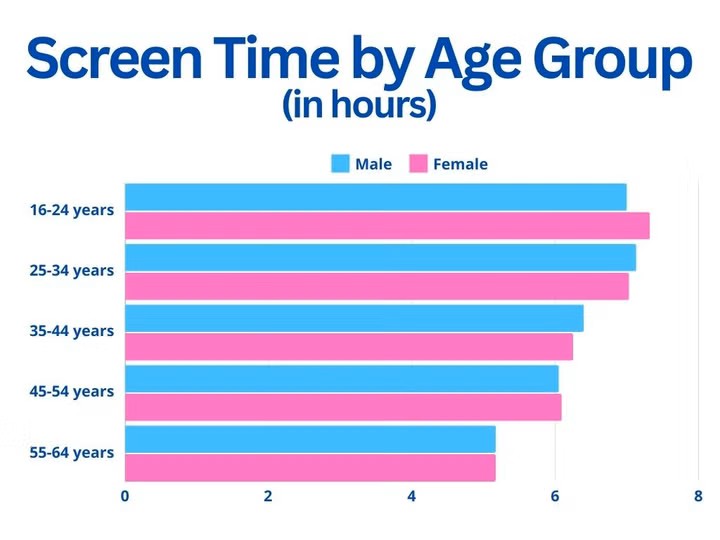
Screen Time by Age Group and Gender
- Young adults aged 16–24 record the highest screen time, with females slightly surpassing males, both nearing 7 hours daily.
- In the 25–34 age group, both genders maintain high screen time, with females again edging ahead, averaging just under 7 hours.
- Among those aged 35–44, males and females average roughly 6.5 hours, showing a small decline from younger age groups.
- For the 45–54 age bracket, screen usage remains steady at around 6 hours, with both genders showing near-equal usage.
- Seniors aged 55–64 display the lowest screen time, with males averaging around 5 hours and females slightly higher.
This data suggests that younger generations are more digitally engaged, with females consistently spending slightly more time on screens than males across most age groups.
Screen Time Differences Between Gen Z, Millennials, and Older Generations
- Gen Z (ages 11–26) leads with an average of 3 hours and 18 minutes of daily social media time.
- Millennials (ages 27–42) follow with 2 hours and 47 minutes, most active during early mornings and late evenings.
- Gen X (ages 43–58) spends about 1 hour and 53 minutes per day, primarily on Facebook, LinkedIn, and YouTube.
- Boomers (59+) maintain lower but steadily growing engagement, averaging 58 minutes daily, with 2025 marking a 7% rise over 2024.
- Gen Z users interact with an average of 6 different platforms daily, compared to 3.2 platforms for Gen X.
- Millennial parents spend more time on Facebook groups, parenting communities, and lifestyle content than younger cohorts.
- The average session time for Gen Z users on TikTok now exceeds 11 minutes.
- Boomers favor longer but fewer sessions, often browsing news or comment threads rather than fast-scrolling.
- Gen Z users check social media over 17 times per day, double the frequency of Gen X.
- Among Millennials, time spent on career-oriented platforms (e.g., LinkedIn) rose by 19% in 2025.
Parental Concerns and Monitoring of Social Media Use
- 72% of US parents say they are concerned about their children’s daily screen time on social platforms.
- 59% use parental control tools, while only 23% believe these tools are fully effective.
- In 2025, 43% of parents report that their child spends 3 or more hours daily on platforms like TikTok or Instagram.
- Screen time contracts and app timers are now used in 1 out of every 4 US households with teens.
- 63% of parents say social media has negatively influenced their child’s self-esteem at least once in the past year.
- Digital well-being dashboards are offered by 5 out of 6 major platforms, but only 28% of parents actively monitor them.
- Mothers are 1.5x more likely than fathers to set screen time rules and restrictions.
- 38% of families have adopted app-level content filters to reduce exposure to inappropriate content.
- Schools in 18 US states have introduced optional programs to educate parents on managing tech use at home.
- Shared screen time plans, where parent and child set daily limits together, saw a 22% adoption increase from 2024 to 2025.
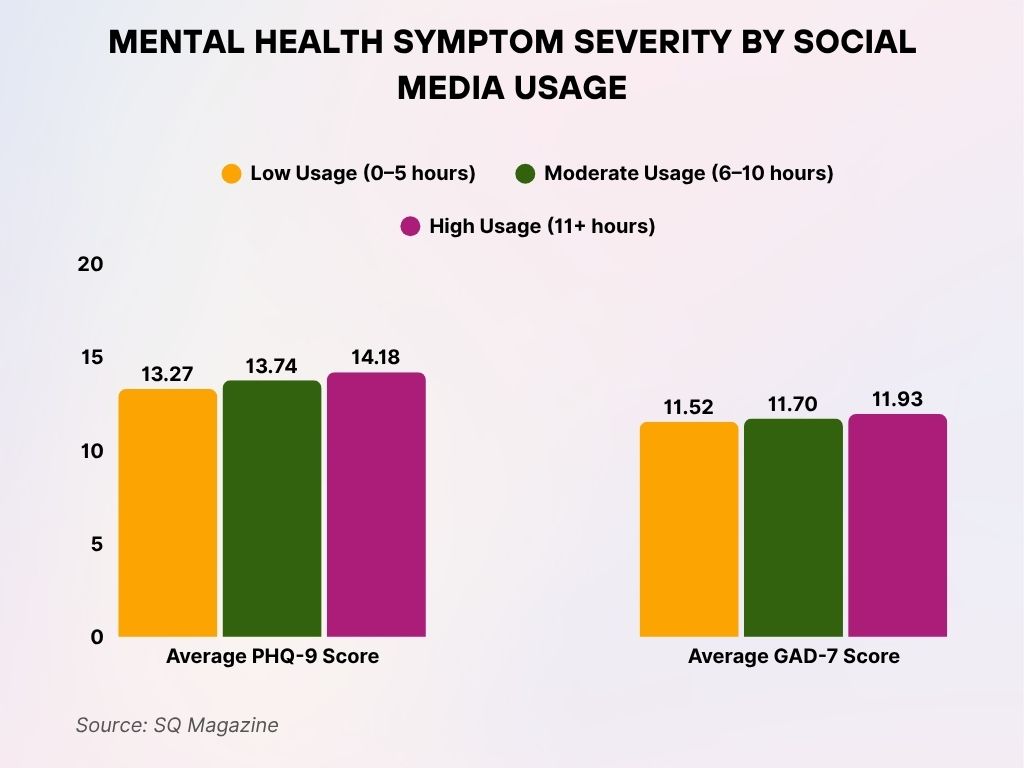
Mental Health Symptom Severity by Social Media Usage
Higher social media use correlates with more severe depression symptoms, as shown by a rising PHQ-9 score:
- 13.27 for low usage (0–5 hours)
- 13.74 for moderate usage (6–10 hours)
- 14.18 for high usage (11+ hours)
Anxiety levels also increase slightly with more screen time, based on GAD-7 scores:
- 11.52 for low usage
- 11.70 for moderate usage
- 11.93 for high usage
This data highlights a clear upward trend in both depression and anxiety symptoms as social media usage exceeds 11 hours per day.
Workplace Productivity and Social Media Distraction
- 32% of remote employees admit to using social media during work hours for over an hour daily.
- The average knowledge worker loses 56 minutes per day due to social media distractions.
- Slack, Teams, and LinkedIn blur the line between work and socializing, accounting for a significant portion of usage.
- 41% of US companies have implemented app-blocking tools or restricted Wi-Fi access to specific sites.
- 70% of HR leaders say social media-related productivity loss is a concern, especially in hybrid roles.
- Despite distraction, 23% of employees claim social media helps them decompress or find professional insights.
- In 2025, time-tracking tools show that Instagram and YouTube are the most accessed non-work platforms during office hours.
- Employee monitoring software usage increased by 18% YoY, largely driven by mid-sized US firms.
- Workers aged 25–34 are the most distracted demographic, with 64% saying social media interrupts their focus at least once a day.
- Managers report a 12% productivity gain in teams where optional “digital detox” hours were introduced.
Tools and Apps to Track and Limit Screen Time
- Apple Screen Time and Google Digital Wellbeing remain the most used default tracking tools in 2025.
- Freedom, RescueTime, and Forest rank as the top third-party screen-limiting apps across iOS and Android.
- Over 60% of users aged 18–34 have at least one app installed to monitor or control screen time.
- Instagram and TikTok both rolled out new AI-based screen nudging features in early 2025.
- “Focus mode” features on smartphones saw a 24% increase in daily activation compared to 2024.
- Parents are the largest user group of multi-device control apps like Bark and Qustodio.
- 4 out of 10 teens admit to bypassing screen time limits “often,” showing mixed effectiveness.
- New wearable tech integrations allow for wrist-based alerts when users exceed daily limits.
- Platforms now provide weekly “time well spent” insights, but only 18% of users act on these recommendations.
- Microsoft Family Safety saw a 35% YoY growth in new registrations, especially among US households.
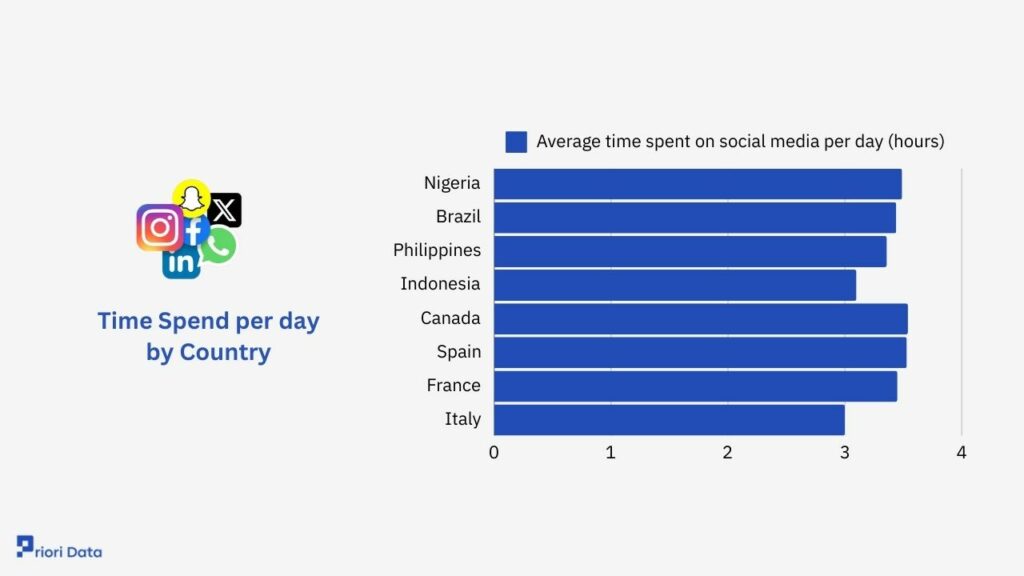
Average Daily Social Media Usage by Country
- Nigeria leads globally with users spending an average of almost 4 hours per day on social media.
- Brazil and the Philippines closely follow, each with well over 3 hours daily, showing high engagement levels.
- Indonesia, Canada, and Spain all hover around 3.5 hours, reflecting widespread and consistent usage.
- France and Italy show slightly lower usage, but still average around 3+ hours daily on social platforms.
This data highlights that developing nations and younger populations tend to spend more time on social media than others.
Recent Developments in Social Media Usage Patterns
- In 2025, vertical video content now account for 67% of all time spent on social platforms.
- Threads by Meta gained over 90 million monthly active users, growing its US base by 38% since January.
- AI-generated content (avatars, filters, captions) is used by 1 in 3 Gen Z users daily.
- Voice-based social interactions (e.g., Spaces, Clubhouse-style rooms) saw a 12% revival in Q2 2025.
- Short-form live shopping events surged on Instagram and TikTok, boosting time spent by 17% during weekends.
- Platforms are increasingly merging features, YouTube added “Stories”, and TikTok is testing long-form videos.
- Social fitness and wellness platforms like Strava and BeReal saw usage rise by 22%, particularly among 25–40-year-olds.
- In-app learning surged, with platforms like TikTok and LinkedIn offering micro-courses and skill certification badges.
- Cross-platform posting (e.g., one post shared to Threads, Instagram, and Facebook) is now done by 61% of creators.
- Synthetic media policies are being rolled out by all major platforms to regulate AI-generated content and preserve authenticity.
Conclusion
The numbers from 2025 are clear: social media has become a fully embedded layer of everyday life, not just a communication tool, but a place for news, learning, self-expression, and distraction. As screen time steadily climbs, its influence stretches further across age groups, industries, and nations. From Gen Z’s dominance of digital spaces to parents navigating teen screen limits, and professionals toggling between focus and feed, our screen time tells a vivid story of the times. The balance between connectedness and well-being remains a challenge, but one thing’s certain: social media isn’t just part of the day; it is the day for many.

