Some publicly traded companies stand out not just for their size, but for the staggering price of a single share. From the U.S. to Switzerland, share prices have climbed into six-figure territory and beyond, reflecting unique corporate histories and investor perceptions. For example, in the U.S., mega-cap conglomerates can trade at half a million dollars per share, while in Europe, select luxury-brand firms command similarly elevated valuations.
In industry scenarios such as family-controlled firms avoiding share splits or global luxury brands with limited float, these high prices carry real implications for access, liquidity, and investor behavior. Read on to explore the breadth of data and what it reveals about equity markets worldwide.
Editor’s Choice
- The top global share price in 2025 is for Berkshire Hathaway Class A (BRK.A) at approximately $736,150 per share.
- Swiss chocolate maker Lindt & Sprüngli AG trades around CHF 124,400 per share as of November 2025.
- Several countries’ markets now host multiple six-figure-priced stocks, raising questions of accessibility for retail investors.
- The high share price phenomenon highlights corporate governance choices such as no share split and concentrated ownership.
- Global investors are increasingly examining such stocks for not just valuation, but also liquidity and market structure nuances.
Recent Developments
- In March 2025, Berkshire Hathaway’s Class A shares hit a new intraday high of ≈ $800,000.
- Lindt & Sprüngli’s share price rose ~22.7% in 2025 year-to-date, as per its investor update.
- Analysts note an increasing trend of ultra-high share prices in markets where share splits are rare or discouraged.
- In Q3 2025, Berkshire Hathaway reported earnings of nearly $30.8 billion, supporting its high valuation.
- Investors in high-priced-per-share stocks face unique entry barriers and may rely on fractional shares or alternative funds.
- Regulatory commentary in some jurisdictions is increasing regarding corporate communications around high share prices and investor access.
- Some markets have seen multiple firms reach six-figure share prices within the same year, increasing the prevalence of this phenomenon globally.
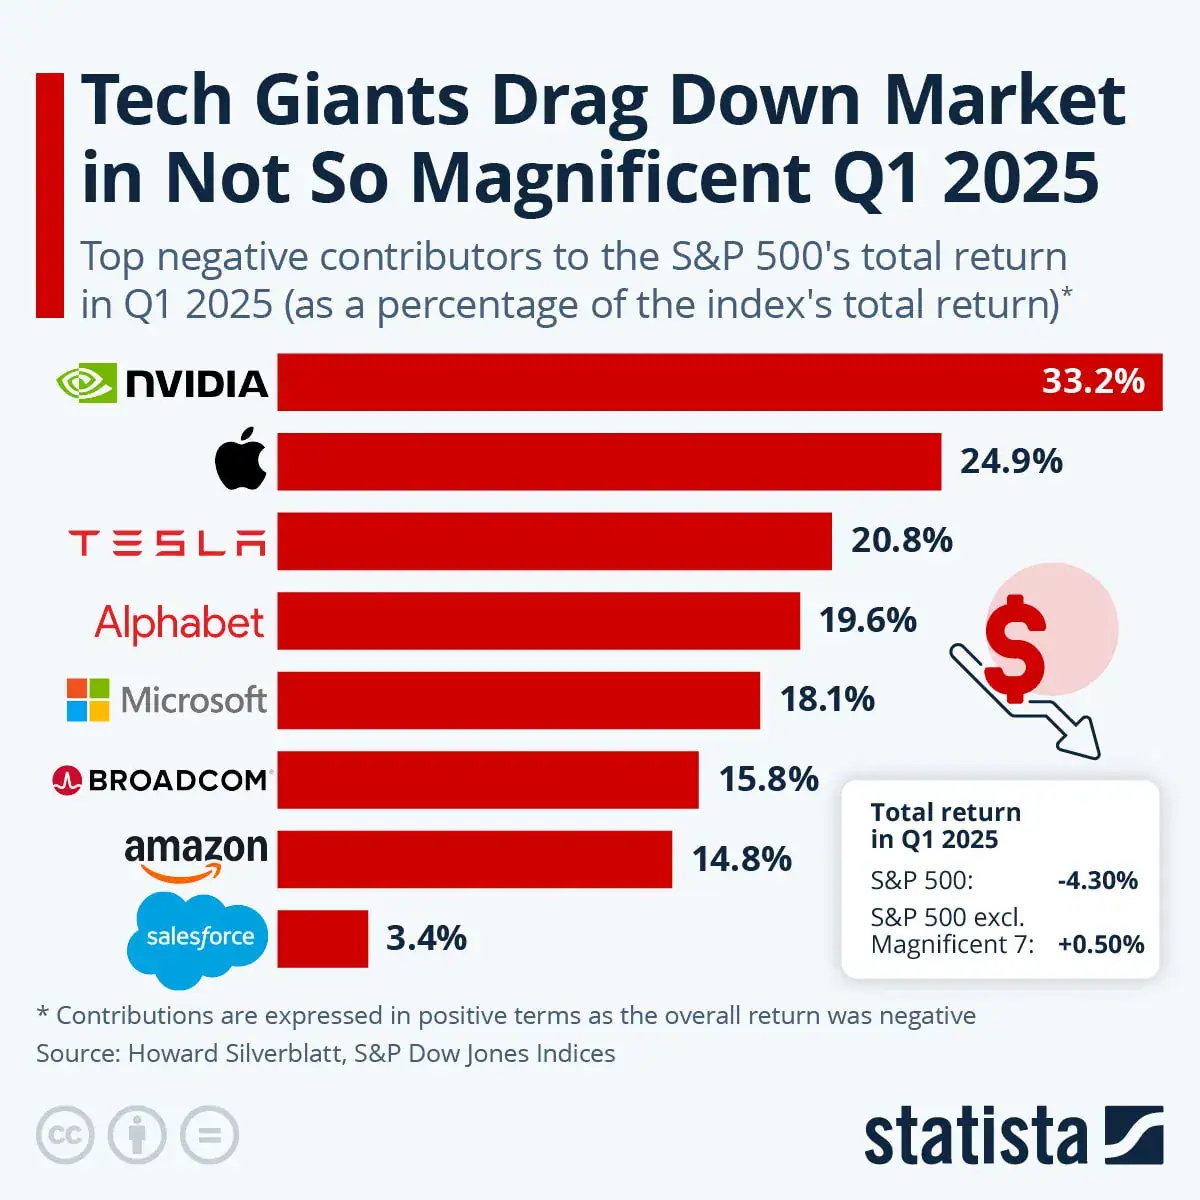
Tech Giants’ Drag on the S&P 500
- NVIDIA caused the largest decline, contributing 33.2% to the S&P 500’s Q1 2025 drop.
- Apple followed, adding a 24.9% drag to the index’s overall loss.
- Tesla accounted for 20.8% of the negative performance, reflecting weak EV sentiment.
- Alphabet contributed 19.6%, while Microsoft closely followed at 18.1%.
- Broadcom and Amazon added 15.8% and 14.8% to the decline, respectively.
- Salesforce had a smaller negative impact of 3.4%.
- Excluding these “Magnificent 7” stocks, the S&P 500 would have shown a +0.5% gain instead of a 4.3% loss.
Top Factors Influencing Expensive Stocks
- Berkshire Hathaway Class A shares remain the most expensive stock globally at about $730,000 per share in 2025
- Companies with no share split policy see their per-share price increase naturally, with some stocks growing over 100% over a decade without splits
- Stocks with low public float, typically fewer than 10 million shares, often experience price swings exceeding 20% in a day
- Family or insider-controlled companies tend to trade at higher prices due to limited shares, increasing price volatility by up to 30%
- Brands with a strong global luxury reputation have shown stock returns up to +88% outperforming market averages over 15 years
- Dividend reinvestment strategies can boost long-term stock value by over 60% compared to withdrawing dividends as cash
- Firms with strong earnings and cash reserves show consistent positive market valuations, attracting premium multiples above 20x P/E
- Market psychology can drive niche investor interest, sometimes inflating expensive stock prices by approximately 2-4% around split announcements
- Some countries have cultural or regulatory norms reducing stock splits, contributing to average price per share levels 30-50% higher than markets with frequent splits
- Currency fluctuations can affect USD-equivalent stock prices by up to 15%, impacting perceived expensive stock valuations internationally
Stock Price Trends and Historic Highs
- The Berkshire Hathaway Class A shares reached approximately $732,467 per share in June 2025.
- As of early October 2025, some sources list Berkshire’s per-share price around $740,395.50.
- The Swiss confectionery company Lindt & Sprüngli AG shares trade above CHF 129,000 (~USD equivalent), putting it among the highest-priced stocks globally.
- U.S. home-builder NVR Inc. shows a share price of around $7,116.53 for one of the highest non-split stocks.
- The list of “most expensive stocks by share price” globally shows fewer than a dozen companies with share prices greater than $1,000,000 or equivalent when converted to USD.
- Despite high share prices, these companies vary widely in market cap, indicating per-share price is only one dimension of valuation.
- For U.S. stocks, the “most expensive” list by share price is led by BRK.A (~$737,180 as of recent data) followed by NVR (~$8,000), and others.
- Historical high records show BRK.A reached an intraday high of $809,350 in May 2025.
- These historic highs are often shaped by corporate policies such as non-splits rather than purely growth dynamics.
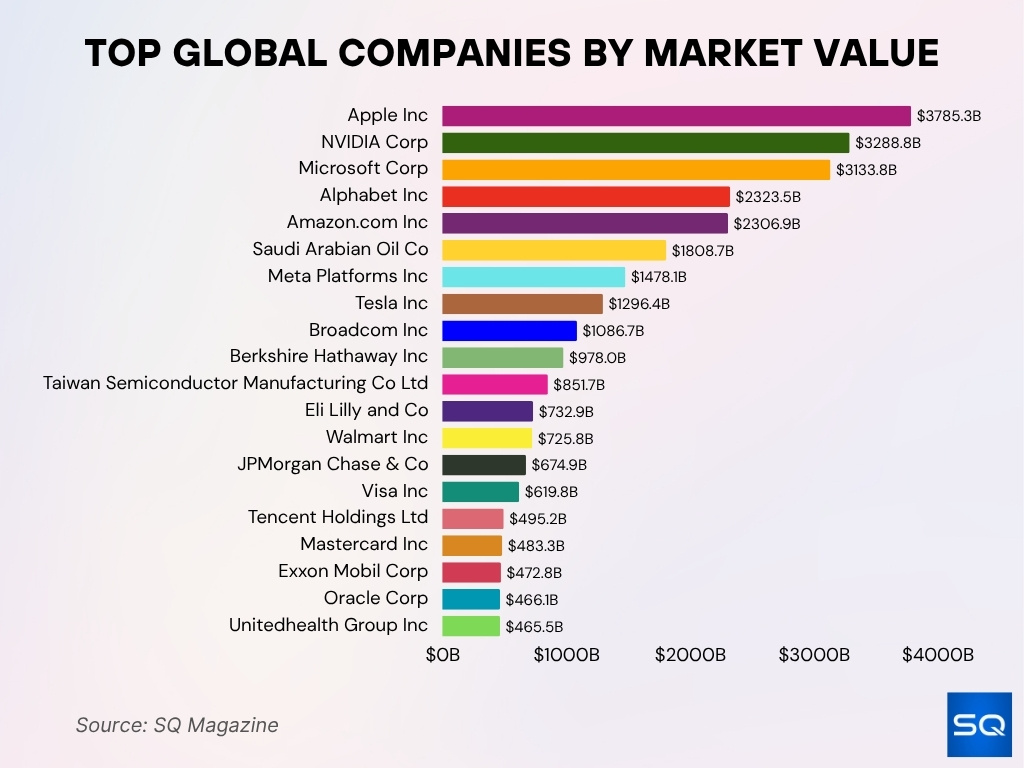
Top Global Companies by Market Value
- Apple Inc. leads with a $3,785.3 billion valuation, remaining the world’s most valuable company.
- NVIDIA Corp ranks second at $3,288.8 billion, fueled by AI and GPU market dominance.
- Microsoft Corp holds $3,133.8 billion, driven by strong cloud and enterprise software growth.
- Alphabet Inc. stands at $2,323.5 billion, supported by advertising and AI expansion.
- Amazon.com Inc. follows with $2,306.9 billion, powered by e-commerce and AWS services.
- Saudi Aramco leads energy firms at $1,808.7 billion in valuation.
- Meta Platforms Inc. is valued at $1,478.1 billion, highlighting growth in social and VR sectors.
- Tesla Inc. holds $1,296.4 billion, reflecting continued EV and energy demand.
- Broadcom Inc. reaches $1,086.7 billion, benefiting from semiconductor and infrastructure software.
- Berkshire Hathaway Inc. stands at $978.0 billion, driven by diversified investments.
- TSMC holds $851.7 billion, leading global chip manufacturing.
- Eli Lilly and Co. hits $732.9 billion, boosted by high-performing pharmaceutical innovations.
- Walmart Inc. maintains $725.8 billion, showing retail scale and consumer strength.
- JPMorgan Chase & Co. leads banking with $674.9 billion in market value.
- Visa Inc. is worth $619.8 billion, reflecting global digital payment growth.
- Tencent Holdings Ltd has $495.2 billion, marking its dominance in Chinese tech.
- Mastercard Inc. follows at $483.3 billion, underscoring its payment network power.
- Exxon Mobil Corp records $472.8 billion, remaining a top energy performer.
- Oracle Corp holds $466.1 billion, driven by enterprise software and cloud demand.
- UnitedHealth Group Inc. closes the list at $465.5 billion, leading the healthcare sector.
Industry Sectors Dominating High Stock Prices
- Berkshire Hathaway shares trade around $734,000 per share, reflecting no split policy and diversified holdings.
- LVMH, a luxury goods leader, saw a 13% stock price surge after strong Q3 2025 sales in China.
- Homebuilder stocks like NVR Inc. have experienced price spikes with P/E ratios above 20x driven by strong earnings.
- Booking Holdings’ share price fluctuates near $5,000-$5,800 as of late 2025, reflecting travel sector strength.
- Seaboard Corporation trades with a low float of under 1 million shares and a share price above $2,700.
- Companies avoiding share splits often sustain prices 30-50% higher than peers in sectors with splits.
- Luxury sector index STOXX Europe Luxury 10 gained 48% from mid-2022 to early 2023, outperforming broader markets.
Record-Holding Companies for Highest Share Price
- Berkshire Hathaway holds the record for the highest publicly traded common share price globally (~$730,000+).
- Lindt & Sprüngli AG is the highest-priced European stock by share price, trading above CHF 129,000 (~USD equivalent) in 2025.
- NVR Inc. is arguably the highest-priced U.S. stock outside of BRK.A, with shares above $7,000.
- Booking Holdings had a closing high of ~$5,805.92 on July 7, 2025.
- Seaboard Corporation shares trade at ~$2,700+ as of October 2025.
- The world record has shifted slowly upward as companies maintain non-split policies and investor demand remains steady.
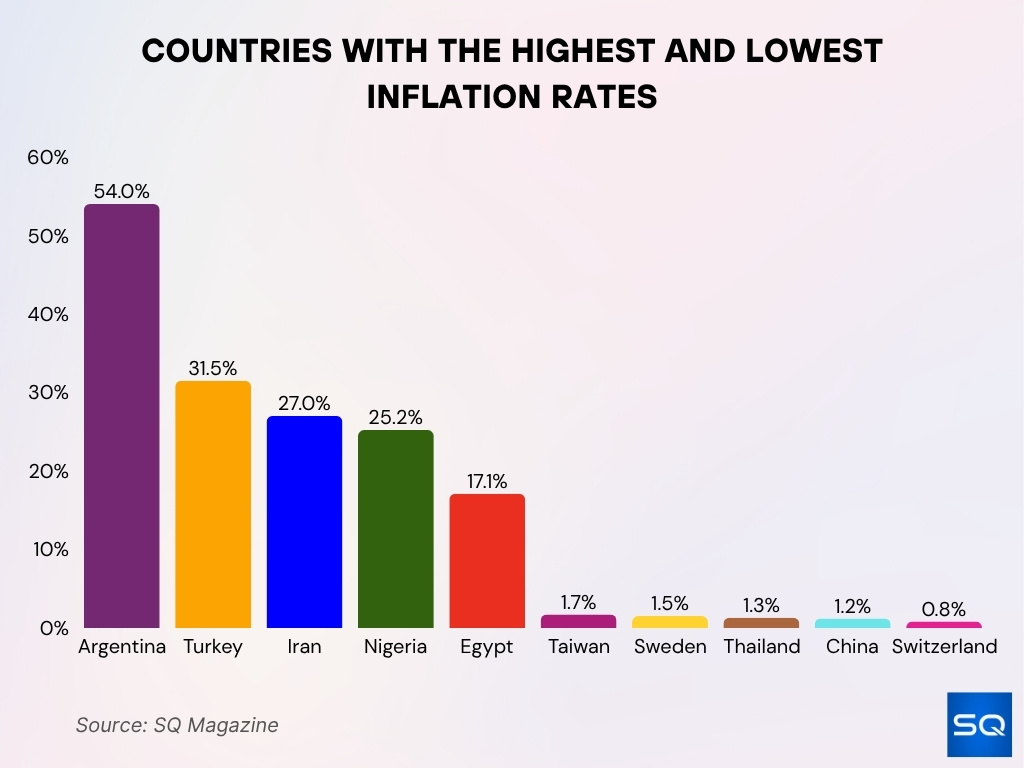
Countries With the Highest and Lowest Inflation Rates
- Argentina tops the list with 54.0% inflation, showing severe economic instability.
- Turkey records 31.5%, reflecting persistent currency and cost challenges.
- Iran faces 27.0% inflation, driven by sanctions and domestic issues.
- Nigeria posts 25.2%, mainly due to supply disruptions and policy inefficiencies.
- Egypt records 17.1%, staying in double digits despite stabilization efforts.
- Switzerland maintains the lowest rate at 0.8%, reflecting strong price stability.
- China keeps inflation low at 1.2%, supported by a managed monetary policy.
- Thailand at 1.3%, Sweden at 1.5%, and Taiwan at 1.7% remain below the 2% benchmark, signaling stable inflation control.
Comparison of Stock Prices Across Major Markets
- In 2025, U.S. top stock prices range from about $5,000 to $737,000 per share.
- Lindt & Sprüngli trades above CHF 129,000, remaining one of the priciest stocks globally.
- Emerging markets rarely feature in top stock price rankings due to frequent splits and larger floats.
- The global top-10 expensive stocks list in 2025 includes 2 U.S. companies and 1 Swiss firm.
- Currency fluctuations can shift non-U.S. stock rankings by up to 10-15% in USD terms.
- U.S. investors face additional costs with ADR fees and currency conversion for Swiss stocks.
Periodic Price Movements and Volatility
- AI-related firms such as Tesla and Palantir traded at forward P/E multiples over 200 before corrections in 2025.
- The U.S. market’s cyclically adjusted P/E (CAPE) ratio reached around 38-40 in September 2025, the highest since the dot-com era.
- Some large-cap stocks experienced intraday price swings exceeding ±10% during 2025 amid macro and AI-related events.
- Limited float in high-priced stocks can cause price moves to be exaggerated, with volatility levels up to 30% higher than high-float peers.
- Certain expensive tech and AI stocks faced double-digit percentage corrections after rapid price increases in 2025.
- High entry costs mean a 5% price move in a $10,000 share translates to a $500 absolute gain or loss per share.
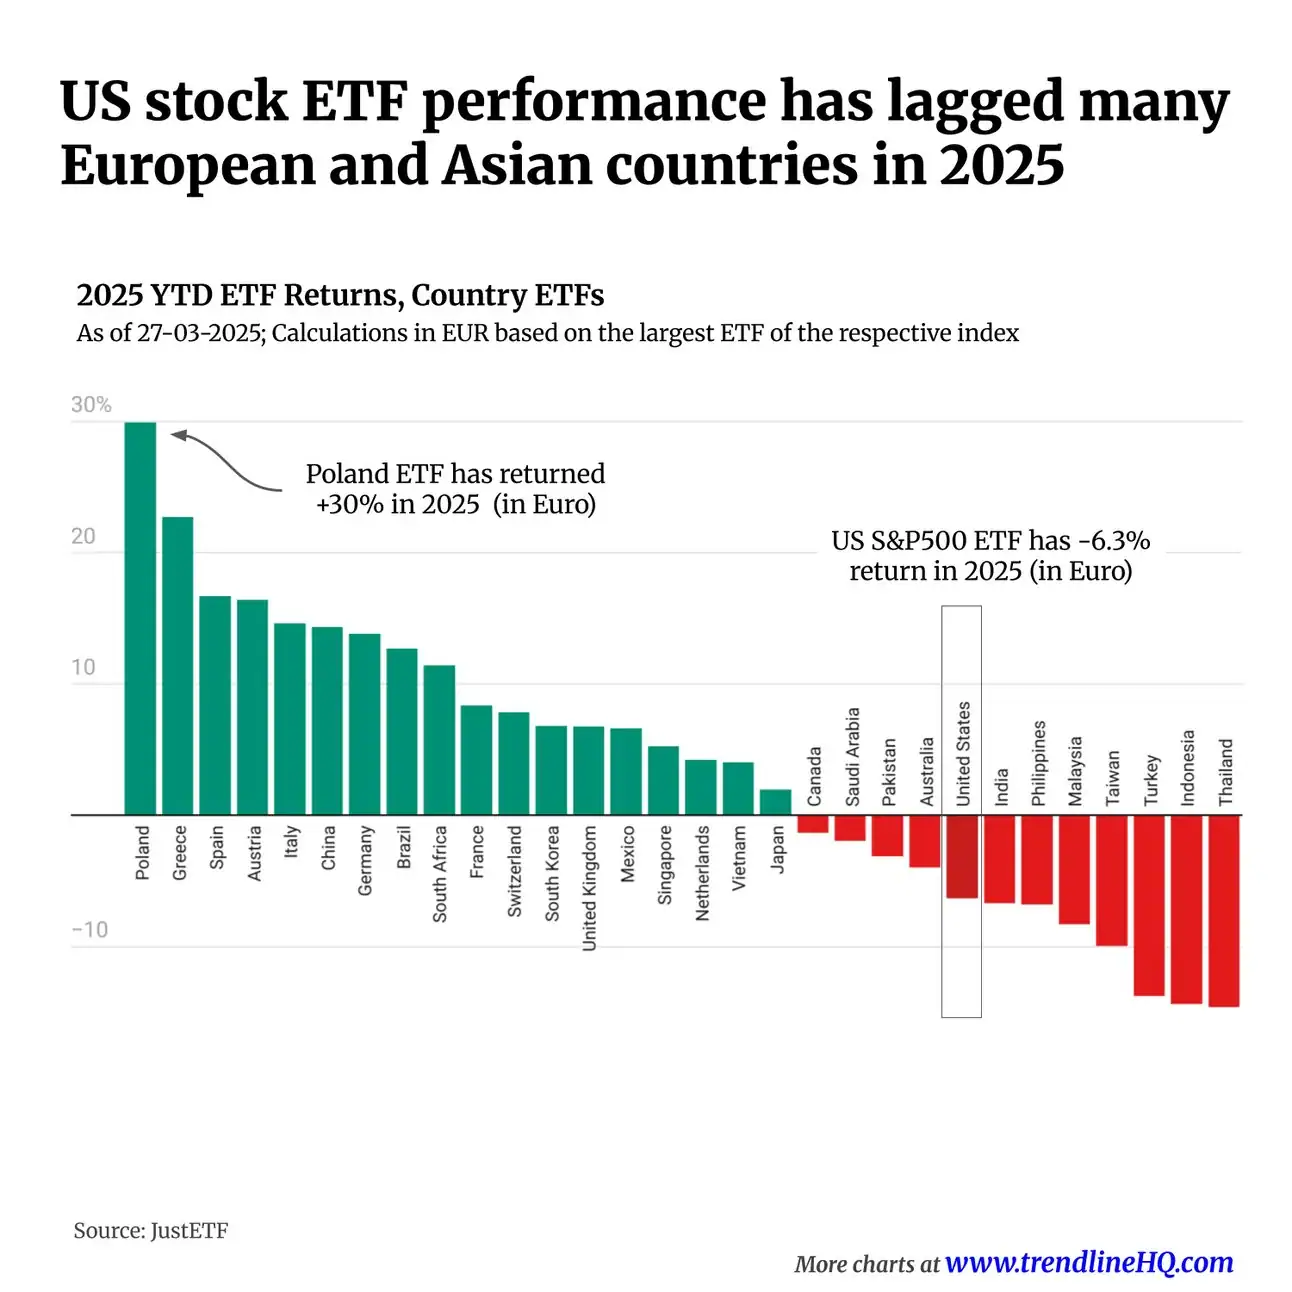
Country ETF Performance: Global Returns Snapshot
- Poland leads 2025 with a +30% return, the best among all country ETFs.
- Greece, Spain, Austria, and Italy follow with strong double-digit gains.
- Germany, Brazil, and South Africa post solid positive returns, reflecting broad regional strength.
- Switzerland, South Korea, France, and Mexico record moderate gains under mixed global conditions.
- US S&P 500 ETF underperforms sharply with a -6.3% return, lagging most European and Asian peers.
- Japan, Canada, Saudi Arabia, and Pakistan also show negative returns in 2025.
- Worst performers include India, the Philippines, Malaysia, Taiwan, Turkey, Indonesia, and Thailand, many with double-digit losses.
Stock Price Peaks by Year
- Berkshire Hathaway Class A shares reached a closing high of about $809,350 in May 2025.
- BRK.A’s share price at close on June 23, 2025, was roughly $732,467.
- Booking Holdings attained a closing high near $5,614.61 on June 6, 2025.
- AutoZone hit an all-time high of about $3,880.15 on May 20, 2025.
- The list of the most expensive stocks by share price in 2025 shows the top spot remaining above $700,000 per share.
- The predominant trend is that companies reaching new peaks tend to do so via incremental growth of share price rather than massive leaps.
- These “peak” share prices often reflect a combination of high price + limited float, making their year-to-year comparisons less about earnings and more about corporate discipline and market access.
Price-to-Earnings Ratios of Top Companies
- As of late 2025, the broad global equity market’s P/E ratio stands at about 28.4 and its P/E10 (CAPE) ratio at ~38.6, the highest level since November 2021.
- For major markets, the U.S. market’s MSCI index shows a P/E of 25.60 in May 2025.
- Germany’s P/E ratio in the same dataset is about 19.79.
- Japan’s P/E ratio is approximately 15.99.
- Some individual companies with the highest per-share price are not necessarily trading at extreme P/E ratios; their expensive status comes from high unit price and limited float rather than ultra-high multiple.
- Stocks trading at high P/E multiples carry increased risk of downside if earnings growth fails to meet very high expectations.
- Market-wide P/E pressure suggests that many expensive stocks are trading in environments of elevated valuation, increasing sensitivity to earnings disappointments.
Influence of Economic Indicators on Stock Valuations
- Rising interest rates pushed high-multiple stocks down by 8-12% on average in 2025.
- Slower economic growth reduced premium stock valuations by about 7% during Q2 2025.
- Inflation above 3% compressed P/E multiples for expensive stocks by up to 10%.
- U.S. market valuations traded near a 5% minimal margin of safety as of late 2025.
- Rate-hike expectations caused discount rates to rise, lowering stock valuations by 4-6% on average.
- Geopolitical shocks in 2025 led to sharper declines of 10-15% in high-entry-cost stocks.
- GDP growth slowdown in 2025 correlated with a 6% drop in expensive stock prices.
- Rising unemployment rates were linked to a 5% contraction in premium stock market segments.
- Consumer confidence dips reduced expensive stock valuations by approximately 4%.
- Volatile macroeconomic conditions amplified high-priced stock price swings by over 20%.
Impact of Currency Rates on Market Prices
- A 10% USD strength can reduce foreign stock prices by a similar margin in USD terms.
- Swiss stocks trading at CHF 129,000 vary widely in USD price with CHF/USD rate shifts of 5% or more.
- Currency volatility caused U.S. investor returns on foreign stocks to fluctuate by up to 15% annually.
- Cross-border fees add approximately 1-3% to the effective cost for U.S. investors buying foreign stocks.
- Countries with weakening currency often see local stock valuations drop 7-10% in USD terms despite stable domestic prices.
- A strong USD versus the Euro in 2025 made many European stocks appear 12% cheaper for U.S. investors.
- Currency risk increases overall portfolio volatility by around 5% for investors holding international high-priced stocks.
- ADR fees typically reduce foreign stock returns to U.S. investors by roughly 0.5-1% per year.
- High-priced stocks with global earnings exposure saw relative valuation changes of 8-10% based on exchange movements.
Emerging Trends in Global Stock Valuations
- Fractional-share trading grew by 40% in retail adoption in 2025, increasing demand for high-priced stocks.
- Over 70% of the top 100 expensive stocks maintain a no split share policy as of 2025.
- Selective high-priced stocks emerged in emerging markets with low float structures, growing by 15% annually.
- The U.S. stock market trades at a P/E ratio of 28.4, versus the global average of approximately 22.46 in 2025.
- AI and tech-driven stocks account for over 35% of high-priced stock market capitalization globally.
- ESG-focused firms attract up to 25% higher valuations in the high-priced stock category.
- ETFs and mutual funds holding expensive stocks grew assets under management by 18% in 2025.
- Emerging market firms with high unit prices increased listings by 20% from 2023 to 2025.
- Concentrated ownership in expensive shares is seen in over 60% of stocks with prices above $1,000 per share.
- Growth narratives rather than current earnings drive over 50% of valuation multiples in ultra-high-price shares.
Frequently Asked Questions (FAQs)
Lindt & Sprüngli’s share price rose approximately 22.7% year-to-date in 2025
The global equity market trades at roughly P/E 28.4 and CAPE ~38.6 in late 2025.
Fewer than a dozen companies globally have share prices exceeding $1 million or equivalent when converted in 2025.
Conclusion
The world of the most expensive stocks by country shows both familiar patterns and evolving dynamics. While legacy names like Berkshire Hathaway dominate the high-unit-price category, shifts in market structure, access methods such as fractional shares, and global investor behavior are expanding the phenomenon. Valuation metrics such as P/E and CAPE remain elevated, making the environment more sensitive to economic and currency shifts. For investors examining high-price shares, the focus must go beyond just the headline share price; corporate policy, float, international access, and structural market factors matter just as much. We invite you to use this data-rich overview as a foundation and explore how “expensive stock” definitions may evolve in the coming months.


