Mobile commerce has reshaped the global retail landscape, capturing over half of online sales and transforming consumer behavior. In the U.S., it now drives a significant portion of retail e‑commerce revenue. From boosting convenience with one‑click payments to powering app-based shopping, mobile commerce affects industries like fashion and grocery every day. Two scenarios illustrate its impact: a clothing brand launching a new app to capture app‑preferential users, and a grocery chain integrating mobile payment at the checkout lane to reduce cart abandonment. Explore the full article to understand how mobile commerce continues evolving.
Editor’s Choice
- 59% of global retail e‑commerce sales will come from mobile in 2025, totaling about $4.01 trillion.
- Mobile commerce revenue is projected to hit $4.9 trillion and $6.5 trillion by year-end.
- In the U.S., mobile retail e‑commerce sales are estimated at $564 billion in 2024, rising toward $710 billion in 2025.
- 72.9% of all e‑commerce sales globally will be via mobile by 2024.
- Average mobile conversion rate: 2.85% as of October 2024, highest in the past year.
- The global average e‑commerce cart abandonment rate is about 70%, with mobile abandonment typically ranging from 76–79%.
- 70–73% of online shoppers prefer mobile apps over mobile websites.
Recent Developments
- Mobile will account for 52.5% of U.S. online sales during Prime Day 2025.
- Mobile shopping adoption continues surging, with 1 billion+ people in the U.S. having made at least one mobile purchase.
- Mobile wallets account for about 54–60% of global digital transactions, with adoption led by Asia‑Pacific markets such as China and India.
- 5G subscriptions are expected to reach 1.7 billion globally by the end of 2025, improving mobile network performance.
- Global eCommerce apps generate over 40 billion hours of user engagement per year, with some estimates placing total shopping‑app time above 100 billion hours when factoring in all retail categories.
- Retailers are prioritizing mobile-optimized checkout flows due to rising mobile cart abandonment (up to 80%).
- Intuitive UX design improvements in mobile apps have shown statistically significant uplifts in retention and conversions.
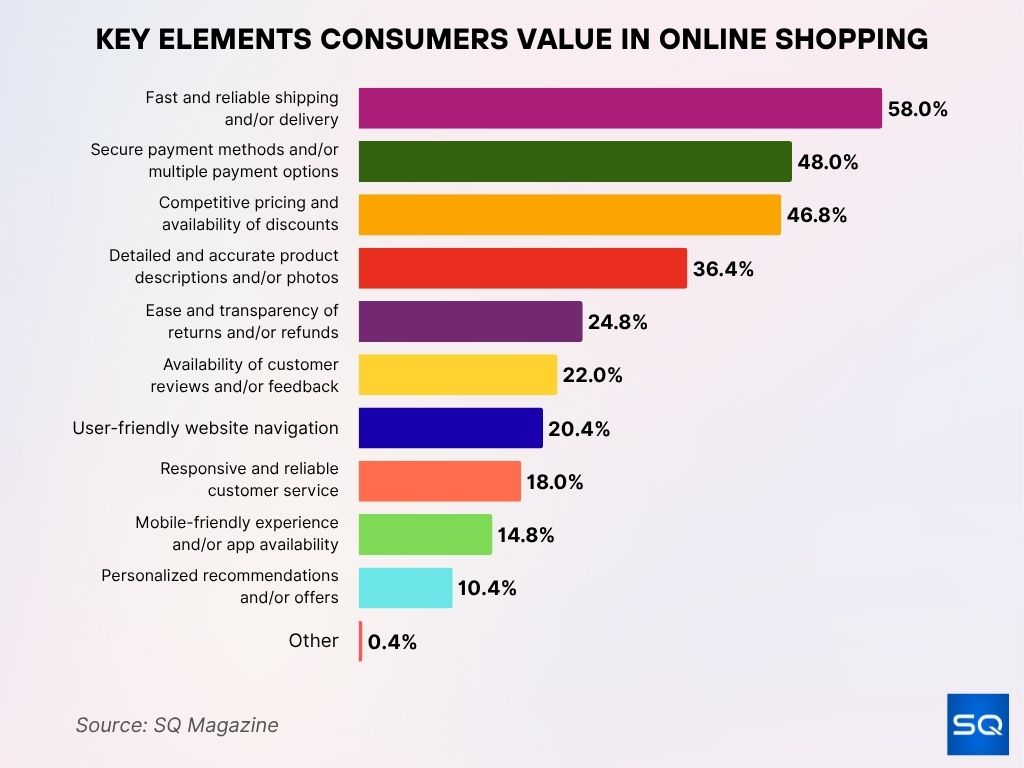
Key Elements Consumers Value in Online Shopping
- Fast and reliable shipping/delivery is the top priority for 58% of shoppers.
- 48% want secure payment methods and multiple payment options.
- 46.8% look for competitive pricing and availability of discounts.
- 36.4% value detailed, accurate product descriptions and high-quality photos.
- 24.8% prioritize easy and transparent returns/refunds.
- 22% seek customer reviews and feedback before purchasing.
- 20.4% prefer user-friendly website navigation.
- 18% expect responsive and reliable customer service.
- 14.8% want a mobile-friendly experience or app availability.
- 10.4% appreciate personalized recommendations and offers.
- Only 0.4% mentioned other factors.
Global Mobile eCommerce Market Overview
- Global mobile commerce revenue is projected to reach between $4.9 trillion and $6.5 trillion by 2025, with the higher estimate reflecting optimistic growth scenarios.
- Mobile commerce is anticipated to account for 75% of all e‑commerce by 2025.
- By 2025, between 1.5 and 1.7 billion people are expected to make purchases via mobile, representing roughly 30% of the world’s internet users.
- Global smartphone users are expected to number around 4.9 billion in 2025, representing about 60% of the global population.
- China accounts for around half of global e‑commerce sales, though the exact share fluctuates between 48% and 52% depending on the source and year.
- The global mobile commerce market is expanding rapidly, with a compound annual growth rate (CAGR) projected at 20–25% through 2025.
- U.S. mobile commerce sales are expected to grow by more than 50% over two years, from 2023 to 2027.
Mobile vs Desktop eCommerce Statistics
- 72.9% of e‑commerce sales in 2024 were via mobile, compared to desktop at around 27%.
- Mobile traffic accounts for 60–70% of all e‑commerce site visits, and desktop makes up the rest.
- The average mobile conversion rate is 2.85%, versus 3.9% on desktop.
- Mobile conversions remain lower despite higher traffic volume; desktop sites convert better per visit.
- Conversion trend, mobile conversion rates peaked during the Nov–Dec holiday season at 3.83%.
- Cart abandonment on mobile reaches 80.2%, compared to desktop, around 70%.
- Mobile cart abandonment continues to outpace desktop due to UX friction and extra fees.
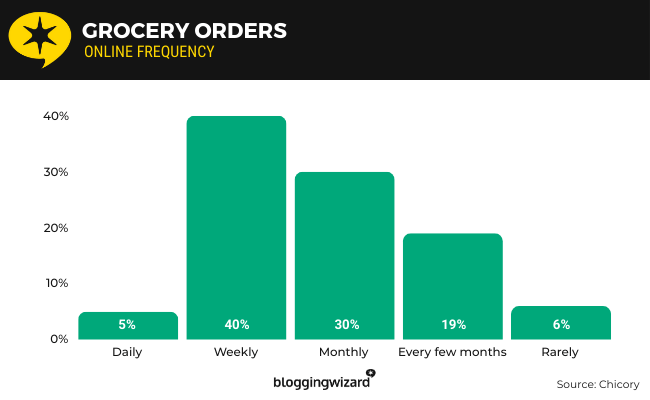
Online Grocery Order Frequency
- Only 5% of consumers order groceries daily.
- 40% place weekly online grocery orders, making it the most common frequency.
- 30% prefer ordering monthly.
- 19% shop online for groceries every few months.
- Just 6% order groceries online rarely.
Share of Mobile in Total eCommerce Sales
- Mobile commerce is expected to compose 59% of all retail e‑commerce sales in 2025 ($4.01 trillion).
- Some estimates place mobile share even higher at 75% by end‑2025, depending on the reporting source.
- In the U.S., mobile commerce makes up 38% of digital spending and is fast approaching half of total e‑commerce sales.
- Retail revenue via mobile in the U.S. is expected to reach $710 billion in 2025.
- The global mobile shopper base is 30% of the global digital population (~1.5 and 1.7 billion users).
- Mobile app sessions now make up over 41.9 billion hours per year globally.
- Mobile conversion rates have climbed 30% over two years, signaling improved mobile sales efficacy.
Mobile Commerce Demographics
- 46.9% of U.S. mobile e‑commerce shoppers are aged 18–24, and 31.8% are aged 25–34.
- 92% of Americans aged 30–49 regularly use smartphones for online shopping, 49% shop at least weekly.
- For ages 18–29, 87% shop via mobile regularly, with 38% shopping weekly.
- Older groups lag; only 48% of those 65+ use smartphones for shopping, and just 11% do so weekly.
- Higher-income households (>$100K) in the U.S. are twice as likely to own multiple devices and show greater mobile usage than those under $30K.
- Young adults under 40 use fintech and mobile wallets at ~40%, versus <25% for those over 60.
- In emerging markets, roughly 70% of mobile commerce users are under age 25, indicating strong youth dominance in Asia-Pacific.
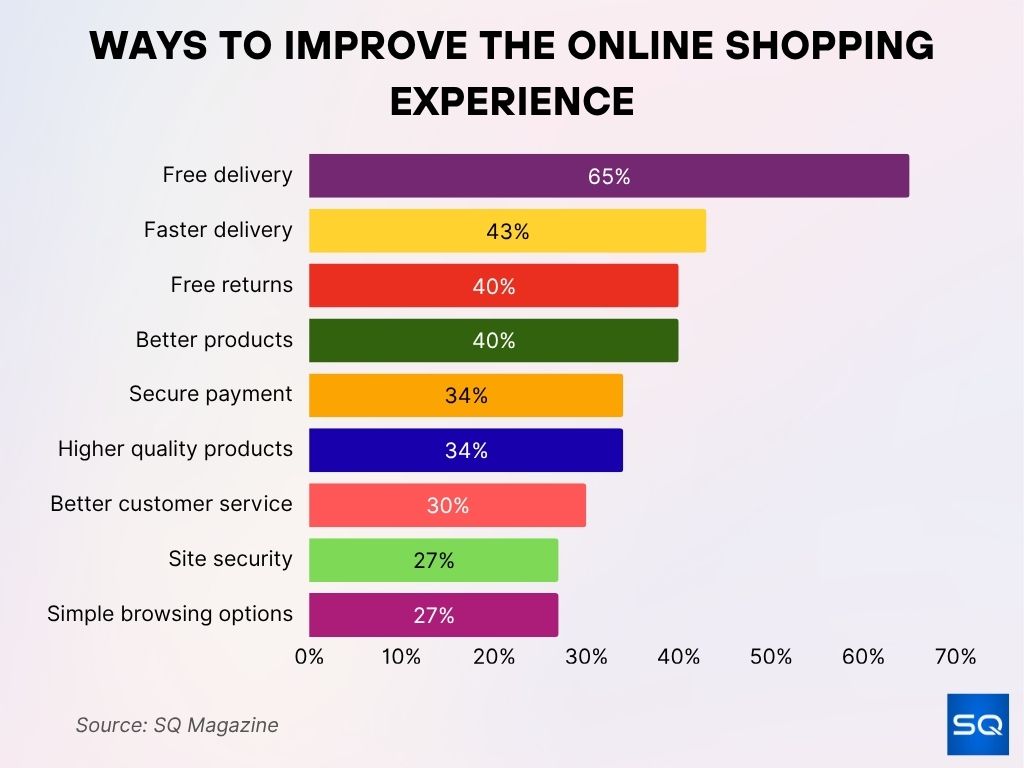
Ways to Improve the Online Shopping Experience
- 65% of shoppers say free delivery would enhance their experience the most.
- 43% want faster delivery options.
- 40% value free returns for easier product exchanges.
- 40% seek better product quality.
- 34% prefer secure payment systems.
- 34% desire higher quality products overall.
- 30% believe better customer service would improve their shopping journey.
- 27% emphasize the need for strong site security.
- 27% want simpler browsing options for easier navigation.
Consumer Mobile Shopping Behavior
- About 30% of the global digital population (~between 1.5 and 1.7 billion users) will make mobile purchases in 2025.
- In the U.S., more than 180 million people have bought via mobile.
- Over 60% of internet traffic now comes from mobile devices.
- Retail mobile commerce captures 38% of digital spending in the U.S. in 2025.
- Consumers spend over 41.9 billion hours/year using shopping apps globally.
- During Cyber Week, more than half of all online sales come through mobile devices.
- Mobile apps outperform mobile web in user engagement and browsing time.
Mobile App Usage for Online Shopping
- Shopping apps generate more than 41.9 billion hours per year globally.
- Native apps deliver twice the conversion rates compared to mobile web environments.
- Average order values tend to be higher in mobile apps versus mobile websites, thanks to seamless UX and personalization.
- Consumers demonstrate higher loyalty and repeat usage in app environments.
- Push notifications in apps boost repeat visits and purchases by ~20–30%.
- Brands are investing more in app-based loyalty and reward programs to retain mobile users.
- Mobile app users remain engaged longer, averaging several minutes per session versus less than a minute for mobile web.
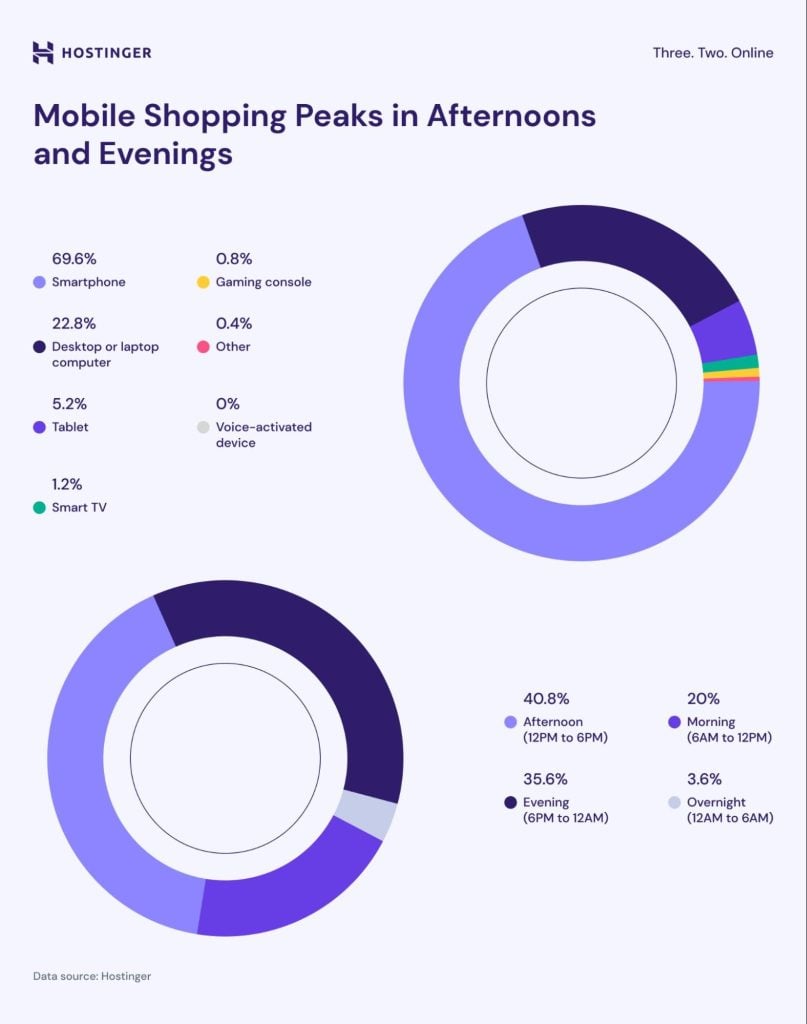
Mobile Shopping Device Usage and Peak Times
- 69.6% of online shoppers use smartphones, while 22.8% shop via desktop/laptop.
- 5.2% shop using a tablet, and 1.2% use a smart TV.
- 0.8% shop via gaming consoles, 0.4% use other devices, and 0% use voice-activated devices.
- Shopping peaks in the afternoon (12 PM–6 PM) with 40.8% of activity.
- 35.6% shop in the evening (6 PM–12 AM).
- 20% shop in the morning (6 AM–12 PM).
- Only 3.6% shop overnight (12 AM–6 AM).
Conversion Rates on Mobile Devices
- Global mobile conversion rate averages around 2.8%, compared to 3.9% on desktop.
- Conversion surges during holidays, mobile rates can peak to ~3.8% in Nov–Dec.
- Conversion improved roughly 30% over two years due to better UX and payment flows.
- Mobile apps typically double the conversion rate of mobile sites.
- Brands optimizing checkout UX see as much as 35% uplift in conversions.
- Millennials tend to abandon carts more, yet may convert later via push-triggered reminders.
- Younger demographics drive higher mobile conversion through shorter sessions and faster decision-making.
Mobile Cart Abandonment Statistics
- The average global e‑commerce cart abandonment rate stands at 70.19% in 2025.
- Mobile abandonment rates climb higher, 85.65% on mobile versus 69.32% on desktop.
- Mobile checkout abandonment can be 10–15 percentage points higher if forms aren’t responsive or optimized.
- Unexpected extra costs cause 48% of shoppers to leave their cart.
- Luxury/jewelry carts see the highest abandonment (81.7%), fashion around 76%.
- Slow delivery or site glitches trigger 23% abandonment in some categories.
- Checkout UX and optimized payment flows can reduce abandonment by up to 35%.
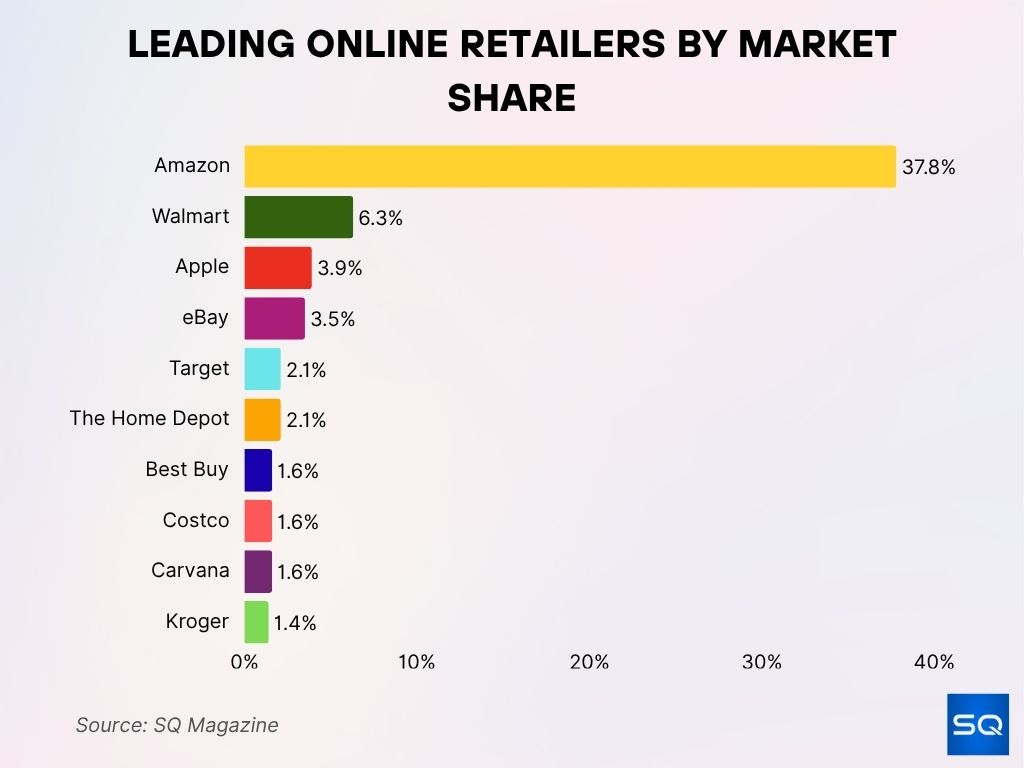
Leading Online Retailers by Market Share
- Amazon dominates the market with a massive 37.8% share.
- Walmart holds the second spot with 6.3%.
- Apple follows with 3.9%, and eBay closely trails at 3.5%.
- Both Target and The Home Depot share 2.1% each.
- Best Buy, Costco, and Carvana each hold a 1.6% market share.
- Kroger rounds out the top 10 with 1.4%
Mobile Payment & Digital Wallet Adoption
- In China, WeChat Pay and Alipay control over 90% of the mobile payment market share.
- Across Asia-Pacific, digital wallets now handle roughly 60% of online purchase volume.
- India’s mobile payment user base is expected to grow from 160 million in 2020 to 800 million by 2025, reaching over $1 trillion in annual value.
- Open banking and A2A transfers rise by ~29% annually, fueling regional cross-border e‑commerce.
- In the Philippines, GCash counts over 81 million active users and integrates with global merchants.
- Device-based payment now drives 60% of digital transactions globally.
- Mobile payments psychologically increase willingness to pay and boost average order value vs. cash or card payments.
Regional Trends & Market Penetration
- Asia-Pacific leads mobile commerce growth, and China alone accounts for 48% and 52% of global e‑commerce sales.
- India’s digital economy is projected to exceed $1 trillion by 2030, powered by mobile-first behavior in 800 million users.
- Southeast Asia shows strong mobile wallet traction, with GrabPay, GCash, and QRIS adoption spreading rapidly.
- Latin America’s digital payments revenue is expected to triple to $300 billion by 2027, with wallets and transfers dominating.
- Europe favors local payment solutions, iDEAL in the Netherlands (~80% of e‑commerce), Sofort, and BNPL rising across Germany and Scandinavia.
- In Japan and South Korea, mobile wallets like PayPay and KakaoPay capture between 55M–62M users, supporting cross-border mobile commerce.
- Mobile infrastructure and smartphone adoption gaps remain in low-income and rural regions, limiting mobile e‑commerce reach.
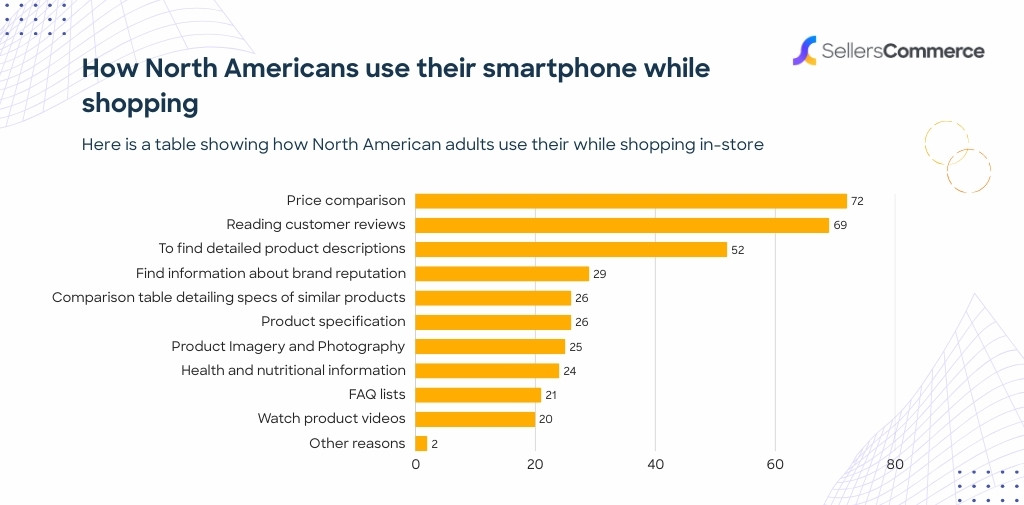
How North Americans Use Smartphones While Shopping
- 72% use smartphones for price comparison while shopping in-store.
- 69% read customer reviews before making a purchase.
- 52% search for detailed product descriptions.
- 29% look up a brand’s reputation.
- 26% check comparison tables for similar products.
- 26% review product specifications.
- 25% browse product imagery and photography.
- 24% research health and nutritional information.
- 21% consult FAQ lists.
- 20% watch product videos.
- Only 2% shop for other reasons.
Impact of Mobile UX on eCommerce
- 88% of mobile eCommerce apps score “mediocre” or worse on user experience, driving user drop-off.
- 57% of users won’t recommend a site with poor mobile UX.
- If a mobile page takes more than 3 seconds to load, approximately 53% of visitors leave before engaging.
- Strong UX can boost eCommerce conversion rates by up to 400%.
- Around 74% of users are inclined to return to sites that deliver a good mobile experience.
- 90% of smartphone users are more likely to complete purchases when mobile UX is seamless.
- Customers who have a negative mobile UX are 62% less likely to purchase from that brand again.
- Across top sites, 81% of mobile ecommerce performance scores fall into the “mediocre or worse” category.
Mobile Device Preferences (Smartphone vs Tablet)
- Smartphones lead the device mix; they account for ~59% of global web traffic, tablets just around 1.5%, and desktops the remainder.
- Tablet usage is roughly half as widespread as smartphone usage in most markets.
- In Gen Z, smartphones serve nearly all mobile shopping needs, and tablets are secondary or for media consumption.
- Android dominates mobile devices with 72% global market share, and iOS holds ~28%.
- Over 96% of internet users access the web using a mobile phone.
- Apps surpass web usage; users spend ~100 billion hours annually in mobile commerce apps versus minimal browsing time.
- Tablet conversion rates remain lower than smartphone and desktop due to less optimized layouts and lower usage frequency.
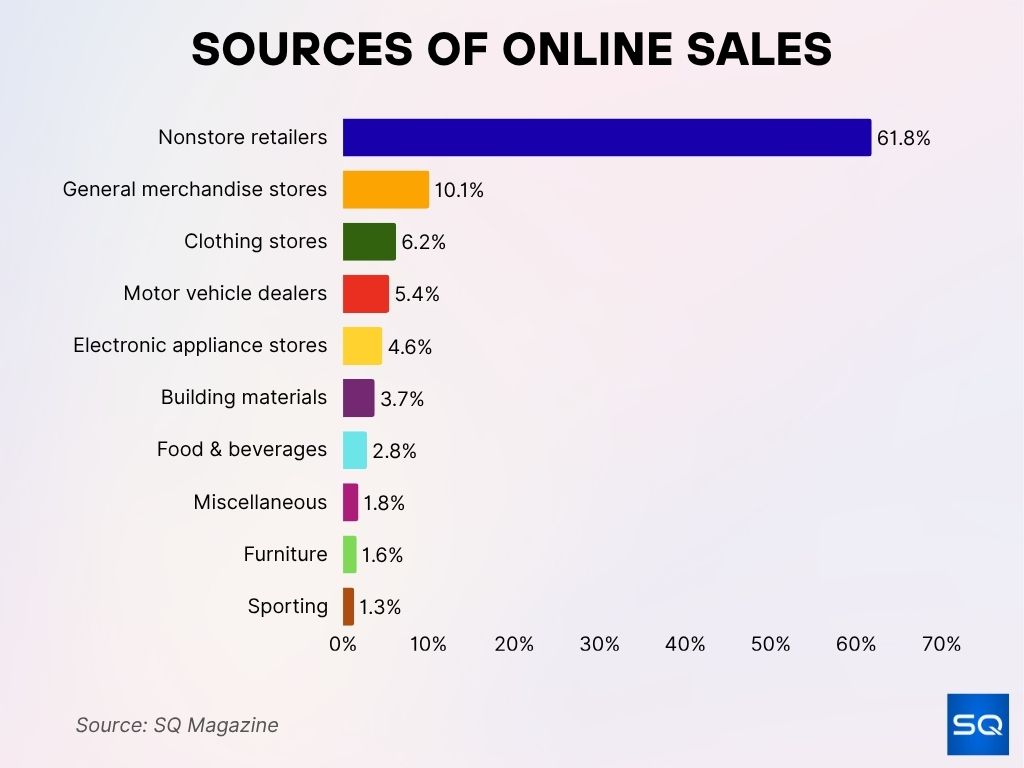
Sources of Online Sales
- 61.8% of online sales come from nonstore retailers, the dominant category.
- 10.1% are from general merchandise stores.
- 6.2% originate from clothing stores.
- 5.4% are from motor vehicle dealers.
- 4.6% come from electronic appliance stores.
- 3.7% are from building materials retailers.
- 2.8% come from food and beverage sales.
- 1.8% are classified as miscellaneous sales.
- 1.6% come from furniture retailers.
- Only 1.3% are from sporting goods stores.
Reasons for Choosing Mobile Shopping
- Convenience and speed remain top motivators; mobile shopping supports impulse purchases instantly.
- Push notifications, app personalization, and loyalty tools drive app-based repeat shopping.
- Mobile shoppers report higher trust in brands offering digital wallets and one-click checkout.
- Around 70–73% of online shoppers say they prefer mobile apps to mobile websites, citing faster load times, convenience, and better personalization.
- Integrated payment methods like Apple Pay and Google Pay drive trust and reduce checkout friction.
- Mobile-first consumers value strong rewards integration, and apps often offer better loyalty experiences.
- Real‑time offers, flash sales timed to mobile behavior increase conversion and reduce cart abandonment.
Mobile Commerce During Holidays & Events
- Over 50% of online sales during Cyber Week now occur via mobile devices.
- Peak holiday mobile conversion rates reach ~3.8% in Nov–Dec, compared to annual mobile averages of ~2.8%.
- Mobile traffic and sales spike more than desktop during major events like Prime Day, Black Friday, and Amazon’s holiday deals.
- Retailers report up to a 60% increase in app usage during major shopping events.
- Mobile abandonment drops during holidays, thanks to streamlined app checkout and saved payment details.
- Mobile push campaigns drive significantly higher revenue when tied to limited-time promotions.
Mobile Commerce App Revenue & Engagement
- Shopping apps generate over 41.9 billion hours/year globally.
- 70–73% of shoppers prefer apps over mobile sites, largely for ease and performance.
- Native apps offer twice the conversion rates of mobile websites and a higher average order value.
- Push notifications raise repeat purchase rates by ~20–30%, elevating engagement.
- App users tend to stay engaged longer per session, improving cross-sell and upsell metrics.
- Brands investing in loyalty-based app content see higher annual spend per user (~$2,500/year).
- Global app revenue from mobile commerce continues to climb, contributing the majority share of mobile sales.
Challenges in Mobile eCommerce
- Poor UX leads to an average loss of 35% in sales, translating into billions lost annually.
- Mobile UX issues, integration hurdles, and limited customer support remain common implementation barriers.
- 42% of consumers cite security concerns as a barrier to mobile purchases.
- A quarter of e-commerce platforms leak personal data to third parties, raising privacy concerns.
- Uneven mobile internet access, especially costly in low-income regions, limits global inclusion, and women in developing countries face a 15% gap.
- 88% of apps perform under expectations, and 57% of users won’t return after a poor mobile experience.
- Integrating across platforms, optimizing for diverse devices, and supporting legacy systems remain persistent pain points for retailers.
Conclusion
Mobile commerce has firmly established itself as the dominant force in global e-commerce by 2025, accounting for more than half of all online sales. As consumers increasingly prefer apps and seamless mobile experiences, conversion and engagement rise accordingly. Yet widespread issues in UX, privacy, and access continue to hinder performance in key markets. Businesses that prioritize intuitive, fast, and secure mobile experiences position themselves for sustained growth. The data today makes clear, mobile is not optional, it’s essential.


