It wasn’t that long ago when downloading a mobile app felt like a novelty. Now, it’s as routine as brushing your teeth. Whether it’s managing finances, booking travel, or tracking health goals, mobile apps have become deeply embedded in daily life. And in 2025, the numbers show just how far this digital frontier has come. From record-breaking downloads to surprising user behaviors, the mobile app ecosystem is evolving faster than ever, redefining how we live, work, and connect.
Editor’s Choice
- The global mobile app market is projected to reach $935 billion in revenue by the end of 2025.
- As of Q2 2025, users download an average of 9.2 apps per month globally.
- TikTok, Instagram, and CapCut are among the most downloaded apps in early 2025.
- Mobile gaming apps are now responsible for nearly 49% of total app store revenue.
- The average American spends 4 hours and 52 minutes per day on mobile apps in 2025.
- 5G connectivity has expanded to over 72% of global smartphone users, fueling richer app experiences.
- Subscription-based apps have seen a 15.8% year-over-year growth in user spending by mid-2025.
Most Installed Apps
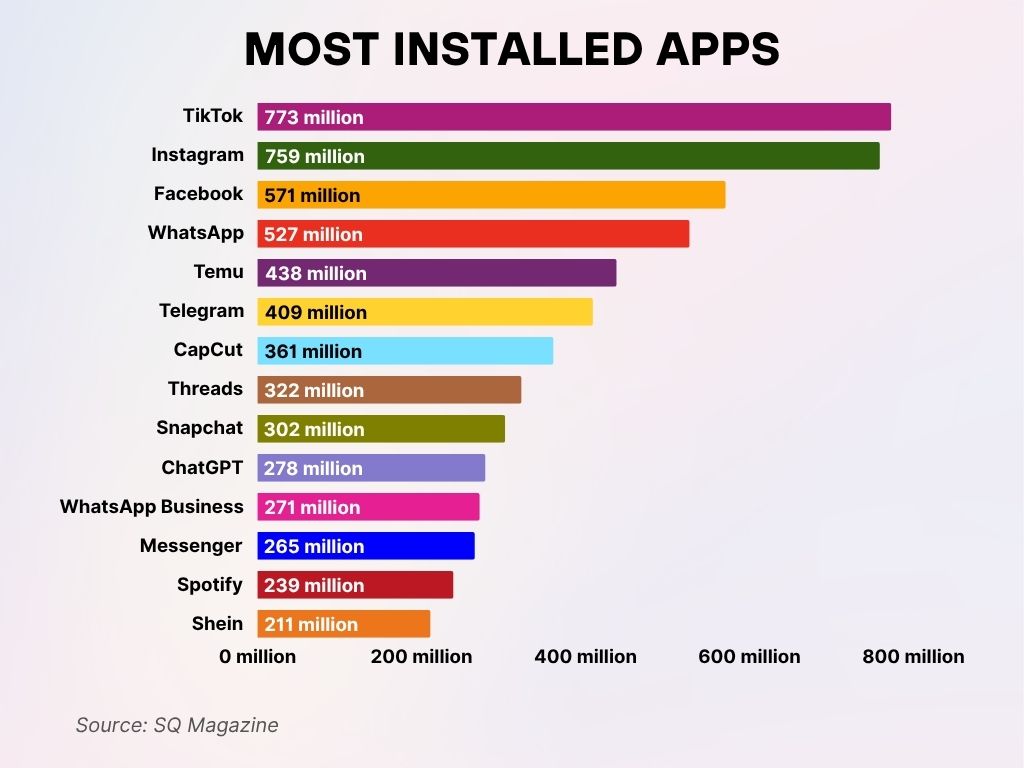
- TikTok leads the chart with a massive 773 million installs, solidifying its dominance in short-form video content.
- Instagram follows closely with 759 million installs, proving its ongoing popularity among photo and story-sharing users.
- Facebook remains strong with 571 million installs, reflecting its enduring relevance across generations.
- WhatsApp recorded 527 million installs, showing its continued role as a leading global messaging app.
- Temu, a rising e-commerce app, saw 438 million installs, marking rapid global expansion and user acquisition.
- Telegram reached 409 million installs, driven by its privacy-focused messaging features and growing user trust.
- CapCut, the video editing tool from TikTok’s parent company, achieved 361 million installs, thanks to content creator demand.
- Threads gained 322 million installs, demonstrating Meta’s success in introducing Twitter-like alternatives.
- Snapchat accumulated 302 million installs, maintaining its influence among younger demographics with AR and chat features.
- ChatGPT saw 278 million installs, highlighting the rapid consumer adoption of AI-powered tools.
- WhatsApp Business recorded 271 million installs, showing strong adoption among SMEs and service providers.
- Messenger, Facebook’s standalone chat app, reached 265 million installs, proving its continued utility.
- Spotify saw 239 million installs, underlining its dominance in music streaming across devices.
- Shein had 211 million installs, reflecting its fast-fashion appeal and massive reach in online retail.
Global Mobile App Market Size and Growth Rate
- The total market size of mobile apps is forecasted to hit $935 billion by the end of 2025.
- App usage worldwide has increased by 11.3% year-over-year, driven by emerging markets and increased digital adoption.
- The Asia-Pacific region accounts for 57% of all app downloads in 2025, with India and Southeast Asia leading growth.
- The number of active app developers worldwide surpassed 7.8 million in early 2025.
- Average revenue per app download has increased to $0.74.
- App downloads globally are expected to surpass 305 billion in 2025.
- The enterprise mobile app market is expected to exceed $150 billion, as remote and hybrid work models persist.
- In-app purchases account for 39% of total app revenue.
- Latin America saw the fastest revenue growth year-over-year at 13.6%, driven by fintech and mobile commerce apps.
- The average app development cost has risen to $52,000 in 2025, due to complexity and design demands.
User Engagement Trends Across App Categories
- Average daily time spent on mobile apps hit 4.9 hours globally in 2025.
- Gaming, social media, and streaming apps account for 72% of all time spent on mobile.
- The average session length per user has increased to 18.5 minutes per app.
- In 2025, users open mobile apps an average of 35 times per day.
- Push notification opt-in rates fell slightly to 38%, indicating growing user fatigue.
- Gen Z users spend 21% more time on education and productivity apps than other age groups.
- Streaming apps (e.g., Netflix, Disney+) saw a 9.3% increase in average session time year-over-year.
- Mobile shopping app usage surged 13% during Q1 seasonal sales in 2025.
- Apps with gamified UX features retain 23% more active users than non-gamified counterparts.
- Fitness tracking apps have a weekly engagement rate of 43%, with spikes around January and June.
Mobile Browser vs. Mobile App Conversion Rates
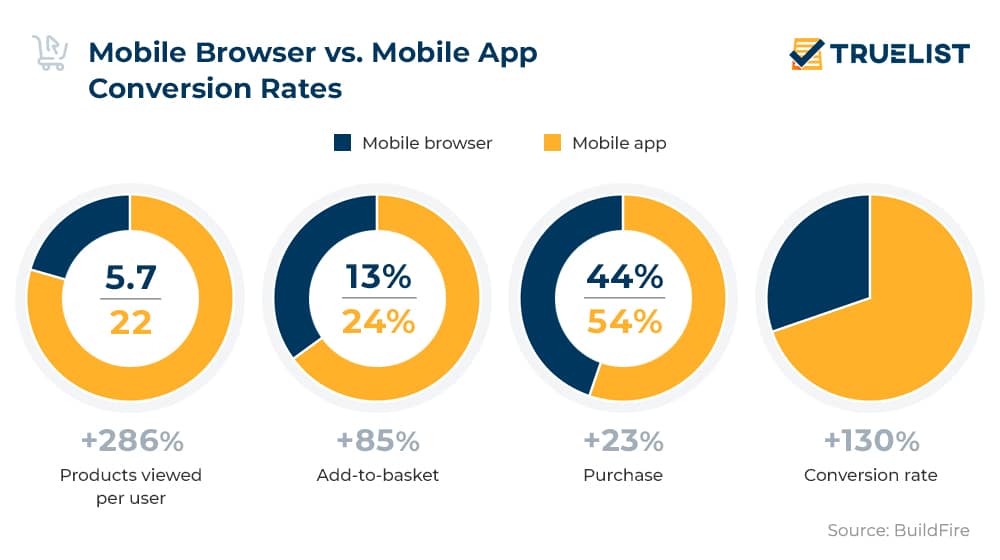
- Products Viewed per User: Mobile app users view 22 products, compared to just 5.7 via mobile browsers, a +286% increase.
- Add-to-Basket Rate: Apps drive more intent, with 24% of users adding items to their cart versus 13% on browsers, a boost of +85%.
- Purchase Rate: Conversion to purchase is higher on apps at 54%, compared to 44% on browsers, reflecting a +23% increase.
- Overall Conversion Rate: Mobile apps outperform browsers by +130%, highlighting their superior efficiency in driving actions.
Mobile App Revenue Statistics by Region
- The United States leads global mobile app revenue, projected to generate $178 billion in 2025.
- China follows with expected app revenue of $154 billion, thanks to dominance in gaming, social commerce, and utility apps.
- India is forecasted to surpass $12 billion in app revenue in 2025.
- The Middle East and Africa saw a 13% year-over-year growth, mainly due to increased mobile payment and fintech app adoption.
- In Europe, Germany, France, and the UK combined will generate over $89 billion in app revenue by the end of 2025.
- Latin America is growing fast, with app revenue predicted to reach $10.8 billion, led by mobile commerce and remittance platforms.
- Japan’s app revenue, while plateauing, remains strong at $41 billion, largely from mobile games and eBook services.
- Average revenue per user (ARPU) in North America is expected to reach $58.30 in 2025.
- Russia and Eastern Europe show resilience with a 7.9% increase in spending despite regulatory constraints.
- Mobile app ad revenue globally is anticipated to hit $460 billion, with 56% coming from the Asia-Pacific region.
Retention and Churn Rates in Mobile Apps
- The average 30-day retention rate across all app categories is 27% in 2025.
- Fitness and health apps show the highest retention at 34%, especially among users aged 25–39.
- Mobile gaming apps continue to face the highest churn, with 76% of users dropping off after day 7.
- Finance and banking apps enjoy strong retention, with over 41% of users still active after 30 days.
- The average churn rate for mobile apps in 2025 is 72% within the first 3 days of download.
- Apps that offer personalized onboarding have a 22% lower churn rate than those with generic user flows.
- Retention is significantly higher in subscription-based apps, averaging 38% at day 30.
- The use of push notifications can increase day-7 retention by up to 14%, but results vary by category.
- Apps that implement in-app surveys and feedback loops show 11% better week-one retention.
- Lifestyle apps like journaling and meditation tools report retention rates around 29%.
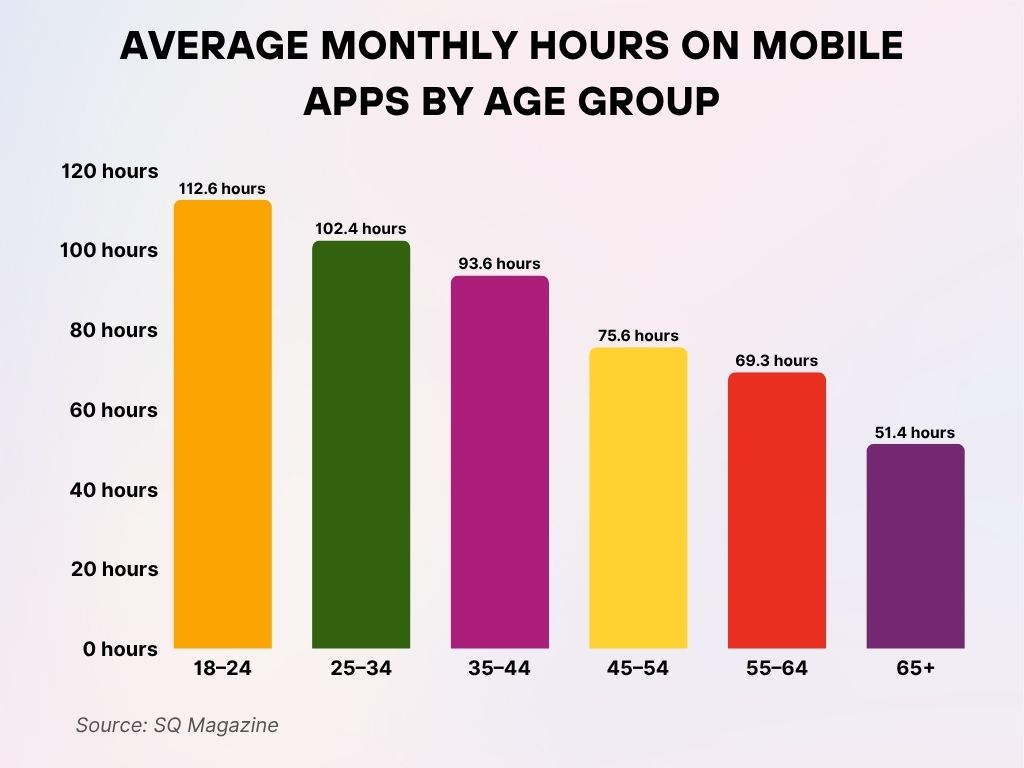
Average Monthly Hours on Mobile Apps by Age Group
- Young adults aged 18–24 spend the most time on mobile apps, averaging 112.6 hours per month per user.
- Users aged 25–34 follow closely with 102.4 hours monthly, showing high mobile engagement in early career and social life stages.
- The 35–44 age group averages 93.6 hours, reflecting strong usage even among busy professionals and parents.
- Middle-aged users (45–54) log 75.6 hours, still maintaining notable mobile activity across entertainment and utility apps.
- Older adults aged 55–64 spend 69.3 hours monthly, showing a gradual decrease in mobile app dependence.
- Seniors 65 and older use mobile apps the least, with an average of 51.4 hours per month, indicating lower digital interaction in this group.
Growth of Mobile Gaming Apps
- In 2025, mobile gaming revenue is expected to hit $168 billion, accounting for 49% of total app revenue.
- Casual games remain dominant, representing 60% of all game downloads globally.
- Hyper-casual games like puzzle and runner games retain users for an average of 5.8 days.
- In-app purchases in gaming apps grew 13% year-over-year, especially in multiplayer strategy and fantasy games.
- Live-ops events and seasonal content have become standard in top-performing games, boosting daily active users by 18%.
- AR and VR-enhanced games have seen an adoption rate increase of 22% in North America and Western Europe.
- eSports-integrated mobile apps have gained traction, particularly in Southeast Asia, contributing $5.2 billion in revenue.
- Games with cross-platform syncing (e.g., mobile-to-PC) report 27% longer average session durations.
- The average user spends $87 annually on mobile games in the US, while in South Korea, it’s nearly $110.
- Games using AI for dynamic difficulty or storytelling saw a 19% lift in user retention across 2025.
Impact of 5G and AI on App Usage Growth
- As of mid-2025, 5G is accessible to 72% of smartphone users, accelerating app load times and streaming quality.
- Apps leveraging AI for personalization, recommendations, and automation are seeing 2.5x higher engagement rates.
- AI-powered productivity apps have grown 31% year-over-year, driven by remote work and education.
- Gaming apps optimized for 5G report a 40% reduction in latency, significantly improving multiplayer experiences.
- Voice-powered apps, enhanced by natural language processing (NLP), have seen a 17% rise in downloads in 2025.
- AR-based apps in retail and real estate are growing fast, with engagement time increasing by 22%.
- AI in health apps, especially those offering predictive health insights, has doubled in active user base since last year.
- Streaming apps with AI-driven content curation report a 19% improvement in watch time per session.
- Developers are increasingly using AI for app testing and QA, reducing time-to-market by 18%.
- Edge computing, paired with 5G, has led to 26% faster response times for high-interaction apps.
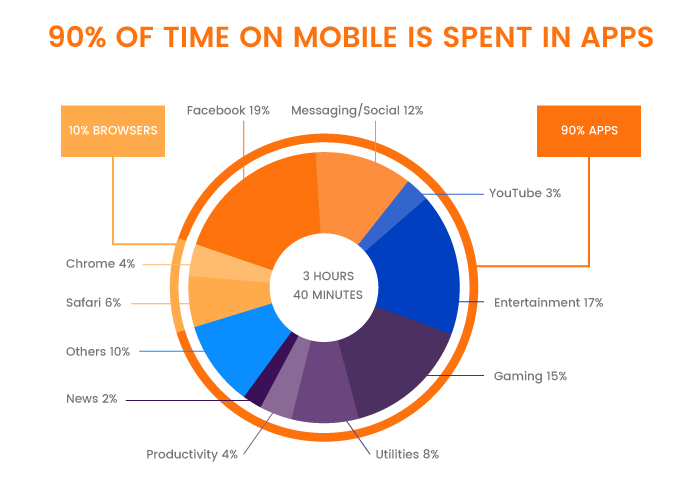
Mobile Usage Breakdown: Time Spent in Apps vs. Browsers
- 90% of mobile time is spent in apps, while only 10% is spent in browsers, showing a clear user preference.
- On average, users spend 3 hours and 40 minutes daily on their mobile devices.
- Facebook accounts for the largest share among apps, consuming 19% of total mobile time.
- Entertainment apps like streaming platforms take up 17% of user time.
- Gaming apps follow with a solid 15%, proving their popularity across age groups.
- Messaging/Social apps (excluding Facebook) make up 12%, highlighting real-time communication habits.
- Utilities such as calendars and weather apps use 8% of time.
- Productivity tools (e.g., notes, emails) account for 4%, while news apps only occupy 2%.
- YouTube individually holds a 3% share, despite being one of the largest video platforms.
- Other browsers include Safari (6%) and Chrome (4%), comprising most of the 10% browser share.
- Miscellaneous apps make up the remaining 10%, reflecting varied niche app use.
Mobile App Advertising Revenue Trends
- Global in-app ad revenue is projected to reach $460 billion in 2025.
- Video ads account for nearly 48% of total in-app ad formats due to higher click-through and engagement rates.
- Rewarded video ads in gaming apps show a 26% engagement uplift compared to static ads.
- eCPMs (effective cost per mille) for mobile ads rose by 9.3% globally, with North America having the highest average at $14.70.
- Interstitial ads perform best in casual games, driving 4.6% conversion rates in 2025.
- Contextual advertising is gaining traction amid privacy concerns, leading to a 19% growth in usage.
- AI-based ad targeting boosts ROAS (return on ad spend) by an average of 22%, especially in shopping and utility apps.
- Apps using programmatic advertising report 34% more revenue efficiency than direct deals.
- Mobile commerce apps saw a 27% increase in ad spend from major retail brands.
- App install ads remain the leading campaign objective for mobile marketers, accounting for 38% of total ad budgets.
Subscription-Based App Growth
- Global consumer spending on subscription apps will exceed $190 billion in 2025.
- Health and wellness apps lead subscription growth, making up 23% of total consumer spend.
- Productivity and AI tools (e.g., AI writing assistants, task managers) saw 19% YoY revenue growth from subscriptions.
- The average user subscribes to 2.4 paid apps in 2025.
- Streaming services maintain high conversion rates, with 62% of trial users converting to paid plans.
- Auto-renewal cancellation rates dropped to 12.3%, thanks to improved onboarding and user engagement tactics.
- Paywall optimization increased subscription conversions by up to 28% for top-performing apps.
- Educational apps saw subscription revenue rise by 21%, with language learning and coding apps in high demand.
- Apps offering bundled subscriptions (e.g., multiple features or services) report 19% higher customer lifetime value (CLV).
- Average monthly subscription pricing for US-based apps is now $7.40.
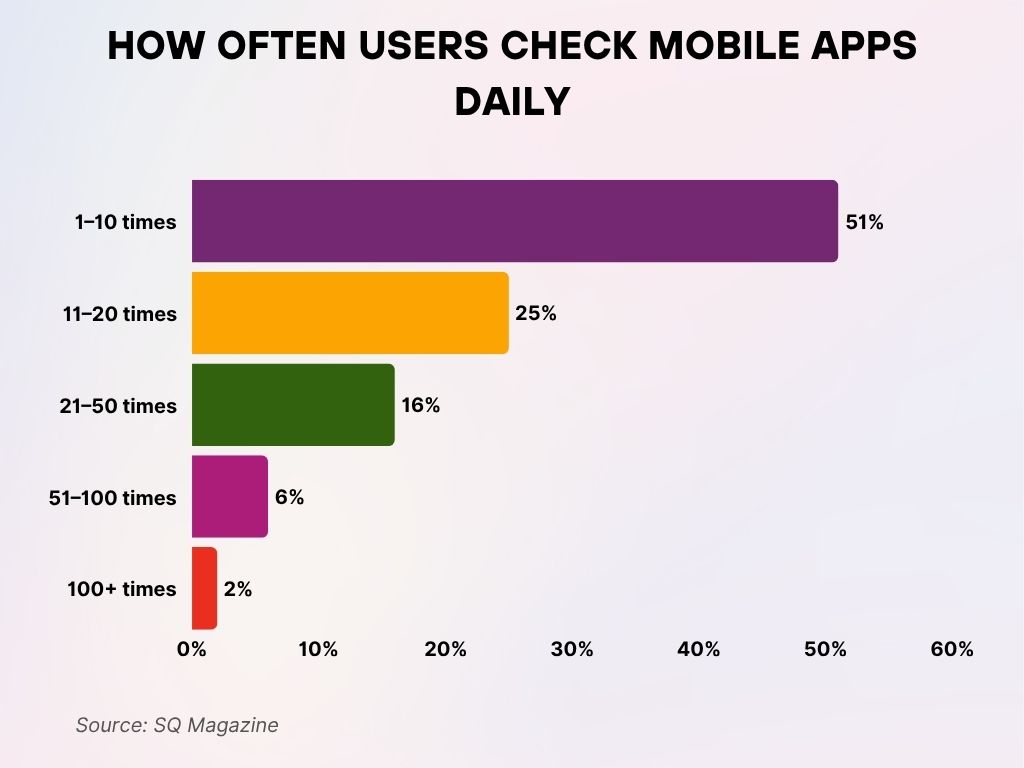
How Often Users Check Mobile Apps Daily
- 51% of users check their mobile apps 1–10 times per day, making this the most common app usage frequency.
- 25% of users open apps 11–20 times daily, reflecting moderately engaged users with regular habits.
- 16% of users fall into the 21–50 times daily range, indicating a strong reliance on mobile apps throughout the day.
- 6% of users access apps 51–100 times a day, showing heavy usage patterns often tied to messaging, social, or work-related tools.
- A small 2% of users open apps more than 100 times daily, highlighting a hyper-engaged or possibly app-dependent user segment.
Regional Insights: Fastest-Growing App Markets
- India leads in 2025 in download volume growth, with a projected 36.5 billion app installs.
- Indonesia, the second-fastest growing market, has seen a 14.7% rise in mobile app usage, particularly in fintech and edtech.
- Brazil and Mexico are emerging as Latin America’s mobile-first economies, with a combined app revenue forecast of $9.2 billion.
- Vietnam saw a 17% increase in game app downloads year-over-year, reflecting a booming youth market.
- In Africa, Nigeria and South Africa are witnessing double-digit growth in healthtech and mobile payment apps.
- Turkey is now one of Europe’s fastest-growing mobile markets, with a 13.9% rise in new app publishers in 2025.
- Egypt‘s mobile app penetration has increased by 9.8%, driven by digital banking and utility apps.
- The Philippines has become a major market for video-sharing and content creation apps, with a 12.6% growth in creator-based platforms.
- In Eastern Europe, Ukraine is showing strong adoption in productivity apps despite infrastructure challenges, with installs up 15%.
- Bangladesh reached a milestone of over 140 million active mobile users, with localized app ecosystems expanding rapidly.
App Store vs Google Play: Growth Comparison
- Google Play accounts for 70% of all downloads, while the App Store dominates with 63% of total consumer spend.
- Average revenue per user is 2.4x higher on the App Store than on Google Play.
- In-app purchases on the App Store grew by 12.4% year-over-year, compared to 9.7% on Google Play.
- Games lead in both stores, but App Store users spend more per transaction, averaging $1.80 compared to $1.15 on Android.
- App Store search ads now generate 4.3% higher conversion rates than in 2024, helping iOS developers gain traction.
- Subscription apps make up 85% of total revenue on the App Store, compared to 72% on Google Play.
- Android developers saw a 7% increase in global downloads in 2025, driven by growth in emerging markets.
- App Store markets in Japan, South Korea, and the US continue to yield the highest lifetime value per user.
- Google Play Protect enhancements in 2025 helped reduce malware-laden app installs by 16%.
- The App Store’s stricter review policies slowed app approvals by 1.8 days on average, yet contributed to higher trust scores among consumers.
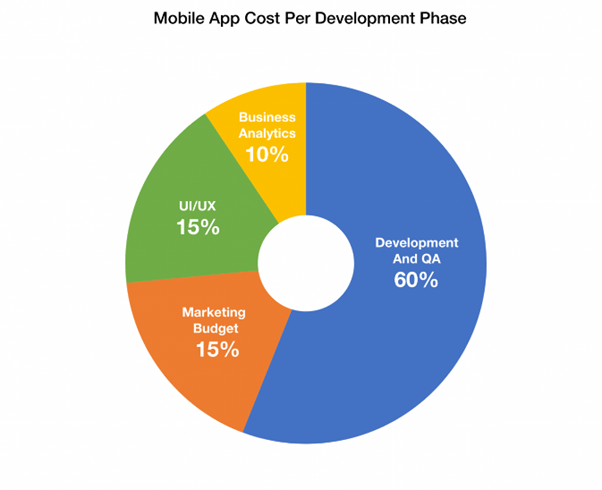
Mobile App Cost Breakdown by Development Phase
- Development and QA take up the largest share, consuming 60% of the total mobile app budget.
- UI/UX design accounts for 15%, reflecting the importance of creating a seamless user experience.
- The marketing budget also makes up 15%, showing how crucial promotion is to an app’s success.
- Business analytics is allocated 10%, supporting data-driven decision-making and app strategy planning.
Security and Privacy Trends Affecting App Adoption
- Privacy-centric apps saw a 29% rise in installs in 2025, especially among users aged 18–34.
- End-to-end encryption is now a default feature in over 62% of new communication and messaging apps.
- Biometric authentication usage has reached 81% among financial and health apps in developed markets.
- Following 2024’s major data breaches, 31% of users say app privacy policies directly influence their download decisions.
- Regulatory compliance (GDPR, CCPA, and local variants) has become a top feature filter in app marketplaces.
- Ad tracking opt-out rates are holding steady at 74% on iOS, influencing how app marketers approach retargeting.
- Decentralized identity solutions, using blockchain, are beginning to emerge in credential verification and access control apps.
- Child safety controls in mobile apps are now required in 18 countries, with compliance rates at 92% across major stores.
- In-app consent flows have improved, reducing bounce rates by 14% for first-time users of privacy-heavy apps.
- Zero-trust architecture is gaining ground among enterprise app developers, especially in the finance and healthcare sectors.
Recent Developments in Mobile App Ecosystem
- AI agents are now embedded in 1 out of every 4 new productivity apps launched in Q1 2025.
- Super apps, multi-purpose platforms offering payments, messaging, and shopping, are expanding beyond Asia into Latin America and Africa.
- Cross-platform development tools like Flutter and React Native now account for 38% of all new app builds.
- Apple’s VisionOS SDK is driving new types of immersive apps for spatial computing and AR interfaces.
- Voice-first interfaces are now a primary UX design strategy in 23% of new app launches.
- App clips and instant apps are gaining popularity, allowing users to try apps without full installations.
- The average time-to-market for mobile apps has decreased to 4.7 months, due to advances in low-code/no-code tools.
- M&A activity in the app space hit a 5-year high, with over 480 deals recorded in Q1–Q2 2025 alone.
- Green app development practices are being adopted by 26% of top developers, optimizing for lower battery and bandwidth use.
- Voice, visual, and gesture input are merging to create new multi-modal app experiences, especially in entertainment and fitness.
Conclusion
From rural India to urban America, mobile apps are transforming the way we experience the world in 2025. They’re smarter, faster, more secure, and tailored to serve every aspect of life. The rise of 5G and AI isn’t just pushing the boundaries of what apps can do; it’s reshaping user expectations at a fundamental level. Markets are diversifying, demographics are shifting, and platforms are converging in ways that weren’t imaginable a decade ago. For developers, businesses, and users alike, the future of mobile apps is not just bright, it’s always on.


