Mobile advertising has become the backbone of digital marketing. Today, companies increasingly rely on mobile to reach audiences through apps, social media, and search. Brands from retail to entertainment are seeing measurable results, from rising ad spend to stronger engagement metrics, especially in video and in‑app formats. In this article, we assess global trends, growth forecasts, and what’s driving mobile ad spend, so you can see where the opportunity lies.
Editor’s Choice
- The global mobile advertising market is projected to reach $447 billion in 2025.
- Mobile will account for around 56% of total digital ad spend globally in 2025.
- U.S. mobile ad spend hit $202.59 billion in 2024, up ~14.4% year‑over‑year.
- In‑app advertising is a dominant format, with global in‑app ad spend projected at about $390 billion in 2025.
- Asia‑Pacific leads in regional mobile ad spending with ~$231 billion in 2025, followed by North America at ~$164 billion.
- Over 72% of digital ad dollars are going to mobile platforms in 2025.
- Social and in‑app placements together will make up about 60% of mobile spend in 2025.
Recent Developments
- Some economic forecasts suggest that, under severe trade tension scenarios, tariffs may reduce global ad market growth by up to $14 billion, though this projection is speculative and contingent on policy changes.
- Programmatic advertising continues to expand, becoming more central for mobile formats.
- Increased use of AI tools for ad buying, targeting, and creative optimization is becoming standard.
- Privacy policy and tracking limitations (e.g., changes on iOS or regulatory shifts) are pushing advertisers to find new attribution models.
- The value of in‑app user acquisition is being re‑evaluated; one study found every $100 spent generates ~37 paid installs plus 3 organic installs, showing paid ads boost organic installs too.
- More brands are shifting budget toward video content and rich media (interactive, shoppable ads) as consumer attention fragments.
- Location‑based/mobile local ads are drawing more investment, with spending on location‑based mobile marketing estimated at $34.2 billion in 2025.
- Enterprises are increasingly making mobile ads a priority; about 92% of enterprise‑level marketers plan to raise mobile ad investment by the end of 2025.
Mobile Marketing Statistics and Trends
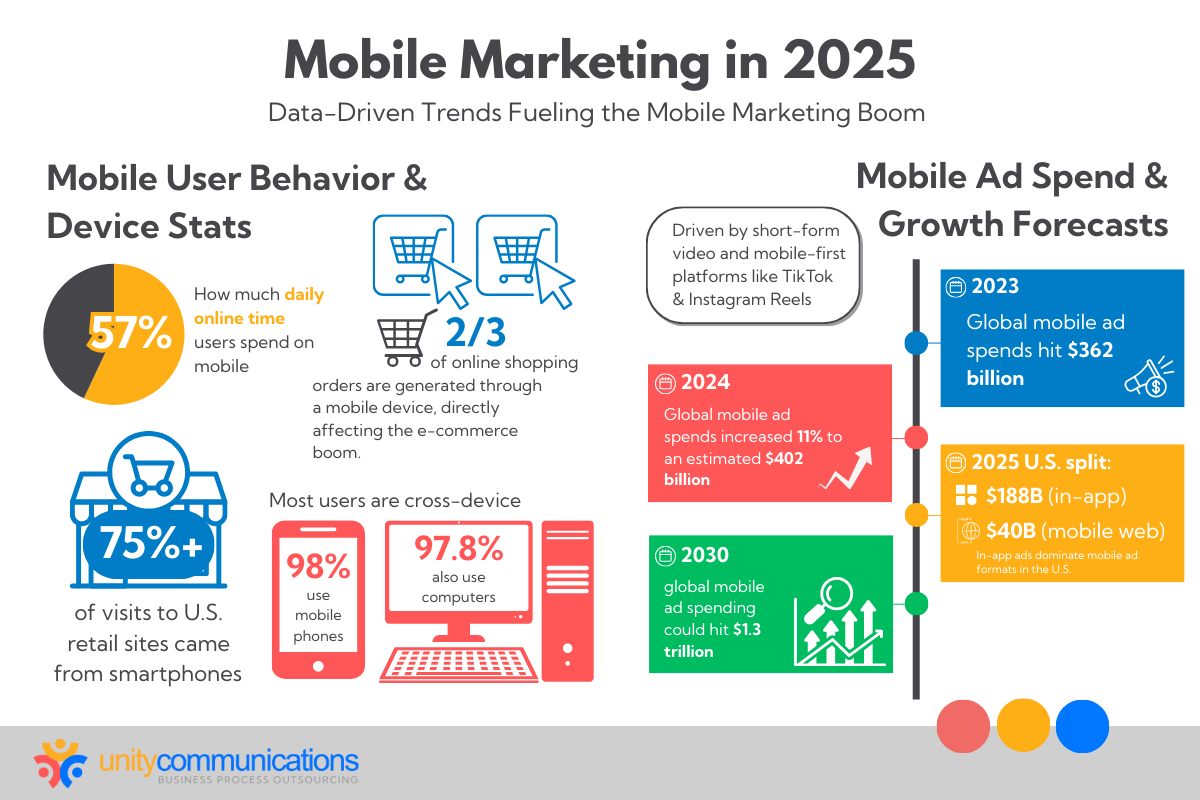
- 57% of users’ daily online time is spent on mobile devices, highlighting mobile’s central role in digital engagement.
- 2 out of 3 online shopping orders are placed via mobile devices, directly fueling the e-commerce boom.
- Over 75% of all visits to U.S. retail websites come from smartphones, underscoring mobile’s dominance in retail browsing.
- 98% of users access the internet via mobile phones, while 97.8% also use computers, showing most consumers are cross-device users.
- In 2023, global mobile ad spend hit $362 billion, marking a major milestone for the industry.
- In 2024, global mobile ad spending jumped by 11% to reach an estimated $402 billion.
- In the U.S. 2025 forecast, $188 billion will be spent on in-app advertising, compared to $40 billion for mobile web ads.
- Short-form video platforms like TikTok and Instagram Reels are driving mobile ad growth through mobile-first strategies.
- By 2030, global mobile ad spend is projected to skyrocket to $1.3 trillion, indicating a long-term upward trajectory for mobile marketing.
Global Mobile Advertising Overview
- In 2024, the global mobile ad market size was about $402 billion, increasing to ~$447 billion in 2025.
- Mobile ads now represent over half of all digital ad spend globally (~54.3% in 2024, projected ~56% in 2025).
- Digital channels (including mobile) accounted for ~72.7% of all global ad investment in 2024.
- Global ad spend in 2024 surpassed $1.1 trillion, up ~7.3% from 2023.
- Asia‑Pacific is the largest region by spend, projected to lead mobile ad investment with ~$231 billion in 2025.
- North America (US and Canada) follows, with about $164 billion of mobile ad spend in 2025.
- Strong growth is seen in emerging markets, where mobile penetration and smartphone ownership are increasing rapidly.
- In‑app advertising commands the majority of mobile ad revenue globally, and formats such as search and video are also growing.
Mobile Ad Spend Growth and Trends
- Global mobile ad spend is growing at ~10.1% CAGR for 2025–2035 according to some forecasts.
- U.S. mobile ad spend grew ~14.4% in 2024.
- Brands are spending more on video and in‑app formats than banner/search in many markets.
- In 2025, about 12.3% annual growth rate is expected for mobile marketing globally.
- Retail/e-commerce sectors contribute a significant share to total mobile spend (~26% globally).
- Location‑based mobile marketing spending is rising, $34.2 billion in 2025.
- Over 50% of brands increased their mobile ad budgets in Q1 2025 alone.
- Social & in‑app placements make up about 60% of mobile spend in 2025.
Mobile vs Web Ad Spending Breakdown
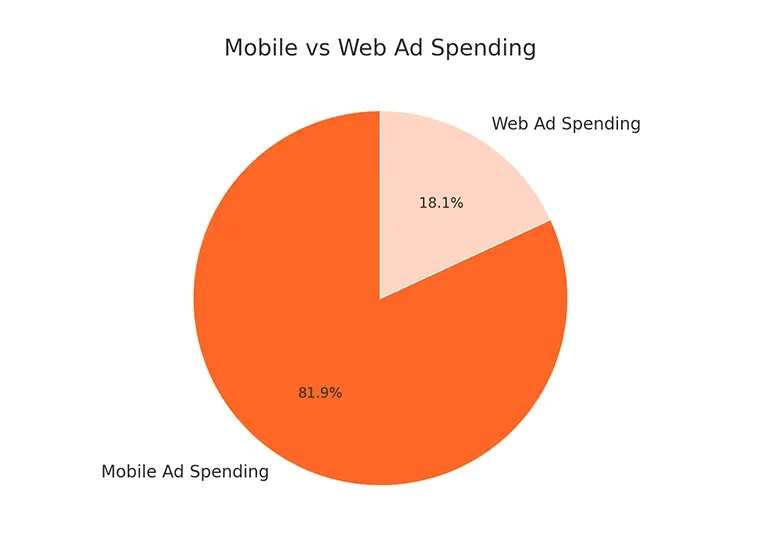
- Mobile ad spending represents a massive 81.9% share of total digital ad budgets, showing how brands prioritize mobile-first campaigns.
- Only 18.1% of ad budgets go toward web (desktop) advertising, signaling a decline in traditional browser-based engagement.
- The overwhelming tilt toward mobile reflects shifts in consumer behavior, where most browsing, shopping, and content consumption happens on smartphones.
- Marketers are increasingly allocating resources to mobile platforms due to higher reach, better targeting, and greater ROI.
- This split reinforces that mobile is now the primary battleground for digital advertising success.
Mobile’s Share of Total Digital Ad Spend
- In 2024, mobile accounted for ~54.30% of all digital ad spending globally.
- Projection for 2025, approximately 56% of digital ad spend will go to mobile.
- In the U.S. in 2024, mobile made up ~66.0% of total digital ad spend.
- US growth in share has been relatively stable in recent years, ~65.5‑66.0%.
- Mobile overtook desktop for search advertising spend in many mature markets.
- Social media mobile ads are contributing a growing share of digital ad spend, reinforcing mobile’s dominance.
Ad Spend by Region
- Asia‑Pacific leads with ~$231 billion mobile ad spend projected in 2025.
- North America is expected to spend around $164 billion on mobile ads in 2025.
- Other regions (Europe, Latin America, the Middle East & Africa) are growing but with lower absolute spend and steeper growth rates.
- Growth in Asia‑Pacific is driven by China, India, and Southeast Asia, where mobile adoption and digital infrastructure are scaling rapidly.
- In Latin America & MEA, mobile ad spend growth is a strong percentage‑wise but from smaller base amounts.
- The U.S. remains the single largest market by dollar spend.
- Emerging markets are catching up, especially when local currencies, mobile penetration, and regulatory frameworks improve.
Growth of Digital Ad Formats
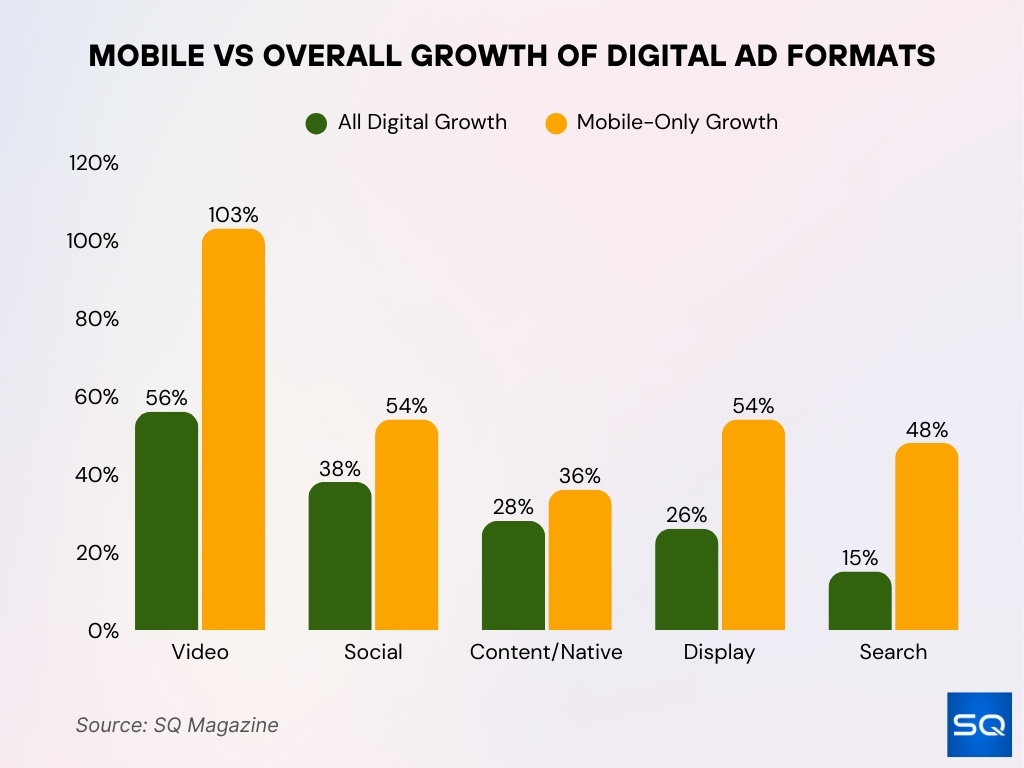
- Mobile video ads surged by 103%, nearly doubling the 56% growth seen across all digital video formats.
- Social media advertising grew 54% on mobile, compared to 38% across all platforms, reflecting mobile’s dominance in social engagement.
- Content/native ad formats experienced 36% growth on mobile, ahead of the 28% increase in total digital channels.
- Mobile display ads matched social, growing by 54%, while total display growth lagged at 26%.
- Search advertising on mobile climbed 48%, significantly outperforming the 15% growth seen in overall digital search.
Mobile Advertising by Format
- Video ads are growing fast, and short‑form and vertical video formats are becoming priority formats for mobile campaigns.
- Native ads embedded in content feed continue to outperform banner ads in both CTR and engagement metrics.
- Interstitial ads (full‑screen display between content) and rewarded video (especially in gaming apps) are among the highest revenue generators in mobile formats.
- In‑app video ad spending is part of the in‑app advertising market, which is expected to reach $390.04 billion globally in 2025.
- Formats that allow immediate action (shoppable ads, interactive rich media) are being preferred over purely awareness‑based display ads.
- Search ads on mobile still hold value, especially for intent‑driven audiences. Advertisers increase their share of spend here when aiming for conversions.
- Social media ad formats tailor creative for mobile with video, stories, Reels, Shorts, etc., boosting engagement over static images.
- Ad placement in mobile apps (including gaming, social, and utility apps) makes up a large portion of non‑social ad formats. Social networking apps and games are the top categories for in‑app ad revenue.
Social Media Mobile Ad Statistics
- Global social media advertising spend is projected to reach $276.7 billion in 2025.
- A high share of social media ad spend is already mobile‑based and is expected to increase further toward 83% by 2030.
- There are approximately 5.41 billion social media users globally as of July 2025, about 65.7% of the world’s population.
- Average daily time on social media is ~2 hours, 24 minutes per user.
- In the U.S., about 72.5% of the population (≈246 million people) are active social media users.
- Short‑form video content is preferred for product discovery; 78% of people prefer learning about new products via short video formats.
- Social media ads are a leading source of brand awareness among internet users aged 16‑34.
- From 2025 to 2030, social media ad spend is expected to grow at ~9.37% annually.
Mobile Ad Performance Benchmarks
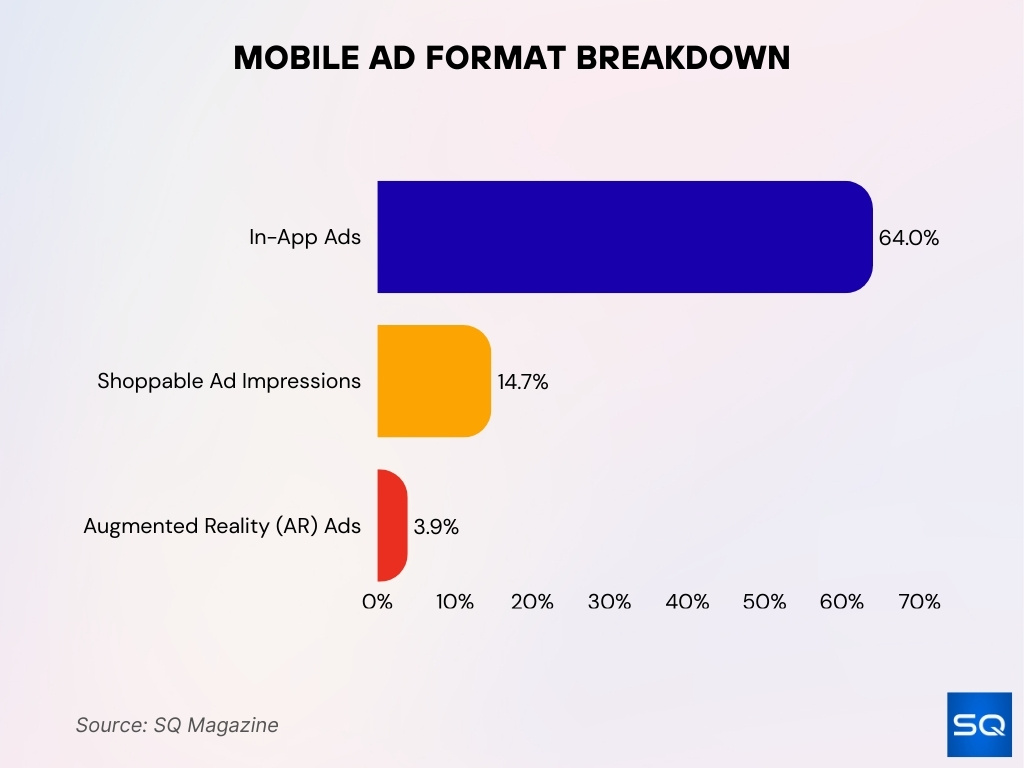
- In‑app ads account for 64% of mobile advertising expenditures globally in 2025.
- Shoppable ad impressions make up 14.7% of mobile ad impressions in 2025.
- Augmented Reality formats are still niche; 3.9% of mobile ad budget is spent on AR formats.
- Global mobile ad spend is expected to reach $533 billion in 2025, growing about 12.3% year‑over‑year.
- Mobile video ad spend globally is about $52.6 billion in 2025.
- $86 billion is projected global spend on mobile search ads in 2025, surpassing desktop search for many categories.
In‑App Advertising Insights
- Global in‑app ad spend is expected to reach $390.04 billion in 2025.
- The CAGR for the in‑app advertising market is ~8.17% over 2025‑2029.
- Average ad spend per mobile internet user (in‑app) is projected at $59.23 in 2025.
- The United States is expected to generate about $147.52 billion of in‑app ad spending in 2025.
- Social networking apps generate the highest revenue among in‑app categories, and games come in second.
- In a study of app install ads, every $100 spent yields ~37 paid installs plus about 3 organic installs, indicating strong spillover between paid spend and organic growth.
- In‑app purchase (IAP) business also rises fast, from $209.13 billion in 2024 to $257.23 billion in 2025.
Mobile Shopping and M‑Commerce Statistics
- Mobile commerce transactions are projected to reach $2.5 trillion globally by 2025, representing about 63% of all e‑commerce sales.
- Brands are optimizing mobile ads toward conversion as mobile shopping behavior strengthens.
- The average ad spend per user in the in‑app category ties closely with shopping app behavior, higher in markets with strong mobile commerce infrastructure.
- Offline businesses are increasing investment in local mobile shopping ads to capture foot traffic and “click‑to‑door” metrics.
- Mobile checkout abandonment remains a challenge; speed, user experience, and trust factors affect final conversion rates significantly.
- In markets like Southeast Asia, Latin America, and China, mobile shopping penetration exceeds 70% of e‑commerce usage.
- Ad spend in shopping‑oriented mobile campaigns is rising faster than spend in awareness campaigns in many retail sectors.
Engagement Rates
- Engagement rates (clicks, taps) for native and video mobile ads generally outperform static banner ads.
- Short‑form video formats get significantly higher engagement, and users prefer them for product discovery and learning.
- Rewarded video ads in games or utility apps show higher retention and better post‑interaction performance.
- Interstitial and full‑screen display ads continue to generate higher viewability and engagement versus small banners, but risk being more intrusive.
- Ads in social networking apps often see higher engagement because of embedded feed/scroll behavior; Instagram Stories, TikTok/Reels are key examples.
- Time to interact, shorter ad formats (≤15 seconds) perform substantially better in maintaining viewership and lowering skip rates.
- Engagement tends to drop off sharply if ad load time or latency is high on mobile, especially in lower bandwidth areas.
Consumer Behavior Trends
- Average daily time spent on social media is now ~2 hours, 24 minutes globally.
- Mobile users spend time across ~7 different social media platforms per month on average.
- Consumers expect mobile ads to be helpful, fast, and well‑designed. Poor UX (slow loading, too many redirects) leads to abandonment.
- Increasing use of mobile wallets, one‑click payments, and in‑app checkout is shaping expectations of ad performance.
- Many consumers use ad blockers or privacy tools, and trust and transparency are becoming more relevant in ad targeting.
- Brand discovery still occurs via mobile social media and video more than via search in younger demographics.
Ad Blocking Statistics
- Use of ad blockers on mobile devices remains significant, particularly in markets with high data costs or low trust in ads.
- Many users install ad blockers at the browser level, and some apps also allow ad blocking. This affects both display and video ad delivery.
- Regions like Europe and parts of Asia show higher adoption of ad‑blocking tools compared to the U.S.; regulatory approaches also influence this.
- Some platforms are tightening rules around consent and data tracking, which reduces the effectiveness of some forms of ad blocking but also prompts users to use block tools.
- Ad blocking may reduce the effective reach of mobile display ads by double‑digit percentages in certain audience segments.
- The trade‑off for publishers is balancing ad revenue with user experience; overbearing ads or non‑transparent tracking often drive ad blocker adoption.
Mobile Ad Spending by Industry
- Retail & e‑commerce account for 26% of global mobile ad spend in 2025, making them the largest industry segment.
- Industries like financial services, automotive, and healthcare & pharma follow, though each with smaller shares relative to retail.
- In the U.S., mobile ad spend in sectors such as travel, retail, and auto will grow faster than average in 2025.
- The entertainment/media sector continues to increase investment in mobile video & streaming ads, especially to reach younger demographics.
- The auto industry is leveraging mobile more for both awareness (video, social) and performance (search, local) segments.
- Health & pharma is showing growth, especially in mobile advertising tied to wellness, prescription information, and telehealth services.
- Tech companies continue to spend high on mobile ads around product launches, with notable spikes in consumer electronics, apps, and SaaS.
Device Usage for Mobile Ads
- Over 72.8% of all digital advertising dollars in 2025 are allocated to mobile platforms.
- Smartphones dominate mobile ad impressions, tablets make up a much smaller slice.
- In markets like the U.S., mobile search impressions now surpass desktop search for many categories.
- Mobile web usage still matters, particularly for content discovery and local searches, but in‑app usage eclipses mobile web for ad spend and engagement.
- A rising share of mobile ad interactions comes from social apps and utility apps rather than pure web browsers.
- Location access on mobile devices is increasingly common; many users grant location permissions, which boosts opportunities for geo‑targeted ads.
- Load speed, latency, and app performance on device type continue to influence engagement and conversion significantly.
Demographics in Mobile Advertising
- Younger generations (Gen Z & Millennials) are responsible for a large share of mobile video consumption, social ad interactions, and mobile purchases.
- In 2025, many reports show that 61% of all retail website traffic comes from smartphones.
- Gen Z users are more likely to prefer short videos, mobile social formats, and shopping via social apps compared to older generational cohorts.
- The percentage of users willing to share location data is higher among younger users, enabling more precise targeting.
- Older age groups still respond, but with different ad formats (less immersive, more informational).
- Differences in device type (iOS vs Android) also correlate with demographics, affecting spending power, ad cost, and behavior.
Local and Location-Based Mobile Advertising
- Global spend on location‑based mobile marketing in 2025 is estimated at $34.2 billion.
- Shoppable ads with location or store‑visit calls to action are becoming more common; a measurable portion (≈14.7%) of mobile ad impressions are now shoppable.
- A large share of consumers use their phones while physically in stores, for price comparisons, reading, or locating items.
- Local search conversions via mobile tend to happen quickly, many within an hour of search in local‑context queries.
- Beacons and physical location tech are less widespread but growing in high‑density markets and retail environments.
- Consumers expect offers based on their current location, and contextual offers perform better than generic ones.
Mobile Advertising ROI and Budget Allocation
- 54% of B2C marketers say their highest ROI campaign in 2025 came from mobile ads.
- A large proportion of enterprises plan to increase mobile ad budgets in 2025, and 92% of enterprise‑level marketers will raise mobile spending before year‑end.
- More marketers allocate budget toward formats with clearer performance attribution (search, in‑app, social) rather than pure brand awareness.
- Paid mobile ad spend tends to have spillover effects; one study found that every $100 spent on mobile app install ads generated ~37 paid + ~3 organic installs.
- Advertisers are shifting away from underperforming segments and reallocating toward in‑app, social, and video formats, which tend to have higher ROI.
- Efficiency metrics (cost per install, cost per click, cost per conversion) vary by region and industry but have improved on average in mature markets as competition and tools improve.
Future Trends in Mobile Advertising
- Contextual advertising is gaining ground as privacy regulations tighten, and advertisers are beginning to prioritize context over behavioral targeting.
- In‑app purchases are growing fast, especially in non‑gaming verticals.
- Generative AI and machine learning will increasingly drive creative production, ad targeting, and budget allocation.
- Immersive technologies (AR/VR) remain experimental, and adoption is slowly expanding.
- Enhanced measurement models (multi‑touch attribution, incrementality testing, viewability) will become more standard across mobile campaigns.
- Sustainability and ethical data use are becoming more central; consumers and regulators both expect transparency in data collection and ad targeting.
Frequently Asked Questions (FAQs)
It is projected to reach $447 billion in 2025, representing about 56% of total digital advertising spend.
The CAGR is estimated at about 10.13% from 2025 through 2035.
Global in‑app ad spending is expected to reach $390 billion in 2025, and in the U.S., in‑app ads represent about 81.9% of total mobile ad spend.
Mobile commerce accounts for about 73% of all e‑commerce sales globally, and in 2025, approximately 72.9% of all online sales are expected to come from mobile devices.
Conclusion
Mobile advertising today is no longer just an option; it’s the foundation of digital marketing strategy. As ad spend surges past $500+ billion, industries like retail, finance, and healthcare push outstanding returns by focusing on mobile‑first formats, local targeting, and measurable outcomes. Device behaviors, demographics, and location‑driven insights are shaping budgets and creative decisions more than ever. For brands aiming to stay competitive, the call is clear: optimize every mobile touchpoint.


