





The Initial Coin Offering (ICO) space has matured dramatically in recent years. What began as a fringe funding method has evolved into a regulated, data-rich segment of the blockchain industry. ICOs now span global jurisdictions, compete with IEOs and IDOs, and involve a blend of retail and institutional investors. In sectors like decentralized finance (DeFi), real estate tokenization, and gaming, ICOs remain a preferred capital formation model.
Two real-world applications showing their continued impact include startups raising capital without intermediaries and blockchain-based infrastructure funding public utility tokens. The following report delivers a data-driven overview of the ICO market, unpacking success trends, failures, regulatory updates, and regional activity. Explore the insights ahead to better understand where this volatile, high-stakes market stands today.
Editor’s Choice
- In 2025, 1,096 ICOs were launched globally.
- The U.S. led with 248 ICOs hosted in 2025.
- The ICO service market in 2025 is estimated at $5.78 billion.
- Ethereum accounts for over 72% of the ICO platform share, by number.
- In 2025, DeFi, AI, and real‑world asset tokenization were among the top sectors for major ICOs.
- Cross‑border investor participation rose to 48% of total ICO contributions.
- The median ICO hard cap in 2025 was about $9 million.
Recent Developments
- As regulations tighten globally, many projects emphasize transparency, KYC/AML compliance, and clear token compliance to reassure investors.
- The ICO service ecosystem (marketing, legal, audit, launchpads) is maturing fast, projected to grow from $5.78 billion in 2025 to $14.59 billion by 2033.
- Launchpads and incubators are used by ≈ 22% of ICOs in 2025 to reach early backers.
- Token “presales” with staking or bonus mechanisms are increasingly common to attract early investors.
- Fraud detection tools, on‑chain analytics, and audits are more often integrated into ICO pipelines as part of risk mitigation.
- Some jurisdictions, like Dubai and Singapore, have introduced regulatory sandboxes or clearer guidance for token offerings, attracting more ICO activity locally.
- The competition from IEOs and IDOs remains steep, pushing ICOs to differentiate via governance features or novel token models.
ICO One-Year Return Breakdown
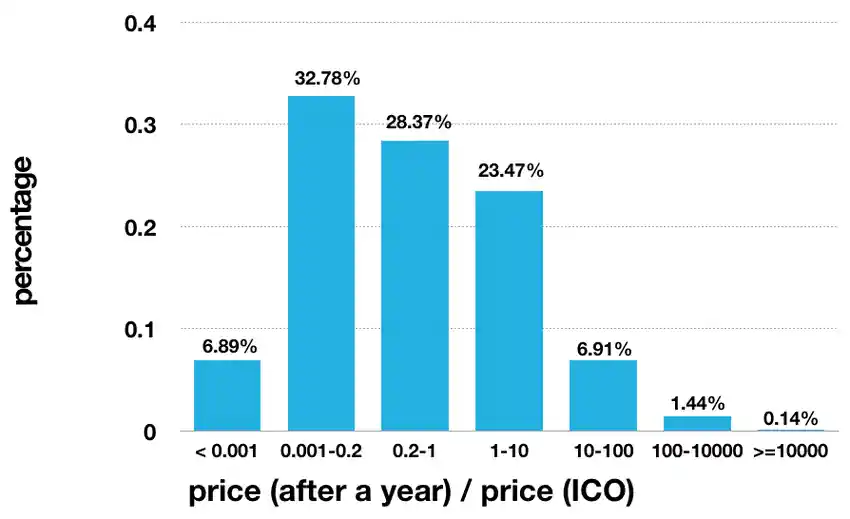
- 32.78% of ICOs delivered 0.001–0.2x returns, marking the most frequent outcome after one year.
- 28.37% fell in the 0.2–1x range, showing partial value loss but not total failure.
- 23.47% achieved 1–10x returns, indicating moderate investor success.
- 6.91% generated 10–100x gains, a rare but rewarding outcome.
- 6.89% collapsed below 0.001x, causing almost complete capital loss.
- 1.44% delivered 100–10,000x returns, representing extraordinary growth.
- A minuscule 0.14% exceeded 10,000x, marking the most exceptional outliers in ICO history.
Global ICO Market Size and Growth Trends
- The ICO service market is estimated at $5.78 billion in 2025.
- Projections suggest a rise to ~$14.59 billion by 2033, representing a compound annual growth rate (CAGR) of 12.5%.
- Another estimate places the ICO service size at $5.3 billion in 2024, trending toward $12.5 billion over the next decade.
- Verified Market Research data shows a prior valuation of $4.57 billion in 2023.
- The fastest growth regions are expected in Asia-Pacific and the Middle East.
- The share of ICOs using Ethereum (≈ 72%) suggests platform concentration in service demand.
- In terms of fundraising totals, major ICOs in 2025 alone raised over $3.2 billion across key projects.
- Cross‑border investment now makes up 48% of total ICO contributions.

Number of ICOs Launched Annually
- In 2025, 1,096 ICOs launched worldwide.
- Of those, 248 were hosted in the U.S. alone.
- Singapore saw 117 new ICOs in 2025.
- Germany and Switzerland recorded 98 and 84 ICOs, respectively.
- The UAE recorded 57 ICO launches, aided by regulatory initiatives.
- 43% of new ICOs launched on Ethereum, while 21% used Binance Smart Chain.
- The average pre‑launch period across those projects was ~3.5 months.
- The median soft cap was $1.8 million; the median hard cap hit $9 million in 2025.
- About 18% of new ICOs in 2025 came from gaming or metaverse sectors.
ICO Fund Allocation Overview
- 75% of total funds are dedicated to Development and Operations, emphasizing priority on product creation and infrastructure maintenance.
- 15% is allocated to a Legal Contingency Fund, safeguarding the project against compliance or regulatory risks.
- 10% is spent on Marketing and Community Outreach, fueling awareness campaigns and user engagement efforts.

Average Funds Raised per ICO
- In 2025, the average amount raised by an ICO stood at $5.4 million.
- The top 10% of ICOs raised $18.2 million on average.
- ICOs built on Ethereum averaged $6.7 million.
- Utility or ecosystem‑oriented token projects pulled in ~$6.3 million on average.
- Multi‑chain ICOs received about 22% more capital than single‑chain offers.
- About 67% of 2025 ICOs accepted stablecoins like USDT, USDC, and DAI.
- Projects with audited smart contracts raised $1.2 million more than those without audits.
- The median raise in 2025 was $3.7 million.
- Tiered pricing models boosted average fundraising by ~18% relative to fixed pricing schemes.
Success Rate of ICOs
- In 2025, the reported success rate of ICOs was 34.5%, meaning roughly one in three met their targets.
- Some other sources claim a success rate of 55.4%, reflecting variance by methodology.
- Around 65.5% of ICOs ultimately faltered.
- Among successful ICOs, the average duration to reach the funding goal was 54 days, versus 68 days for failed ones.
- Successful ICOs typically hit about 55.4% of their hard cap goals.
- Projects with more than 50,000 community followers showed higher success odds.
- Whitepapers with greater depth (e.g., 35+ pages) correlated with better outcomes.
- The absence of a formal refund policy appeared in ~85% of ICOs.
- Audited smart contracts improved credibility and fundraising potential.
ICO Communication Platform Trends
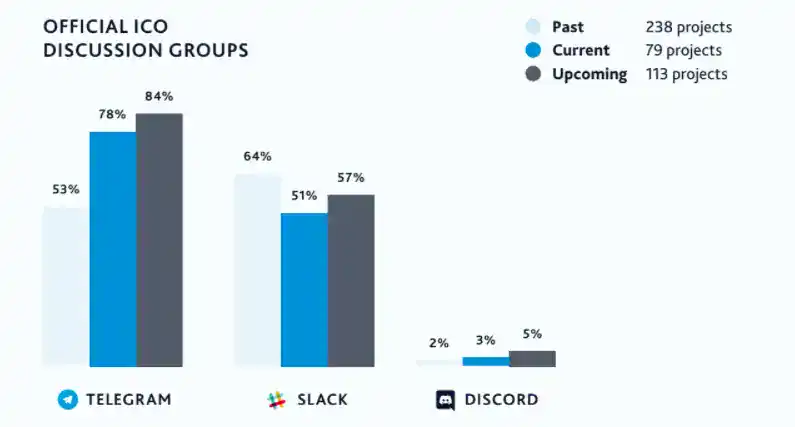
- Telegram dominates as the top discussion hub, used by 84% of upcoming, 78% of current, and 53% of past ICOs.
- Slack shows a downward trend, adopted by 64% of past, 51% of current, and 57% of upcoming ICO projects.
- Discord remains marginal, with only 2% of past, 3% of current, and 5% of upcoming ICOs using it.
- Data is based on 238 past, 79 current, and 113 upcoming ICO projects analyzed.
Common Causes of ICO Failures
- Regulatory pushback or security classification caused 22% of ICOs to halt in 2025, making regulation a leading failure driver.
- Weak tokenomics led to 68% of unsustainable ICO projects, with poor economic design cited as a top risk.
- Poor execution or missed roadmaps resulted in 53% of failed ICOs losing investor confidence.
- Lack of smart contract audits or security testing contributed to 41% of ICO shutdowns from exploits or vulnerabilities.
- Insufficient community engagement or low marketing reach saw 75% lower fundraising outcomes for under-followed projects.
- Tokens without clear utility or use case accounted for 49% of ICOs that failed to build long-term value.
- Projects with overly aggressive hard caps had a 37% lower chance of reaching funding goals than those with realistic targets.
- Lack of refund policies left investors with no recourse in 85% of failed ICOs.
- Timing and macro downturns, such as crypto winter, reduced fundraising odds by 30% on average.
Investor Demographics in the ICO Market
- In 2025, 54% of ICO investors were aged 25–40.
- Male investors accounted for 69%, while female participation rose to 22%.
- Retail contributions comprised ~61%, while institutional players made up ~19%.
- North America led with 27% of the investor base, followed by Europe (24%) and Asia (21%).
- Mobile wallets or dApps accounted for 56% of funding transactions.
- The average individual investment was $2,420.
- 41% of investors participated in more than one ICO in 2025.
- 12% of investors used robo‑advisors or aggregation platforms to choose projects.
ICO Projects by Sector Distribution
- Finance dominates with 964 ICOs, emphasizing the drive to reinvent traditional financial systems through blockchain.
- Trading ranks second with 360 projects, showcasing strong demand for crypto exchanges and trading platforms.
- Payments make up 279 ICOs, focused on advancing fast and secure blockchain-based transactions.
- Infrastructure follows with 248 projects, powering the tools and frameworks behind the blockchain ecosystem.
- Internet projects total 209, aiming to decentralize web services and enhance online openness.
- Gaming records 203 ICOs, reflecting the expansion of blockchain-powered play-to-earn and virtual economies.
- Social Networks include 166 projects, highlighting efforts toward decentralized and censorship-free communication.
- Industry contributes 144 projects, and Entertainment adds 137, indicating broader blockchain adoption beyond core finance and tech.

Regional Distribution of ICO Projects
- In 2025, 43% of new ICOs were launched on Ethereum, followed by 21% on Binance Smart Chain.
- The median soft cap was $1.8 million, and the median hard cap was $9 million.
- 22% of ICOs employed launchpads or incubators to attract early backers.
- DeFi captured 39% of the total ICO fundraising share.
- 18% of new ICOs came from gaming/metaverse projects.
- Financial-sector ICOs accounted for 13.7% of projects globally.
- The U.S. hosted 248 ICOs in 2025.
- Singapore had 117 launches in 2025.
- Germany and Switzerland recorded 98 and 84 ICOs, respectively.
ICO Projects by Blockchain Platform
- On Ethereum, between 72% and 88% of ICOs have historically launched their tokens.
- In 2025, ≈ 43% of new ICOs used Ethereum.
- Binance Smart Chain accounted for ~21% of new projects in 2025.
- Other chains like Polkadot, Solana, and Avalanche captured ~15–20% cumulatively.
- Projects using multi‑chain deployments are rising ~10% year over year.
- Ethereum-based ICOs raised 20–30% more capital on average.
- Smaller ICOs often favor newer chains due to lower gas fees.
- Newer chains include cross‑chain bridge features for broader access.
- Developer tooling and liquidity influence platform selection.
Market Share of Top ICO Platforms
- Ethereum retains a > 70% share in many datasets.
- Binance Smart Chain ranks second among ICO platforms.
- Solana, Avalanche, and Polkadot see niche adoption for performance use cases.
- Some launchpads account for up to 15% of ICO activity.
- Platform choice depends on developer familiarity, liquidity, and compliance.
- Multi‑chain launches dilute single‑platform dominance.
- Re‑deployments post‑ICO are common for scalability or cost reasons.
- Platforms with mature security and audit tools remain preferred.
Trends in Utility vs. Security Token Offerings
- In 2025, utility tokens accounted for > 65% of all ICOs.
- Security token offerings (STOs) remain niche but more legitimate.
- Among regulated ICOs, 65% are structured as security offerings.
- Utility tokens provide platform access, gamification, or governance features.
- STOs often represent real-world assets or profit-sharing instruments.
- STOs show lower fraud risk (~4%) than utility token offerings.
- Some projects use hybrid models to balance flexibility with compliance.
- Investor appetite for utility tokens is strong in the DeFi and NFT sectors.
Comparison Between ICOs, IEOs, and IDOs
- ICOs accounted for 18.4% of all token sales in 2025, offering the broadest reach but now mainly thriving in less-regulated regions.
- IEOs provided instant exchange listing and faster liquidity, representing 15.5% of the market while charging higher listing fees for projects.
- IDOs surged to a market-leading 66.1% share, especially favored among DeFi startups for their decentralized and open participation model.
- The average ICO raised $14.7 million over about 54 days, while IEOs usually matched this but delivered liquidity and exchange exposure much faster.
- IDOs attracted smaller but more agile raises, with funding rounds typically between $250K and $5 million and instant tradability after launch.
- IEOs and IDOs often deliver higher initial price spikes, with top IDO platform average ROIs exceeding 400% for leading projects, while ICOs skew toward larger but riskier long-term bets.
Security Concerns and Fraud Incidents in ICOs
- Exit scams accounted for 31% of ICO investor losses in 2025, with millions lost to founders disappearing after fundraising.
- Smart contract vulnerabilities were linked to over $263 million in damages during H1 2025, making technical flaws a top threat.
- Anonymous or pseudonymous teams raised skepticism, and 27% of fraudulent ICOs had team identities unverified.
- Projects with vague whitepapers or lacking a roadmap had a 44% fraud rate, double those with clear documentation.
- AI-based forensics and blockchain analytics flagged 39% more probable scams before launch compared to manual detection.
- Post-launch audits and bug bounties paid out $65 million in 2025, a sign of rising security efforts from quality projects.
- Delisting due to fraud led to 13% of ICO tokens being removed from exchanges after investor complaints.
Regulatory Landscape Impacting ICOs
- The EU’s MiCA regulation now governs ICO structure and legality.
- Regulated ICOs under MiCA show a 65% success rate and ~4% fraud risk.
- The U.S. SEC continues to pursue unregistered ICOs as securities.
- Clear ICO laws in Singapore, Switzerland, and Malta draw compliant projects.
- Many projects invoke Reg D or Reg S for exemptions in the U.S.
- Regulatory sandboxes let startups experiment legally with token offerings.
- AML and KYC rules are now common ICO requirements globally.
- Non-compliant projects face token freezing, lawsuits, or shutdowns.
- Global cooperation on crypto law is expected to increase by 2026.
Frequently Asked Questions (FAQs)
It is estimated at $38.1 billion in 2025, reflecting a 21.7 % year‑on‑year increase.
Cross‑border participation accounts for 48 % of all ICO funding contributions in 2025.
Successful ICOs in 2025 raise on average $14.7 million in 54 days.
The reported success rate for ICOs in 2025 is 34.5%.
Conclusion
The ICO sector is evolving from its wild‑west roots into a more structured, risk‑aware ecosystem. Ethereum still dominates, while alternative chains and multi‑chain strategies are growing. Utility‑token models lead the market, though security token offerings gain traction with institutional appeal. Across the board, fraud, hacks, and regulatory ambiguity remain potent threats, pushing more projects toward audits, compliance, and transparency. Still, the promise of accessible capital raising draws innovators forward.
Whether an investor, startup, or analyst, the current ICO landscape demands rigorous diligence, clear token design, and regulatory foresight. Dive deeper into the full article to explore how regional trends, deep dive statistics, and strategic implications shape the future of ICOs in 2025 and beyond.