Android’s Google Play Store continues to shape the global mobile ecosystem. By early 2025, it hosts over 4 million apps, facilitating hundreds of billions of downloads annually. From free tools to subscription games, Play powers both consumer habits and developer income. Its impact extends to market insights in mobile monetization and app design. Explore the full article to understand how these trends influence strategy and growth.
Editor’s Choice
- Over 4.2 million apps available on Play in 2025.
- Industry analysts project global mobile app downloads, across both Google Play and Apple’s App Store, will reach approximately 299–300 billion in 2025, driven by smartphone growth in emerging markets.
- $63.4 billion in Play Store revenue estimated for 2025.
- About 97% of apps are free as of early 2025.
- Between 800 and 1,200 new apps are added daily.
- Around one in four apps (≈25–28%) on Google Play receive at least one update each week, according to mobile market data firms, though figures fluctuate depending on category and seasonality.
- Over 580,000 active developers/publishers on the platform.
Recent Developments
- Google’s 2023 antitrust ruling requires support for alternative Android app stores.
- Play Pass expanded in 2023 to Malaysia and the Philippines, and now covers 100 countries.
- Subscription models are increasingly popular via Play Pass and in-app billing, echoing trends in iOS apps.
- Play Store removed over 700,000 obsolete or low-quality apps through enforcement efforts.
- Developers continue optimizing for runtime permissions to comply with Android updates.
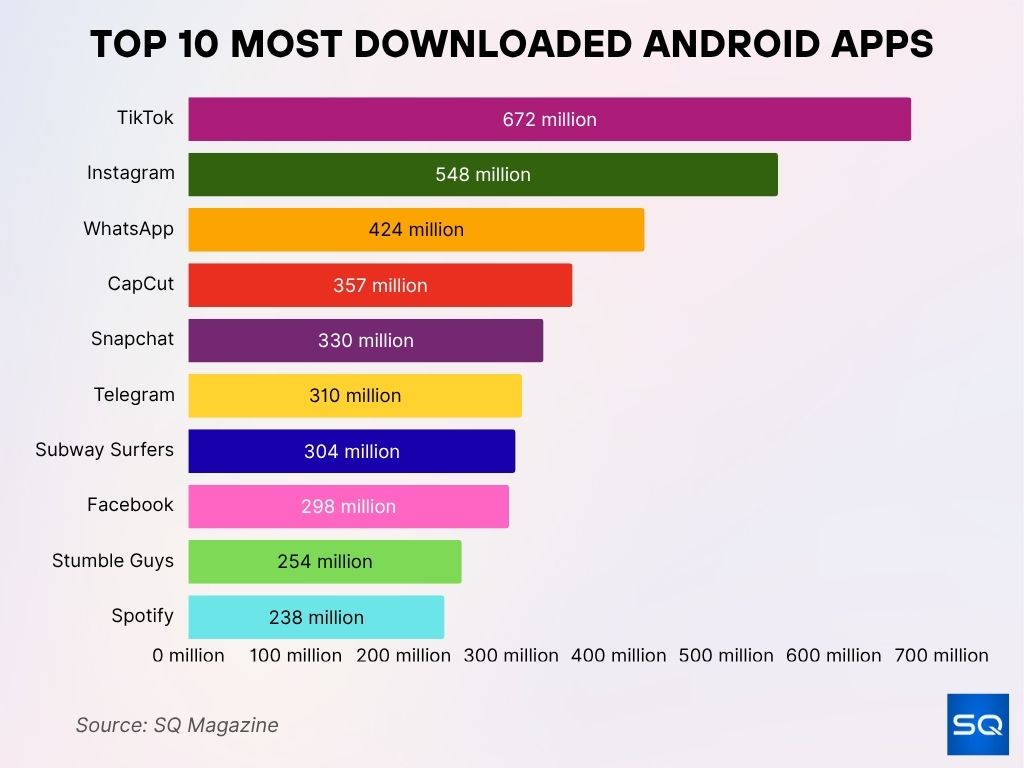
Top 10 Most Downloaded Android Apps in 2025
- TikTok leads globally with 672 million downloads, showing its unmatched dominance in short-form video content.
- Instagram secures second place with 548 million downloads, driven by Reels and influencer-driven engagement.
- WhatsApp records 424 million downloads, remaining a top choice for private messaging and group communication.
- CapCut reaches 357 million downloads, boosted by its integration with TikTok and easy video editing tools.
- Snapchat logs 330 million downloads, sustaining popularity with younger demographics through AR filters and chat features.
- Telegram hits 310 million downloads, appealing to users seeking privacy, large group chats, and secure messaging.
- Subway Surfers maintains a strong appeal with 304 million downloads, proving the staying power of casual gaming.
- Facebook attracts 298 million downloads, continuing relevance despite growing competition from newer platforms.
- Stumble Guys achieves 254 million downloads, riding the wave of multiplayer party game trends.
- Spotify garners 238 million downloads, cementing its position as a leading global music streaming app.
Total Number of Apps on Google Play Store
- 4.2 million apps available in 2025, up from 3.95 million in 2024.
- The store had about 3.95 million apps by Jan 2025.
- A drop from ~3.5 million in 2017 due to cleaning out low-quality apps.
- The Android app library grew ~6.2% year-over-year in 2024.
- Free apps comprise 97% of total listings in early 2025.
- Paid apps account for just 3% of total Play figures.
- The majority of apps are games, representing ~13.8% share, even though monetization leads to revenue.
Number of App Downloads
- Over 113 billion apps downloaded globally via Play in 2023.
- App inventory expected to drive nearly 135 billion downloads by the end of 2025.
- Global mobile app downloads overall projected to reach ~300 billion in 2025.
- Downloads rose about 7–8% year-on-year from 2023 to 2025.
- Google Play outpaced iOS by a wide margin, around 27.5 billion downloads in Q4 2022 vs 8.1 billion App Store.
- Play remains the top download platform globally by volume.
- Non-gaming categories are gaining share, but gaming still leads by total installs.
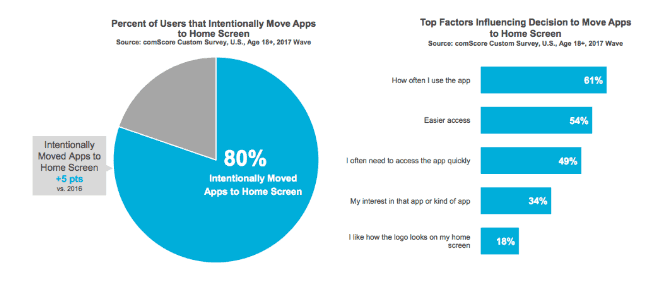
App Placement Preferences and Influencing Factors
- 80% of users intentionally move apps to their home screen, a +5 percentage point increase from 2016.
- 61% say they move apps based on how often they use them.
- 54% prioritize easier access when deciding app placement.
- 49% move apps because they need quick access to them.
- 34% base their decision on interest in the app or type of app.
- 18% choose placement based on how the logo looks on their home screen.
Google Play Store Revenue and Spending
- Projected $58.1 billion in revenue for Google Play in 2024, rising to $63.4 billion in 2025.
- Spending grew from $50.5 billion in 2023 to $55.5 billion in 2024.
- Q2 2023 revenue, $11.8 billion globally.
- Games generated $31.3 billion of that revenue in 2022, ~74% of Play revenue.
- Over 95% of Google Play revenue comes from free-to-install apps monetizing through in-app purchases and subscriptions rather than upfront payments.
- Play Pass contributed an additional revenue layer via subscriptions starting at $4.99/month.
- A small percentage of users, the top 1%, drive a large share of spend, following patterns seen across platforms.
Number of App Publishers and Developers
- Around 580,876 active publishers were releasing apps in 2024–25.
- Developer count continues to be high, but the marketplace is concentrated, and top publishers dominate downloads and revenue.
- Independent devs largely monetize via freemium & ad monetization, core to 98% of Play revenues.
- Many developers rely on app updates to maintain visibility, ~28% update weekly, 72% monthly, and over 95% annually.
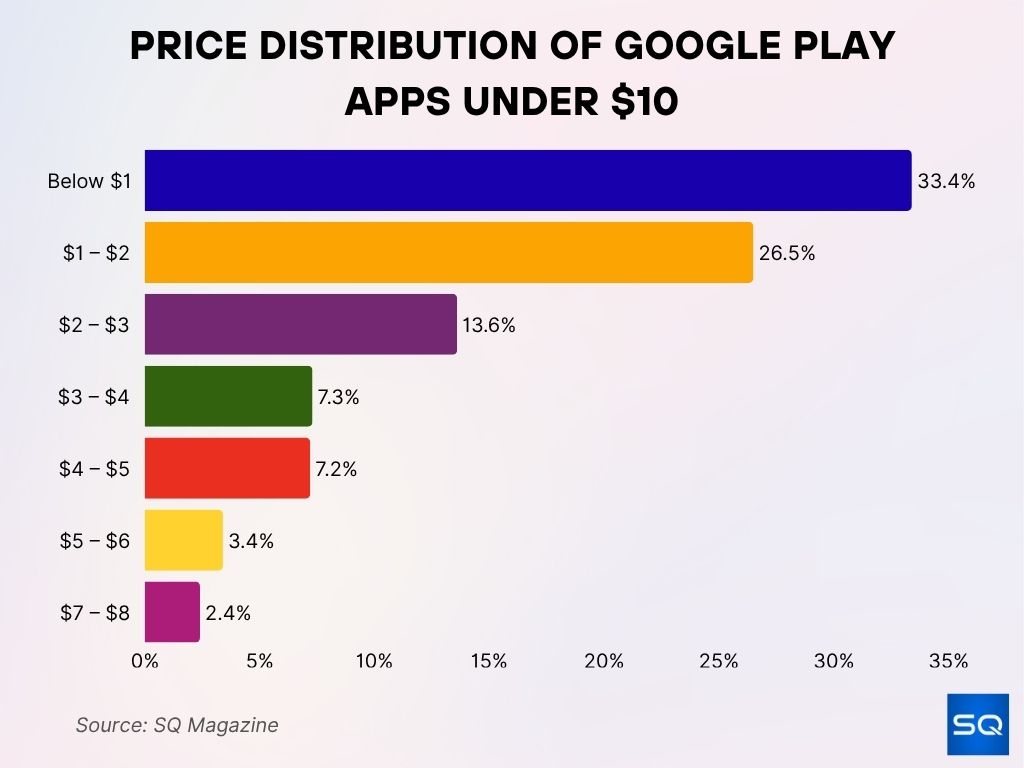
Price Distribution of Google Play Apps Under $10
- 33.4% of Google Play apps are priced below $1, making ultra-low-cost apps the largest share of the market.
- 26.5% fall in the $1 – $2 range, appealing to budget-conscious users seeking premium features at minimal cost.
- 13.6% are priced between $2 – $3, offering mid-tier pricing for more advanced or niche apps.
- 7.3% cost $3 – $4, representing a smaller but still notable share of app purchases.
- 7.2% are in the $4 – $5 range, catering to more specialized or feature-rich applications.
- 3.4% fall between $5 – $6, showing limited demand for higher-priced apps under $10.
- Only 2.4% are priced $7 – $8, making them the least common among sub-$10 apps.
Free vs. Paid Apps
- As of early 2025, roughly 97% of Google Play apps are free to install, leaving only 3% behind a paywall.
- That means about 1.975 million free apps versus ≈61,600 paid apps out of 2.037 million total.
- Over 20,000 paid apps cost under $1, while about 17,000 fall in the $1–$2 price range.
- Roughly 10,000 apps are priced $2–$3, around 6,000 at $3–$4, and about 1,263 at $9–$10.
- Free apps generate around 98% of Play Store revenue, mostly via ads, subscriptions, and in-app purchases.
- Ad-supported versions typically have more updates and resource usage than their paid counterparts.
- Paid apps generally request fewer permissions and may carry fewer vulnerabilities than freemium apps with complex libraries.
New Apps Added (Daily, Weekly, Monthly)
- Approximately 794 new apps are published daily on Google Play as of 2025.
- That equates to about 3,186 weekly additions.
- In a typical month, ~33,400 new apps are added.
- Estimates from app analytics platforms suggest between 800 and 1,200 new apps are published on Google Play each day, with variation depending on the source and month tracked.
- App creation continues year-round, with around 41,000 new apps reported in one December cycle.
- This output underscores the intense competition for visibility and user acquisition.
- Many new apps aim for niches or emerging regions to stand out.
Leading App Developers on Google Play Store
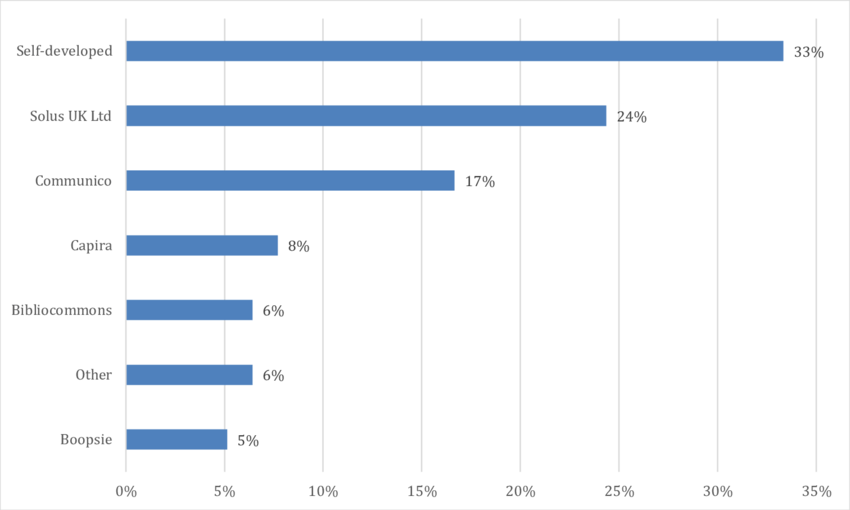
- Self-developed apps dominate the market, accounting for 33% of all listed apps.
- Solus UK Ltd holds a strong 24% share, positioning itself as a leading third-party developer.
- Communico develops 17% of apps, showing significant market presence.
- Capira contributes 8%, focusing on specialized app solutions.
- Bibliocommons and Other developers each represent 6% of the market.
- Boopsie has a smaller footprint with 5% of apps on the Google Play Store.
App Update Frequency
- About 28% of all apps receive weekly updates, keeping features current and bug-free.
- A further 72% are updated monthly, with over 95% updated at least annually.
- Apps on ad-supported models tend to update more often than their paid equivalents.
- Frequent updates are correlated with better store ranking and retention.
- Many developers also add features or refine permissions to maintain compliance and security.
Top Grossing Apps on Google Play Store
- Mobile games dominate Play revenue. In 2022, gaming apps generated $31.3 billion, rising to $34.3 billion in 2023, and projected to reach around $40.1 billion in 2025.
- Puzzle game Royal Match ranked among the top-10 grossing games in late 2024, with 55 million+ monthly active users.
- Candy Crush Saga, though older, still earns heavily via in-app purchases; its franchise hit over $20 billion in lifetime revenue by 2023.
- AAA freemium titles like PUBG Mobile have amassed over 1.3 billion downloads and billions in spend globally by the end of 2022.
- Casual games remain consistent earners due to low barriers to entry and frequent microtransactions.
- Growth in non-gaming revenue, such as subscription tools, is incremental but notable.
Most Exploited Application Categories
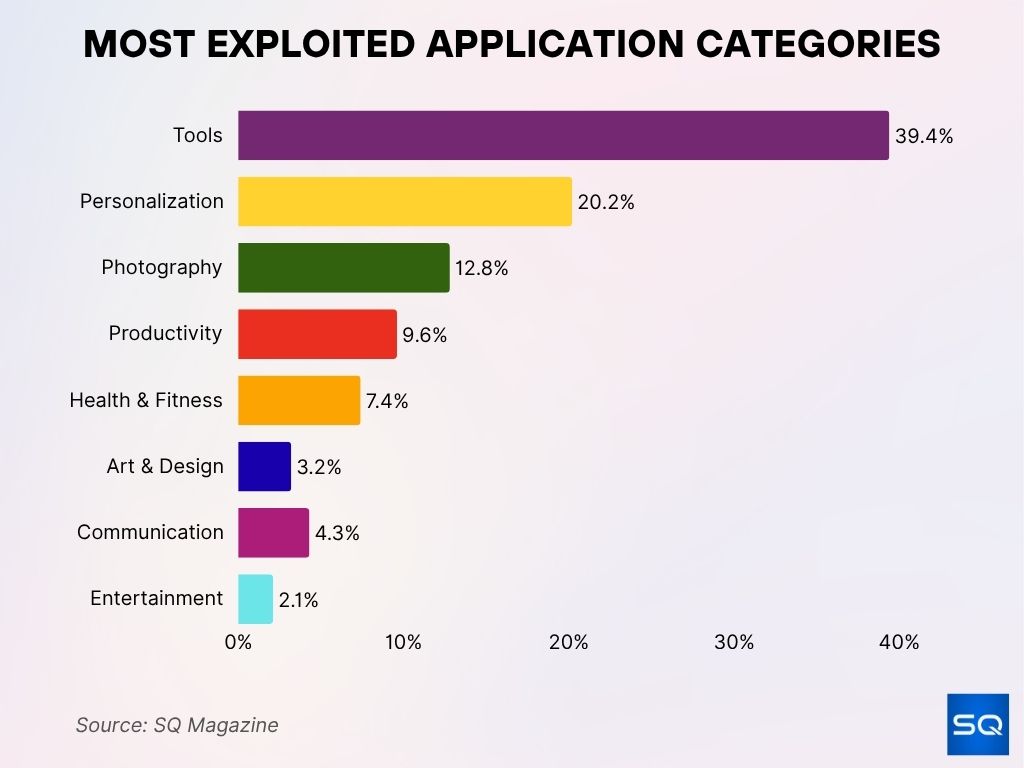
- Tool apps are the most targeted, making up 39.4% of exploited applications.
- Personalization apps account for 20.2%, showing high vulnerability due to customization features.
- Photography apps represent 12.8% of exploited categories, often targeted for access to user images and storage.
- Productivity apps comprise 9.6%, making them key targets for attackers seeking sensitive business data.
- Health & Fitness apps hold 7.4%, exposing potential risks to personal health information.
- Communication apps make up 4.3%, a concern due to access to messaging and contact data.
- Art & Design apps represent 3.2%, less common but still susceptible.
- Entertainment apps are the least targeted, with 2.1% of exploitation cases.
App Ratings and Reviews Statistics
- About 1.018 million apps (50%) have received at least one user rating; the other half remain unrated.
- Higher-rated apps typically earn more downloads, especially those with consistent 4-star or above feedback.
- Policy-compliant apps emphasizing privacy tend to get more positive reviews post-2023 enforcement trends.
- Frequent updates and clear descriptions also boost user confidence and average rating.
- Apps prone to privacy concerns or intrusive permissions often have lower review scores.
In‑App Purchases and Subscriptions Statistics
- In-app purchases generated around $21.5 billion on Google Play in Q1 2024.
- Total consumer spending on Play apps in 2024, $42.3 billion, is expected to rise to $55.5–65 billion in 2025.
- The top 1% of users, so-called “whales”, account for 40–60% of all in-app spending.
- 35% of subscription-based apps now mix models, subs + consumables, or lifetime purchase.
- 30% churn rate in annual subscriptions seen in month one, annual cheap plans retain 36%, expensive monthly only 6.7%.
- AI apps reach revenue/install of $0.63 after 60 days, double the overall median of $0.31.
Reasons People Use Their Favorite Navigation App
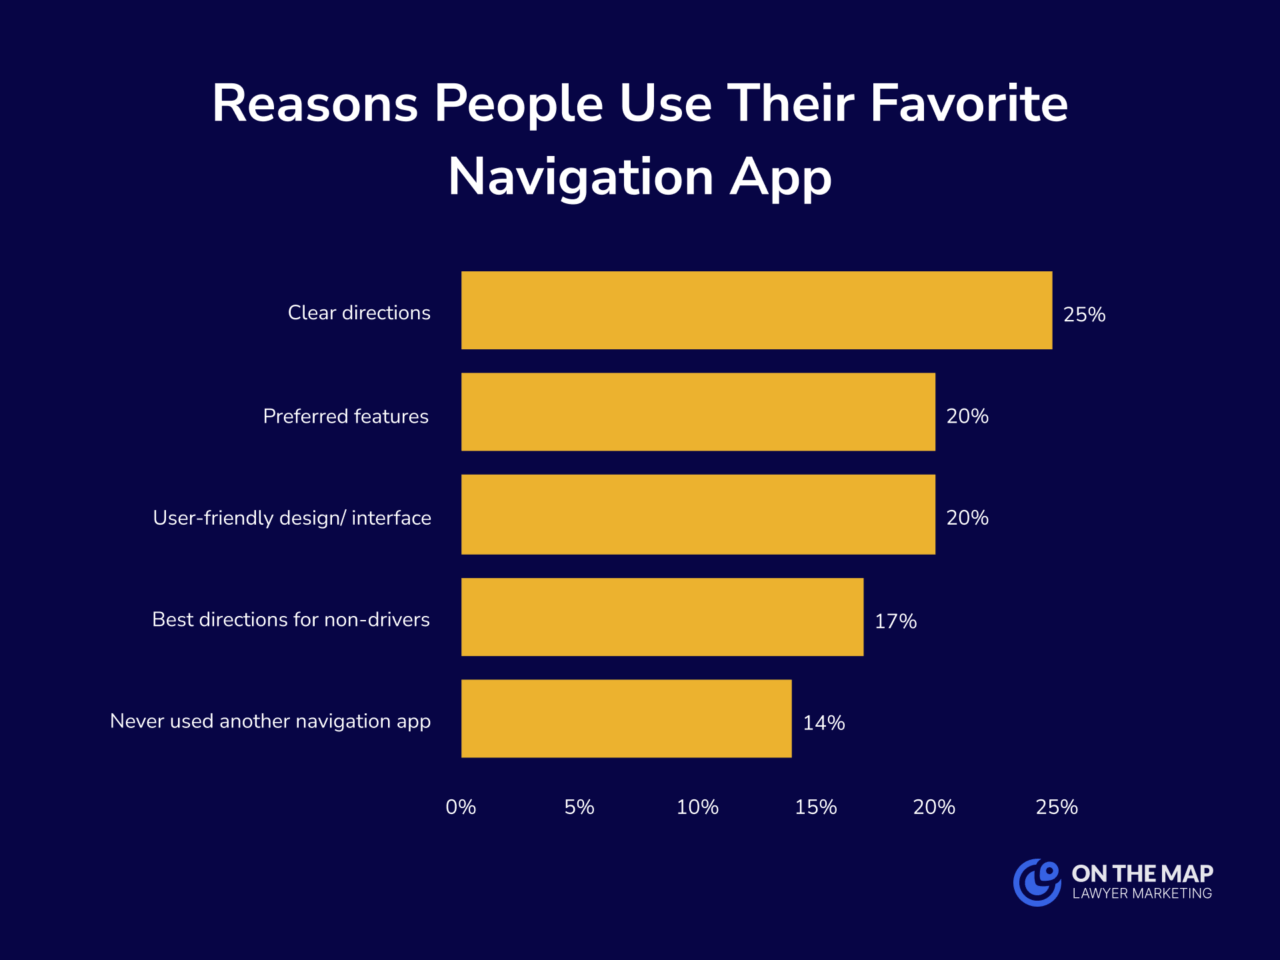
- 25% choose their favorite navigation app for its clear directions, ensuring accurate and reliable guidance.
- 20% prefer it because of specific features they value most.
- 20% appreciate the user-friendly design and interface, making it easier to navigate the app itself.
- 17% select it for providing the best directions for non-drivers, such as pedestrians or cyclists.
- 14% have never used another navigation app, indicating strong loyalty to their current choice.
User Demographics and Reach
- Mobile users spend an average of over 4 hours/day interacting with apps, with social and gaming dominating usage.
- <5% of users remain active one month after download, showing high churn across most apps.
- 70% of US digital media engagement happens via mobile apps.
- Average installed apps per user, 30/month, engaging 10 different apps daily.
- Millennials are particularly active, 21% open an app 50+ times/day.
- Key app users aged 16–34 comprise about 57% of mobile gamers, gender split of ~53% male vs. 47% female.
App Retention and Churn Rates
- <5% user retention after one month across typical apps.
- 70% of users drop off within one week for average apps, and top-performing apps lose only ~45%.
- Frequent content and feature updates help retention; the weekly update rate is ~36%, and the monthly ~73%.
- Addressing user feedback can improve retention by up to 25%.
Google Play Website Traffic by Country
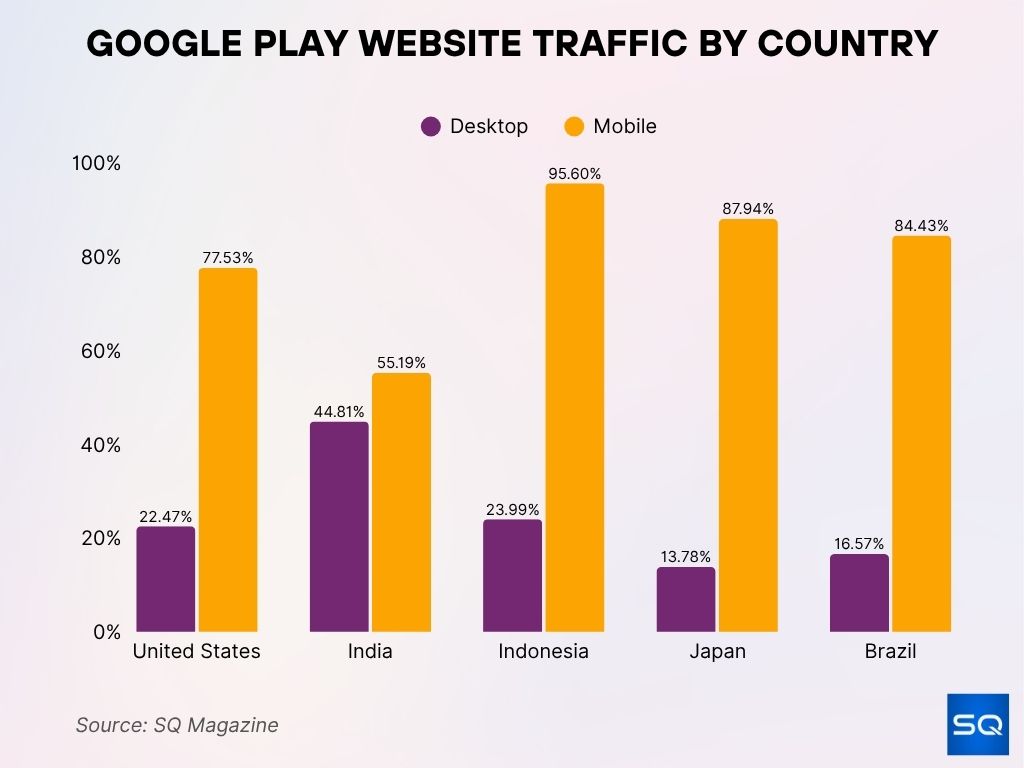
- The United States leads with 19.96% of global traffic, totaling 35.49B visits, with 77.53% from mobile users.
- India holds a 7.62% share and 13.56B visits, showing a high 44.81% desktop usage compared to other countries.
- Indonesia has a 0.92% share and 12.02B visits, with a dominant 95.60% coming from mobile.
- Japan accounts for a 0.62% share and 9.64B visits, with 87.94% mobile usage.
- Brazil records a 0.35% share and 1.58M visits, with 84.43% of traffic from mobile devices.
Policy Changes, Removals, and Violations
- Google’s Play Protect and peer grouping audits increasingly enforce stricter app permissions and malware checks.
- Approximately 700,000 low-quality or policy-violating apps have been removed in recent enforcement cycles.
- Free apps and highly popular apps more often request dangerous permissions over time; ~25,000 apps add permissions every quarter.
Conclusion
Google Play Store in 2025 presents a dense, mature ecosystem. With nearly 2.06 million apps, emerging regions driving growth, and 299 billion downloads, the platform is indispensable for mobile strategists. Free apps dominate both in volume and in revenue generation (~97% of listings, ~98% of revenue). Yet monetization remains challenging, median app revenue under $50/month, high churn, and retention under 5% after one month underscore the difficulty of longevity. Developers see success by mixing monetization models (35% adopting hybrid subs), delivering frequent updates, and responding effectively to feedback. Compliance with Play policies, especially around permissions and security, is critical; 700K+ removals show tightening standards.
As app creators plan, the takeaway is clear: focus on retention, target high-value users, refresh content often, and optimize pricing models smartly. If you’re aiming for traction in 2025, the full article offers deeper insights to guide your strategy.


