The console market in 2025 is in motion, with renewed growth, new hardware, and shifting market balances. From the launch of the Nintendo Switch 2 to the expanding library of major titles, the industry is experiencing a strong revival. In retail, console upgrades are driving renewed hardware sales, while subscription and digital services strengthen software revenue. Two real-world examples, gamers pre‑ordering the Switch 2 in droves at major retailers, and Sony’s PS5 still commanding shelf space amidst high demand. Dive in to discover the latest market trends and figures.
Editor’s Choice
- PlayStation leads with 45% market share among console brands in 2025.
- Nintendo follows with about 27%, showing strength in hybrid systems.
- Xbox holds around 23%, maintaining a solid third position.
- Switch 2 sold 3.5 million units in its first four days, Nintendo’s fastest-selling console ever.
- As of late June 2025, Switch 2 had reached 5.8 million units sold worldwide.
- PS5 lifetime shipments have soared to 75 million units by February 2025.
- Xbox Series X/S had sold 28.3 million units by mid‑2024.
Recent Developments
- Nintendo Switch 2 launched June 5, 2025, with enhanced display, performance, and 4K support.
- It’s 3.5 million launch‑day sales set a new company record.
- PS5 continues to gain ground, reaching 75 million units shipped by February 2025.
- Software growth is rebounding, console software revenue is expected to rise at a 7% CAGR through 2027, versus 2.6% for PC.
- Console hardware is on track for a 5.5–5.6% year‑over‑year growth in 2025.
- The gaming console market is projected to reach USD 24.8 billion in 2025, with forecasts reaching USD 28.9 billion by 2030.
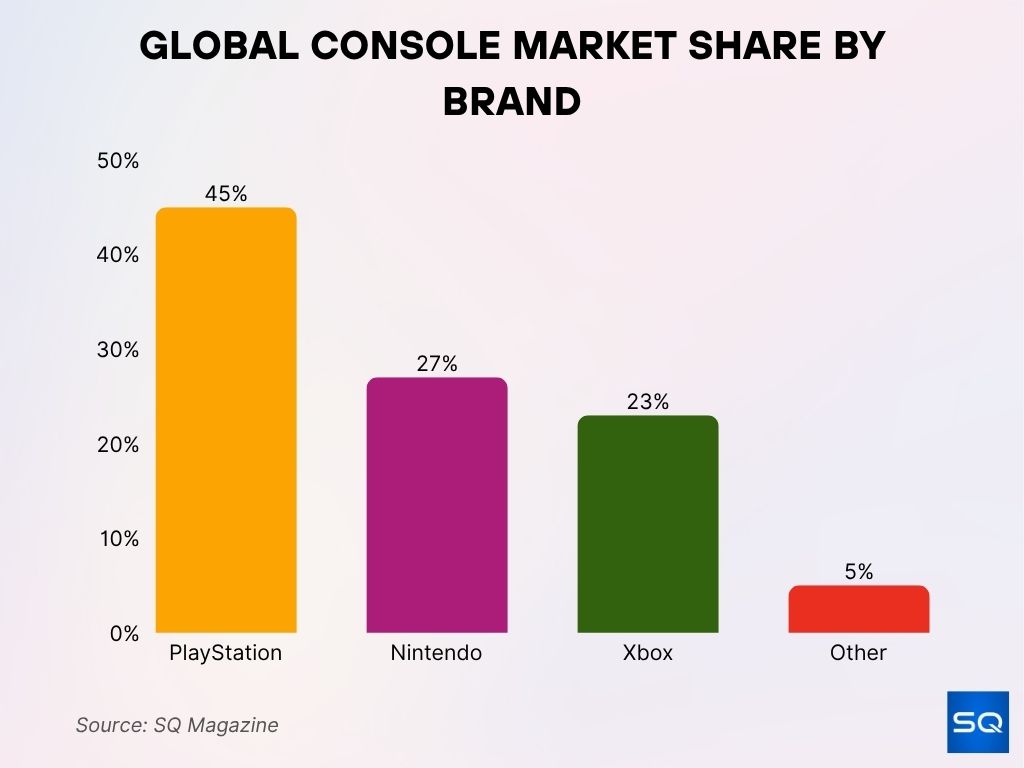
Global Console Market Share by Brand
- PlayStation dominates the global console market with a commanding 45% market share.
- Nintendo holds second place with a solid 27% share, driven by strong sales of its hybrid consoles.
- Xbox captures 23%, maintaining a competitive presence in the market.
- Other brands collectively account for just 5%, highlighting the dominance of the top three players.
Market Share by Model/Generation
- Nintendo Switch (all variants) has sold 150.8 million units by early 2025, the third-best-selling console ever.
- Switch 2 adds 5.82 million units by mid‑2025.
- PS5 hit 75 million shipments by Feb 2025.
- Xbox Series X/S, 28.3 million units by mid‑2024.
- Combined, Nintendo’s hybrid family (Switch + Switch 2) accounts for over 156 million units.
- PS5 alone leads among modern-gen consoles in total installations.
- Switch lineage remains the top-selling hybrid model globally.
Regional Console Market Share
- The U.S. console market is projected to generate $8.2 billion in revenue in 2025.
- Europe sees stable PS5 sales, but both Xbox and Nintendo Switch units are declining in 2025.
- Growth is strongest in emerging markets, South Asia, Latin America, and MENA, driven by increasing online access and mobile gaming.
- Asia-Pacific accounted for over 46% market share in 2024, the largest region globally.
- Specifically, China is now the largest gaming market by revenue, representing ~25% of global gaming income.
- Console OS share worldwide, Xbox leads at 66.8%, PlayStation around 33%, Nintendo at 0.15%.
- Asia-Pacific and North America remain the leading regions for console sales and engagement.
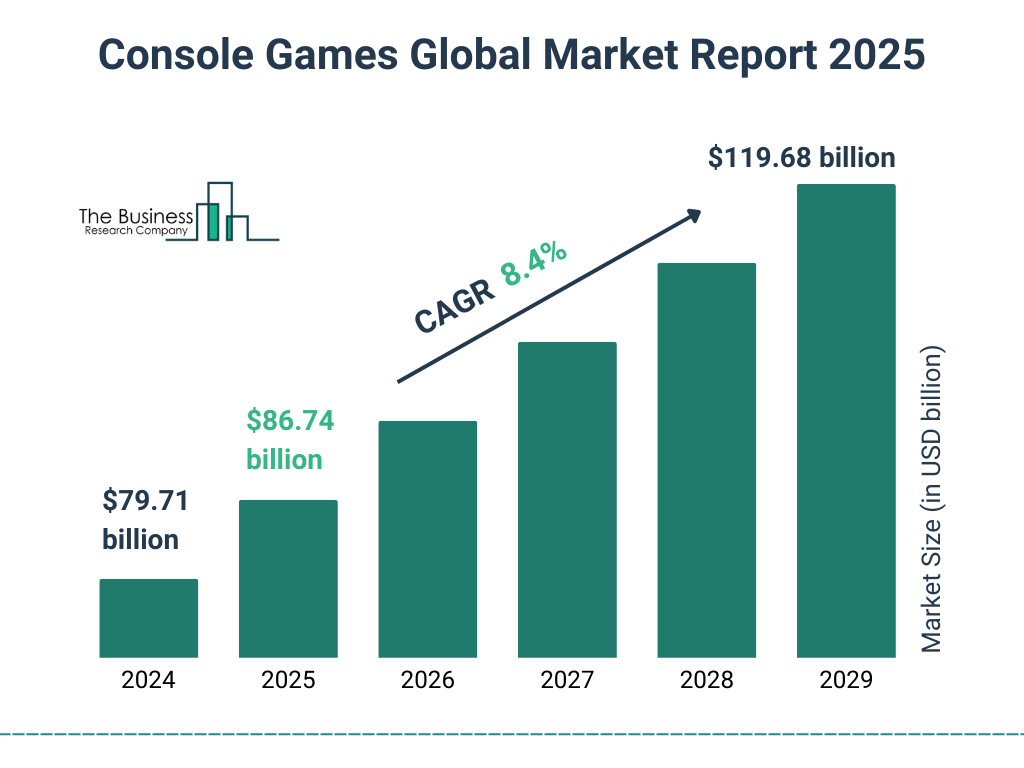
Console Games Global Market Growth
- The global console games market is projected to reach $86.74 billion in 2025, up from $79.71 billion in 2024.
- The market is expected to grow at a CAGR of 8.4% between 2024 and 2029.
- By 2029, the market size is forecasted to hit $119.68 billion.
- This sustained growth highlights increasing demand for console gaming and expanding monetization opportunities over the next five years.
Market Share by Country
- The U.S. dominates with $8.2 billion in console revenue in 2025.
- China, already a mobile gaming powerhouse, is now the top country for gaming revenue overall.
- In Europe, PlayStation maintains strength, with Xbox and Switch lagging in recent trends.
- Latin America and MENA are rapidly growing, though starting from smaller bases.
- Japan, after leading early Switch sales, shows waning original Switch demand but a rebound underway with Switch 2.
- Console OS usage, Xbox dominates globally, including countries as diverse as Japan and Brazil, with 66.8% share, PlayStation has 33%, and Nintendo remains minimal.
- Asia-Pacific continues to be the most influential region for console sales by country-level aggregates.
Annual Console Sales Statistics
- Switch 2 reached over 6 million units sold in its first 7 weeks.
- For the fiscal year through March 2026, Nintendo forecasts 15 million unit sales of Switch 2.
- PS5 has shipped 77.7 million units as of March 2025.
- Xbox Series X/S reported 28.3 million units sold by mid‑2024.
- Original Switch sold 141 million units by Q1 2025.
- Monthly sales snapshot (June 2025), Switch 2 – 5 million, PS5 – 916k, Switch (original) – 316k, Xbox Series X/S – 157k.
- Nintendo’s Q1 FY2026 operating profit increased 19% YoY, supported by Switch 2’s strong launch.
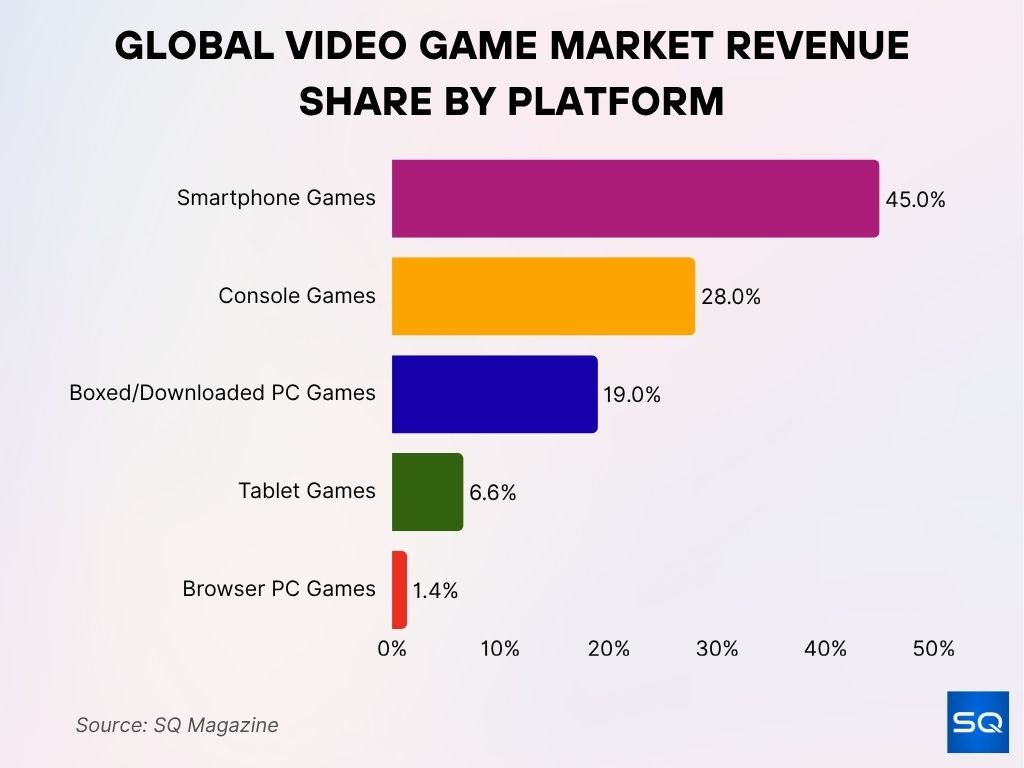
Global Video Game Market Revenue Share by Platform
- Smartphone games lead the global market with a dominant 45% share, reflecting mobile gaming’s massive popularity.
- Console games account for 28%, maintaining a strong foothold in the gaming ecosystem.
- Boxed/downloaded PC games hold 19%, still significant despite the rise of digital and mobile platforms.
- Tablet games contribute 6.6%, showing moderate engagement across mobile devices.
- Browser PC games make up the remaining 1.4%, indicating a steep decline in web-based gaming revenue.
Lifetime Console Sales Statistics
- Nintendo Switch amassed 141.32 million units sold by Q1 2025.
- Switch 2 added another 5.82 million units by June 2025.
- PS5 lifetime shipments stand at 77.7 million by March 2025.
- Xbox Series X/S lifetime sales reached 28.3 million units by mid‑2024.
- Total hybrid lineage (Switch + Switch 2) exceeds 147 million units.
- Original PlayStation family (PS4 + PS5) sales, hardware 117M (PS4) + 77.7M (PS5).
- Switch remains Nintendo’s fastest‑selling and all‑time bestselling console in hardware and software.
Market Share by Platform Type (Home/Portable/Hybrid)
- In 2025, home consoles account for 46.2% of the market value.
- Hybrid consoles (like Switch and Switch 2) continue strong global appeal, especially in regions lacking clear “portable” segments.
- While less dominant in market value, portable-only devices (e.g., Nintendo Lite variants) still contribute via bundles and secondary demand.
- Home console dominance is supported by advanced graphics, multimedia use, and online features.
- Online gaming, a key home platform strength, holds 58.9% of the application-based market share.
- Hybrid flexibility strengthens Nintendo’s positioning in markets with varied gaming habits.
- Overall, platform type trends show home > hybrid > portable-only, driven by performance and digital connectivity.
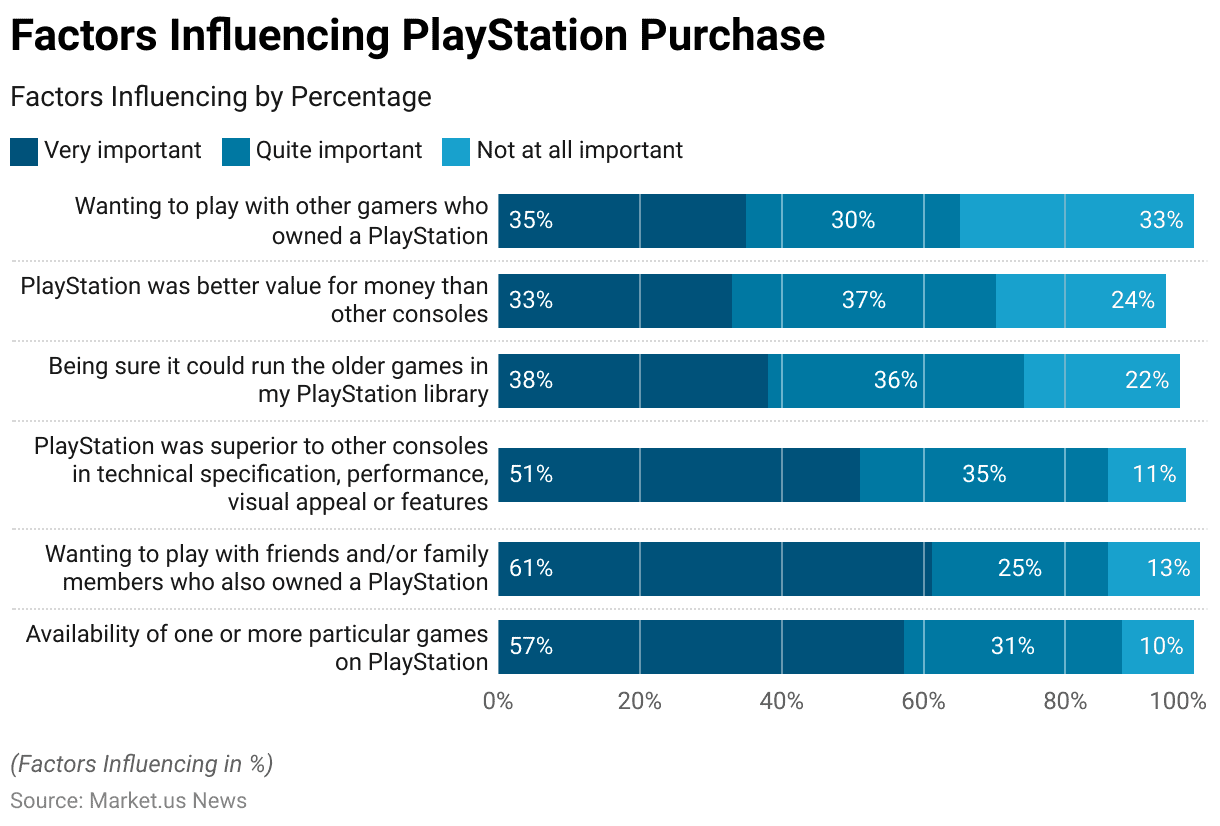
Key Factors Influencing PlayStation Purchase Decisions
- 61% of buyers said playing with friends/family on PlayStation was very important in their purchase decision.
- 57% cited the availability of exclusive games as a very important factor.
- 51% valued PlayStation’s technical superiority and features over other consoles.
- 38% prioritized backward compatibility, ensuring older games could run on the new console.
- 35% were influenced by the desire to play with other PlayStation gamers.
- 33% felt PlayStation offered better value for money than competitors.
Market Share by Operating System
- Xbox OS leads the market with 66.82% share as of mid‑2025.
- PlayStation OS holds 33.04% of the console OS market.
- Nintendo OS accounts for a minimal 0.15% of the console OS share.
- Xbox’s dominance in OS reflects its performance across the installed base.
- PlayStation maintains a significant OS presence tied to its modern-gen installs.
- Nintendo’s hybrid consoles use a proprietary OS with a limited share in overall metrics.
- Overall, Xbox remains the leading operating system environment for consoles.
Software Sales Statistics
- Switch software sales have reached just under 1.4 billion units on a lifetime basis as of 2025.
- The attach rate for Switch consoles exceeds 8 games per unit during its first four years.
- Top-selling Switch titles include Mario Kart 8 Deluxe (68.2M), Animal Crossing: New Horizons (47.8M), Smash Bros. Ultimate (36.4M), Zelda: Breath of the Wild (32.8M), and Super Mario Odyssey (29.3M).
- Other top sellers: Pokémon Sword & Shield (26.8M), Pokémon Scarlet & Violet (26.7M), Zelda: Tears of the Kingdom (21.7M), Super Mario Party (21.2M), New Super Mario Bros. U Deluxe (18.3M).
- PlayStation 4 & 5 combined software (sell‑in) has surpassed 1.322 billion units.
- PlayStation ecosystem software includes physical, downloads, PS VR titles, and bundled software.
- Console software revenue (PC + console combined) is forecasted at $85.2 billion for 2025.
- Console leads growth in software revenue with a +7% CAGR through 2027, outpacing PC’s growth rate.
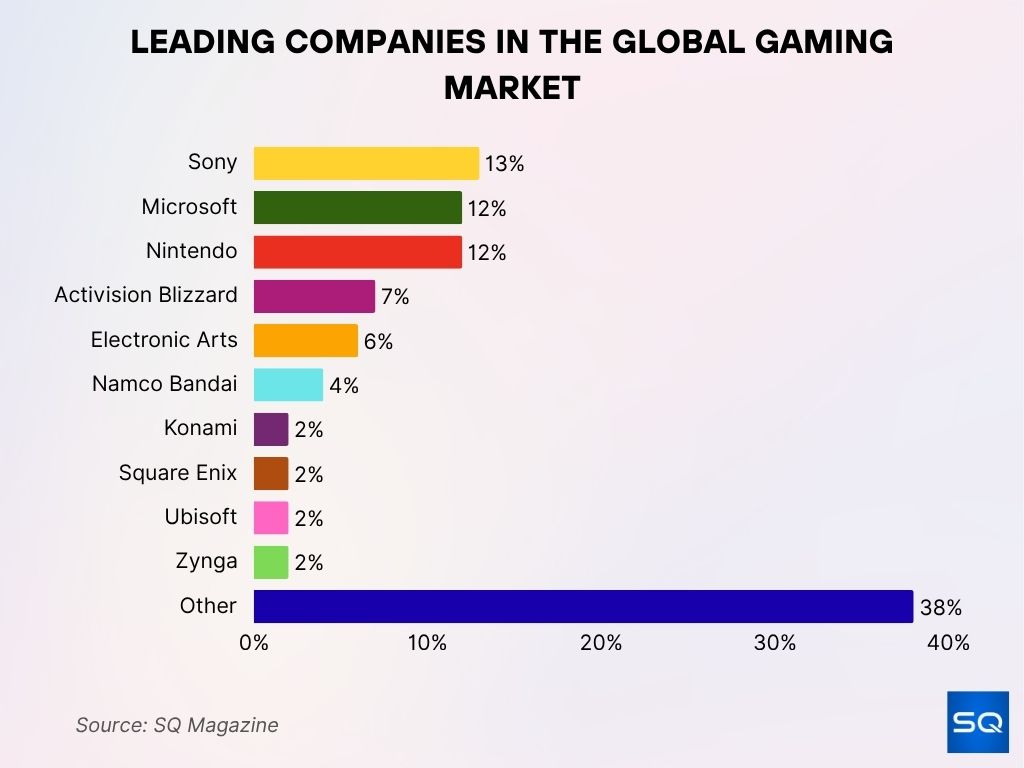
Leading Companies in the Global Gaming Market
- Sony leads individual companies with a 13% market share in the global gaming industry.
- Both Microsoft and Nintendo follow closely, each holding 12% of the market.
- Activision Blizzard captures 7%, reflecting its strong portfolio of blockbuster franchises.
- Electronic Arts (EA) holds a 6% share, driven by consistent sports and action titles.
- Namco Bandai contributes 4% to the global gaming market.
- Konami, Square Enix, Ubisoft, and Zynga each hold a modest 2% share.
- A diverse group of other companies collectively dominates with 38%, showing a highly fragmented and competitive market landscape.
Market Revenue Statistics
- Global console market revenue rose from $16.4 billion in 2018 to $23.7 billion in 2023.
- Market revenue is projected to reach $26.7 billion by 2029.
- The game console market is estimated at USD 58.6 billion in 2025, with anticipated growth to USD 95.4 billion by 2035 at a 5.0% CAGR.
- The console market’s steady upward trend reflects a 2.05% CAGR over the past decade.
- Console games represent approximately 28% of total global gaming revenue in 2024 (~$51 billion).
- Consoles outpaced retail revenue growth despite mobile dominating total revenue.
- Digital game sales make up 95% of game console software distribution, underscoring the shift toward online.
Market Share by Distribution Channel (Online vs Offline)
- Online sales of consoles are projected to account for 52.7% of market share in 2025, overtaking offline sales for the first time.
- By 2026, online share is expected to climb to 53.5%, while offline drops to 46.5%, continuing that trend.
- In 2027, online will reach 54.6%, offline declining to 45.4%.
- Digital full-game revenues remain stable at around $8 billion annually through 2025.
- Add-on content revenues grow from $15 billion in 2023 to $19 billion in 2025.
- Subscription revenues rise from $10 billion in 2023 to $11 billion in both 2024 and 2025.
- Overall, the shift toward online sales and digital services is fueling growth in revenue efficiency.
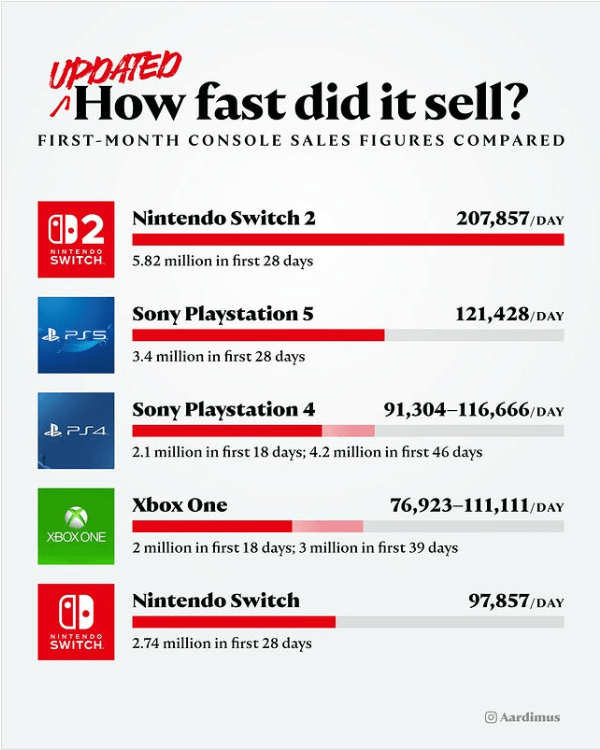
First-Month Console Sales Comparison (Fastest Sellers)
- Nintendo Switch 2 tops the chart with 207,857 units/day, totaling 5.82 million units sold in its first 28 days.
- Sony PlayStation 5 sold 121,428 units/day, reaching 3.4 million units in the first 28 days.
- Sony PlayStation 4 moved between 91,304 and 116,666 units/day, selling 2.1 million units in 18 days and 4.2 million in 46 days.
- Xbox One sold 76,923 to 111,111 units/day, with 2 million units in 18 days and 3 million in 39 days.
- Original Nintendo Switch achieved 97,857 units/day, selling 2.74 million units in 28 days.
Console Market Share in Emerging Markets
- China’s gaming market is expected to hit $50 billion in 2025, with two-thirds from mobile, and PC/console continues to grow.
- Asia and MENA combined are projected to reach $89 billion in 2025, home to 1.76 billion gamers.
- India is forecast to exceed $1 billion, and the Philippines over $500 million in 2025 revenues.
- Thailand is projected to reach around $2 billion, while Japan and South Korea remain flat in growth.
- Esports and streaming are huge growth drivers, with over 1 billion gamers in Asia/MENA watching gaming streams.
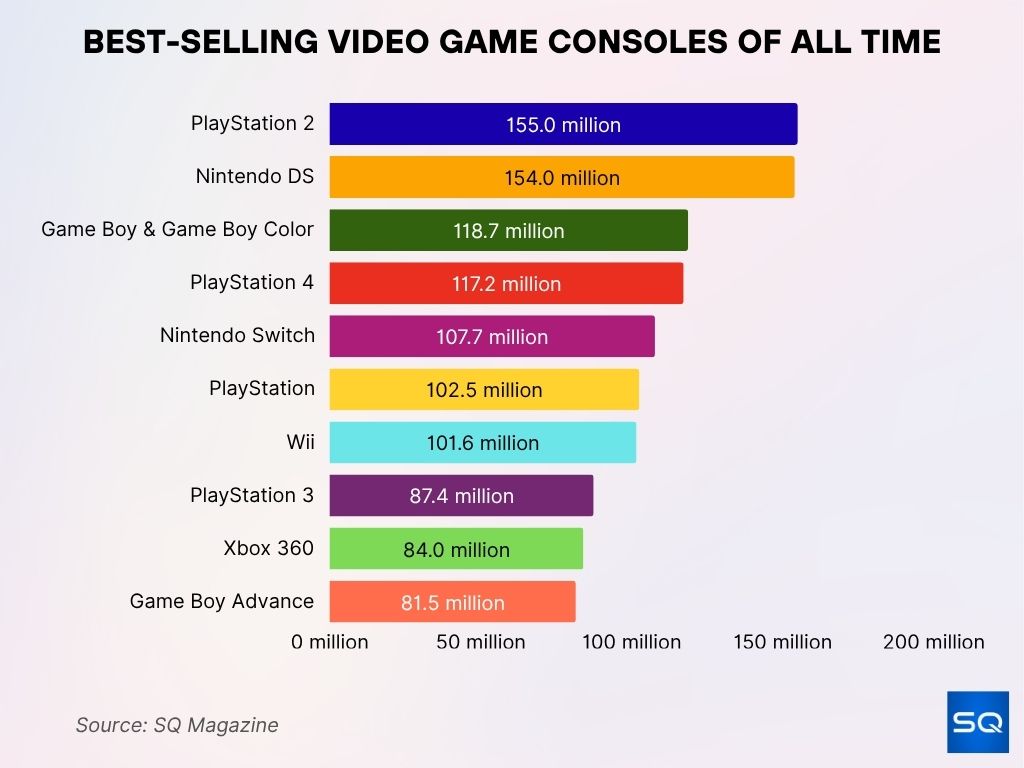
Best-Selling Video Game Consoles of All Time
- PlayStation 2 leads all-time sales with a staggering 155 million units sold.
- Nintendo DS is a close second, selling 154 million units globally.
- Game Boy & Game Boy Color rank third with 118.7 million units sold.
- PlayStation 4 follows closely with 117.2 million units, making it one of Sony’s most successful consoles.
- Nintendo Switch has reached 107.7 million units, continuing to climb.
- The original PlayStation sold 102.5 million units, a landmark for its era.
- Wii achieved 101.6 million units, driven by its motion-control innovation.
- PlayStation 3 sold 87.4 million units, despite a slow start.
- Xbox 360 reached 84 million units, becoming Microsoft’s best-selling console.
- Game Boy Advance rounds out the list with 81.5 million units sold.
Conclusion
The console market in 2025 is balancing near-term momentum with long-term potential. Hybrid and home consoles dominate today, yet digital services, online distribution, and subscription models are steadily reshaping revenue structures. Major launches like Switch 2 and GTA VI are energizing the sector, while Asia–Pacific and MENA stand out as high-growth frontiers.
As online sales overtake offline, and console software continues to outpace other platforms, industry players must adapt strategies to serve digitally-savvy consumers. Game developers, retailers, and hardware makers alike will benefit most by leaning into digital growth, expanding coverage in emerging regions, and embracing multiplatform ecosystems.

