Tor continues to serve as a vital infrastructure for privacy, censorship circumvention, whistleblowing, and anonymous communication. Its usage spans from activists evading government surveillance to everyday users seeking internet anonymity in restrictive regions. In one scenario, journalists in authoritarian states rely on Tor to receive tips and leaks safely. Dissidents use bridges to bypass national firewalls and access uncensored information.
Editor’s Choice
- The Tor network is accessed by approximately 2.5 million daily users globally.
- Estimates suggest that 6–7% of users interact with .onion services, and while .onion traffic makes up a small portion of total bandwidth.
- The network supports over 65,000 unique .onion addresses.
- By mid‑2024, Tor Browser had exceeded 200 million downloads worldwide.
- As of July 2025, the Tor network had around 8,000 active relays.
- Russia leads in mean daily Tor users, often surpassing 10,000 users.
- Tor Metrics data from recent years suggests that approximately 6–7% of users may access hidden services daily, although precise measurement is difficult due to privacy-preserving design and regional blocking.
Recent Developments
- The Tor Project quietly launched a beta Android VPN app to route app-level traffic through Tor.
- A research project called TORCHLIGHT revealed that attackers are using Tor to target IoT devices, discovering 29 zero-day vulnerabilities across ~12.7 million devices.
- A recent paper showed that a 5-minute DDoS attack on directory authorities was enough to disrupt Tor’s directory protocol.
- The MUFFLER system was proposed to obfuscate egress traffic dynamically to mitigate correlation attacks with only minimal overhead.
- Researchers continue to refine traffic measurement, e.g., FlashFlow showed that Tor underestimates relay capacity by ~50 % under current measurement methods.
- The Tor Project merged with the Tails OS project in 2024 to unify development and strengthen anonymity tooling.
- Efforts to block Tor in Russia and censor it in certain regions persist; Tor employs bridges and obfuscation to maintain connectivity.
Tor Visits and Engagement
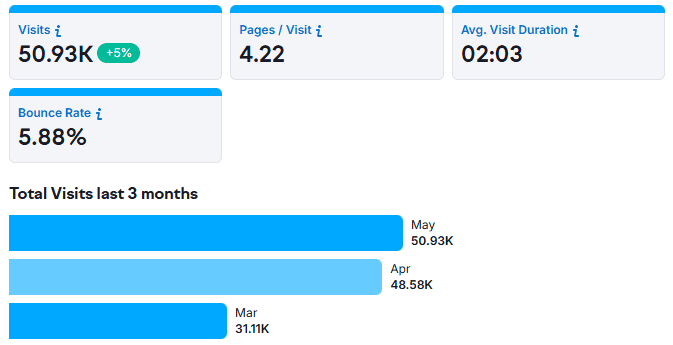
- 50.93K visits in May 2025, showing a +5% growth compared to April.
- 48.58K visits recorded in April 2025.
- 31.11K visits in March 2025, highlighting strong month-over-month growth.
- Users view an average of 4.22 pages per visit, reflecting consistent engagement.
- The average visit duration is 2 minutes 03 seconds, indicating meaningful interaction.
- Bounce rate is only 5.88%, showing highly engaged Tor visitors.
User Statistics
- The Tor Metrics “Users” table estimates users by analyzing client requests to relays and bridges.
- Russia often leads in mean daily user counts, sometimes >10,000 users.
- The U.S. typically claims 15–21 % of global Tor users.
- Germany and Finland regularly appear in top user shares, e.g., Germany ~12–13 %.
- India, France, the Netherlands, and the UK consistently appear among the top 10 user nations.
- The share of users engaging hidden services (.onion sites) is ~6.7 % daily.
- Gender and age breakdowns are less reliably documented, but one source suggests 75 % male, 25 % female among Tor users.
- Another report indicates the 25–34 age group comprises the largest user segment.
Daily Active Tor Users
- Multiple sources converge on ~2.5 million daily active users in 2025.
- In some earlier reports, “over 2 million” daily users were cited for prior years.
- Of those, the vast majority (~85 %) browse regular websites via Tor, not .onion ones.
- Daily engagement with hidden services is estimated at 6.7 %.
- Usage spikes tend to align with events such as censorship pushes or news on surveillance.
- Some nations report steep growth in Tor adoption when local internet restrictions intensify.
- Seasonal variation (e.g., around protest periods) influences usage patterns.
- Measurement uncertainties remain, especially in regions where Tor is blocked or partially censored.
Usage by Country
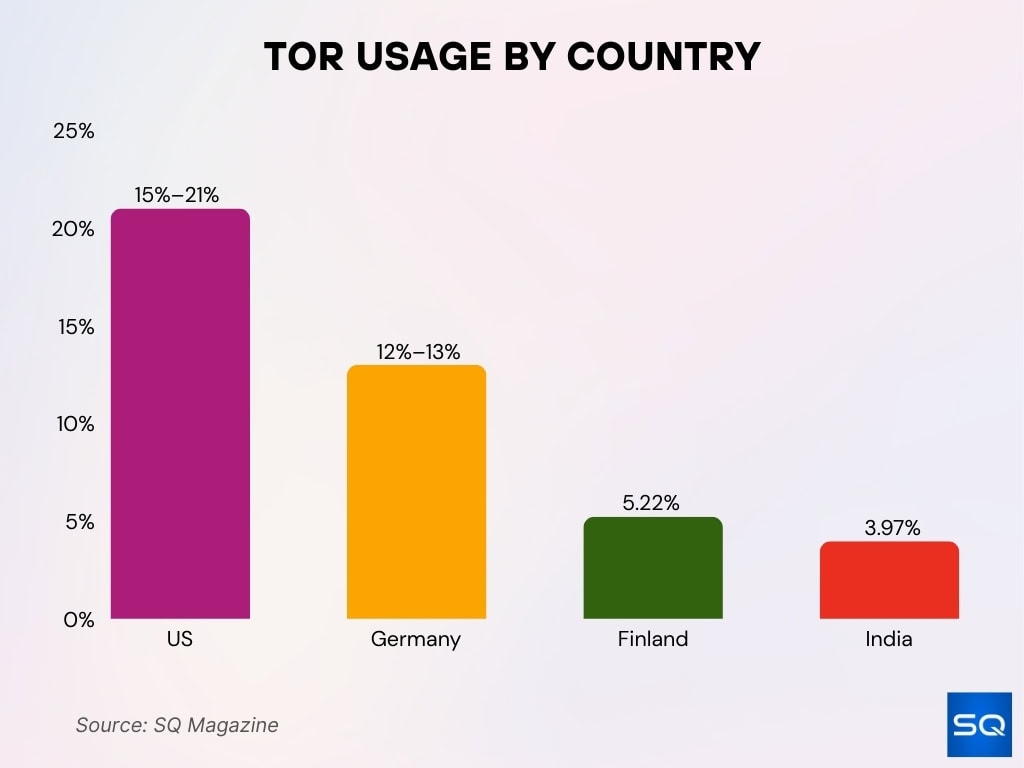
- The U.S. holds a large fraction, often between 15 % and 21 % of global users.
- Germany’s share is often cited in the 12–13 % bracket.
- Finland appears in top rankings, e.g., 5.22 % of daily users.
- India accounts for ~3.97 % of daily users in some reports.
- Russia frequently leads in the mean daily Tor user count.
- France, the Netherlands, the UK, Indonesia, and Iran show consistent participation in top-tier lists.
- Combined, the U.S. and Germany sometimes account for over 68 % of global Tor traffic share.
- National censorship efforts can suppress local usage, making official data an undercount in repressive states.
Bridges Statistics
- Tor Metrics has recorded around 1,800 to 2,200 bridges active at various times in recent years.
- Bridge usage spikes significantly when public relays are blocked in a given country, e.g., China.
- Directory requests through bridges are recorded per country; Tor Metrics maintains a “bridge‑table” for this purpose.
- In censored nations, bridge adoption rates sometimes grow by factors of 50–70x during crackdowns.
- Bridges use pluggable transports, e.g., obfs4, meek, to evade detection.
- Some bridge users cease using a bridge after it becomes blocked or flagged.
- Bridge distribution is uneven; some countries see many bridge users, while other censored nations virtually zero bridge use.
- Bridge reliability and uptime are generally lower than public relays, since many are volunteer-run or home-hosted.
Tor Onion Services Statistics
- Tor Metrics tracks unique version-3 .onion addresses that relay reports while acting as directories.
- A recent study collected ~54,602 onion addresses and found that 38% were advertised only once.
- In that study, 42.74% of onion addresses were advertised 2–5 times, and 16.45% more than 5 times.
- Researchers found that 50% of addresses were listed solely via public websites, 6% solely on the dark web, and 44% on both surfaces.
- Temporal activity data showed that 67% of addresses were “predominantly active,” 7% intermittent, and 26% mostly inactive.
- Among protocols used by hidden services, HTTP appeared in 99.75%, SSH in ~4.95%, and HTTPS in ~0.64%.
- Most onion services ran only one protocol, while ~6% ran between 2 and 8 protocols.
- Dark web studies reported substantial growth of onion services, ranging from tens to hundreds of thousands of onion domains.
Relay Network Size
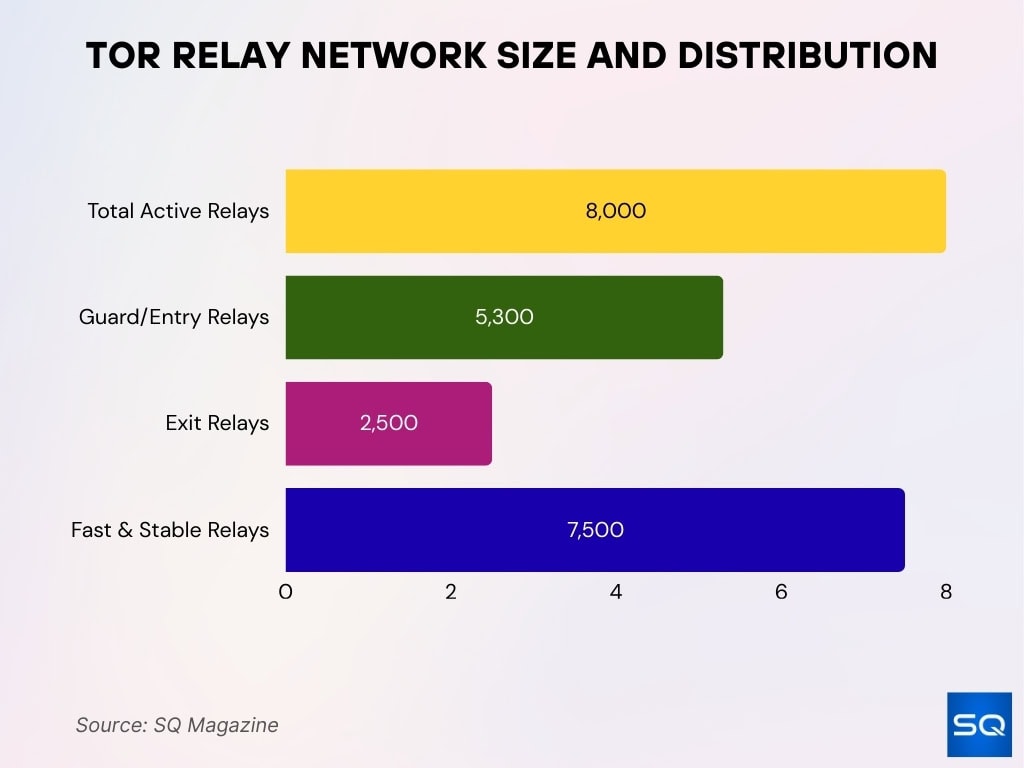
- As of July 2025, the Tor network runs around 8,000 active relays.
- Of those, about 5,300 act as guard/entry relays and 2,500 as exit relays.
- Over 7,500 relays are flagged as “fast and stable.”
- Historical studies indicate that in 2022, Tor had ~6,559 relays.
- Relay bandwidth has seen notable growth over time, with periods of 50–70% increases.
- Relays are distributed across fewer Autonomous Systems (ASes) than before, reducing diversity at the network level.
- Relay operators tend to plateau; many new relays appear, but retire quickly due to cost or maintenance burden.
- The overall relay growth is slower now, with more emphasis on capacity rather than sheer count.
Number of Unique .onion Addresses
- As per Tor Metrics, the unique v3 onion addresses are tracked daily via directories.
- The figure of ~54,602 onion addresses is used in studies for advertisement metrics.
- A significant share (38 %) are single‑advertisement addresses.
- Roughly 43 % are advertised 2 to 5 times.
- 16–17 % appear more than 5 times, indicating a more robust presence.
- Temporal classification, about two‑thirds remain active over time.
- The rest lapse or become stale, reflecting high churn in hidden services.
- Evolution of v2 to v3 migrations affected total counts historically.
Browser Download Statistics
- In 2024, Tor Browser exceeded 200 million downloads cumulatively.
- Daily downloads in earlier periods hovered around ~100,000 per day.
- Windows remains the primary platform for Tor Browser downloads.
- macOS and Linux make up smaller shares of download traffic in the total count.
- Mirror and distribution traffic adds to the visible download count beyond direct site downloads.
- Update requests (“update pings”) are also counted and provide insight into the active user base.
- Regional locale breakdowns show that the US and EU locales dominate download sources.
- Growth trends, year-over-year increases in new downloads are modest, suggesting saturation in some regions.
Tor.com Website Traffic Sources
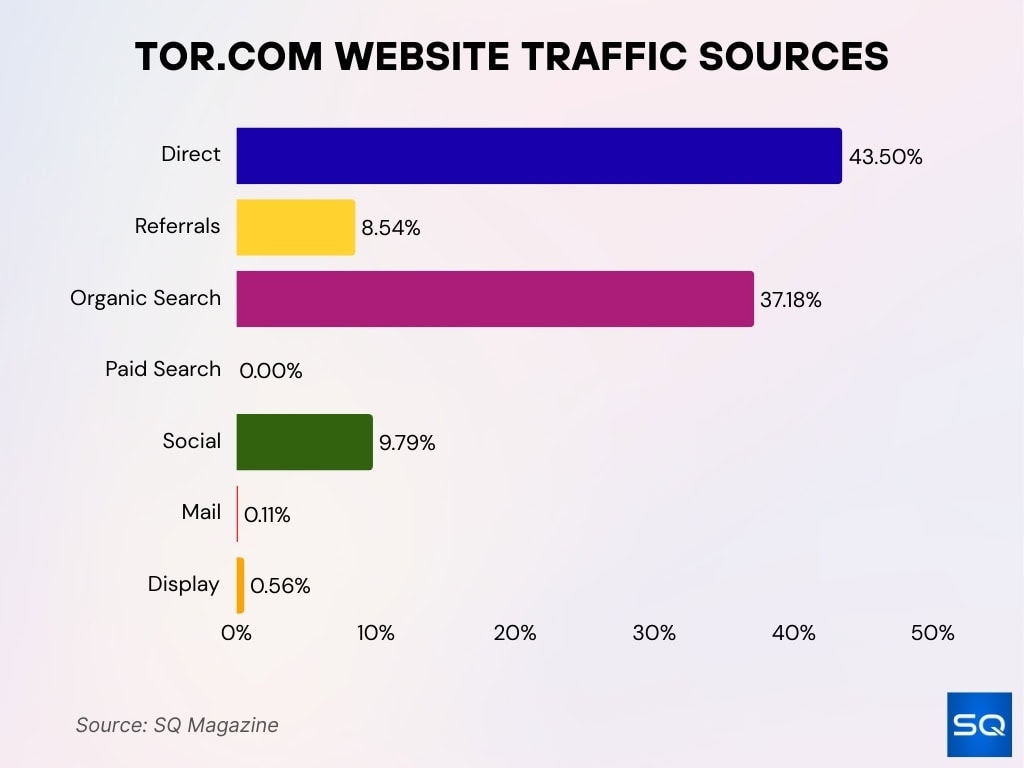
- Direct traffic leads with 43.50%, showing that most users visit Tor.com by entering the site directly.
- Organic search contributes 37.18%, highlighting strong visibility in search engines.
- Social traffic accounts for 9.79%, reflecting active engagement through social platforms.
- Referrals make up 8.54%, showing the role of external sites driving visits.
- Display ads bring in 0.56% of traffic, while email contributes just 0.11%.
- Paid search is at 0.00%, indicating no reliance on paid search campaigns.
Usage Trends Over Time
- Tor user counts have generally trended upward over the past decade.
- Spikes coincide with political or censorship events, e.g., protests, government blocks.
- Hidden service counts saw sharp jumps around 2020 when v2 to v3 transitions occurred.
- Relay counts grew strongly until the mid‑2020s, then stabilized around the 7,000–9,000 range.
- Bridge usage grows in surges, not smooth growth.
- Traffic volumes (bytes transferred) have varied, influenced by network expansions and attacks.
- Application usage (browser downloads + updates) rose early but now grows more slowly.
- Protocol-level shifts, e.g., pluggable transports, reflect adaptation to blocking and detection pressures.
Application Usage Statistics
- Tor Browser remains by far the most used application, accounting for > 90 % of client traffic over Tor.
- The OnionShare file‑sharing tool, used for anonymous file exchange, shows growing adoption among activists.
- Messaging protocols, e.g., XMPP over Tor, Signal over Tor, represent a small but increasing share of traffic in censored regions.
- Cryptocurrency services, especially Bitcoin mixing or coinjoin services, use Tor to obscure source/destination relationships.
- Proxying standard HTTP/HTTPS traffic via Tor is still dominant over specialized apps.
- APIs and hidden service backends, e.g, dashboards, control panels, contribute to background traffic on various ports.
- Some anonymity‑focused email gateways run exclusively as onion services.
- Occasional use of Tor for SSH tunnels or remote administration appears in network scans.
Bandwidth by Country
- Tor Metrics reports the aggregate relay bandwidth and “advertised bandwidth” by relays.
- In the relay bandwidth distribution, Germany leads in relay capacity among countries.
- Many relay operators in EU nations, e.g., France, the Netherlands, also contribute major bandwidth shares.
- The U.S. remains a strong contributor of capacity via relays, especially large hosted nodes.
- Only ~14 country codes historically supplied more than 1 % of bandwidth, indicating concentration.
- In recent years, bandwidth growth has outpaced node count growth.
- Some smaller countries with high connectivity, e.g. Netherlands, punch above their weight in capacity.
- IPv6 relays’ advertised bandwidth is tracked, but currently forms a minority share of total capacity.
Network Performance Metrics
- The FlashFlow measurement framework found that Tor underestimates true relay capacity by ~50 % under current measurement systems.
- FlashFlow experiments suggest traffic misbalance, Tor’s built‑in balance errs by 15–25 %.
- Using FlashFlow instead of TorFlow leads to 15–37 % faster median transfer times on sample sizes.
- Load balancing accuracy improves, median error drops by 86 % using FlashFlow.
- Timeout rates for small transfers drop, and the standard deviation decreases using a more precise measurement.
- Exit node performance is a key bottleneck for throughput, particularly for high-demand services.
- Circuit latency varies by region and relay placement; longer circuits often incur more delay.
- Tor continues to refine directory protocols and consensus intervals to reduce overhead and jitter.
Tor Usage for Illicit Activities
- Roughly 6.7 % of Tor users connect daily to hidden services for illicit or “dark web” pages.
- That percentage equals ~1 in 20 users engaging with illicit content on a given day.
- Many onion sites host marketplaces, forums, and file‑sharing for illicit goods or contraband.
- One study of 400 .onion domains found ~45 % contained illegal content.
- Bitcoin transactions tied to Tor services are sometimes traced via public blockchain and exit node correlation.
- Law enforcement periodically seizes large illicit platforms, arresting operators and users.
- Nonetheless, the majority of Tor traffic is not illicit; users often browse surface websites privately via Tor.
- Illicit use is a small but high-visibility fraction; debates continue over privacy vs abuse trade-offs.
Frequently Asked Questions (FAQs)
Tor sees over 2 million daily users accessing the network.
Approximately 1.5 % of total Tor traffic goes to hidden/.onion services.
Roughly 6.7 % of Tor users connect daily to Onion/Hidden Services that are disproportionately used for illicit purposes.
The United States accounts for about 21.43 % of daily Tor users.
FlashFlow reduces traffic weight error by 86 % compared to TorFlow.
Conclusion
The Tor network remains a dynamic, evolving system balancing anonymity, censorship resistance, and performance. From ~8,000 relays contributing to a geographically weighted bandwidth matrix, to the ~6.7 % user share engaging in illicit hidden service activity, the picture is nuanced. Bridges sustain access in censored regions, while exit nodes continue to draw scrutiny. Network metrics show room for optimization; better measurement (e.g., FlashFlow) can reduce latency and improve load balance. In a world increasing in surveillance pressure, Tor’s metrics tell a story of resilience and adaptation.


