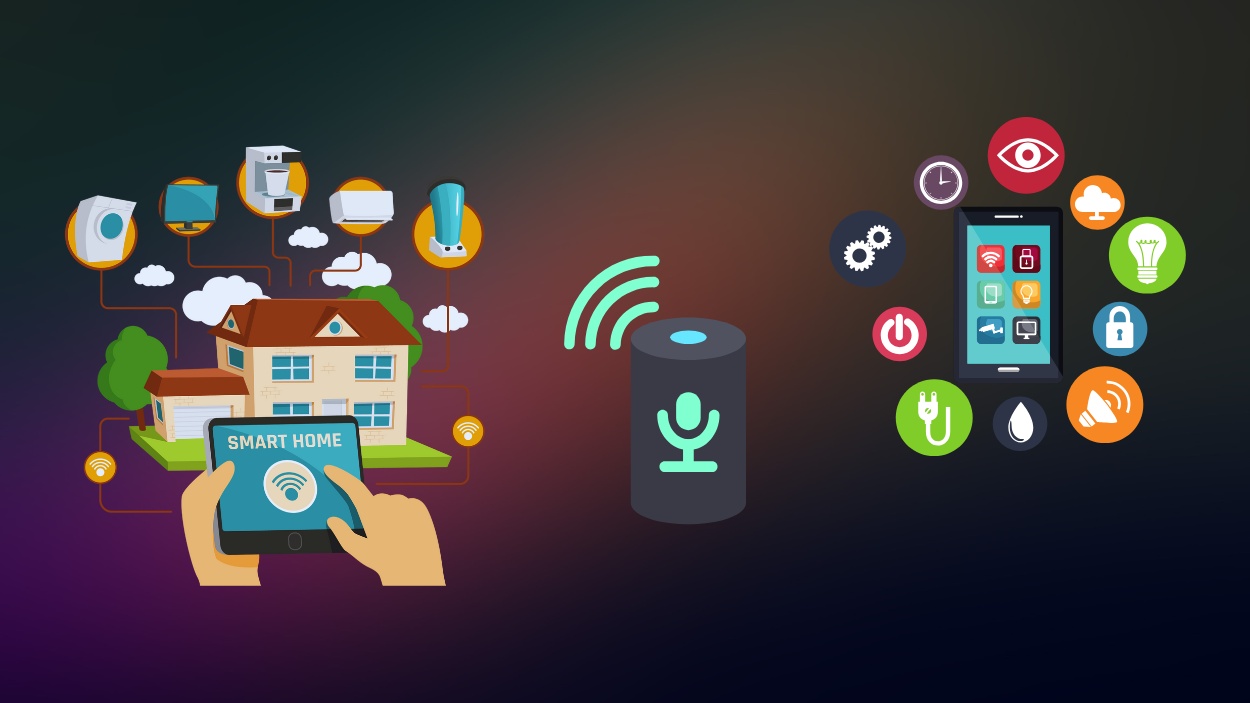
Imagine walking into your home and the lights gently brighten to your preferred setting, your coffee machine starts brewing, and your security system disarms, all without lifting a finger. This isn’t science fiction. In 2025, it’s the daily reality for millions of households.
The smart home industry has matured rapidly in recent years, merging convenience, sustainability, and security into a seamless digital ecosystem. Whether you’re a tech-savvy homeowner or simply curious about connected living, the following data paints a clear picture of where smart home technology stands today, and where it’s heading.
Editor’s Choice
- 63%: Share of US households with at least one smart home device in 2025.
- 38%: Growth in smart security systems installed in US homes compared to 2023.
- 72 million: Number of smart speakers in use across American households in 2025.
- 44%: Portion of homeowners under age 35 who use multiple smart devices daily.
- $2,500: Average annual spending per smart home user on devices and automation services.
- 56%: Share of global consumers citing energy savings as the top reason for adopting smart home tech.
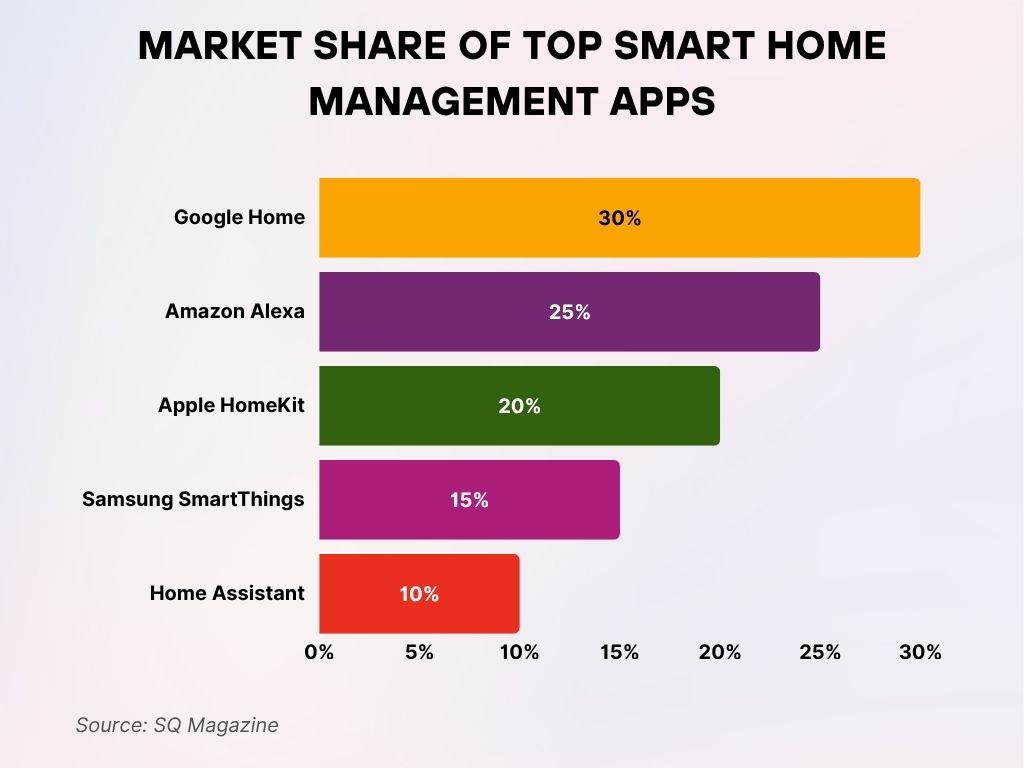
Market Share of Top Smart Home Management Apps
- Google Home leads the market with a 30% share, making it the most popular smart home management app in 2025.
- Amazon Alexa holds a strong second place with a 25% market share.
- Apple HomeKit accounts for 20% of the market, continuing its growth among iOS users.
- Samsung SmartThings captures 15% of the market, maintaining a steady presence in the smart home space.
- Home Assistant rounds out the top five with a 10% market share, appealing to tech-savvy and privacy-conscious users.
Popular Smart Home Devices
- Smart speakers remain the most common device in the US, with 72 million households owning at least one in 2025.
- Smart TVs are present in 71% of connected homes, often bundled with voice assistant integration.
- Smart thermostats are now installed in 28% of US homes, contributing to both comfort and energy savings.
- Robot vacuum cleaners are owned by 25% of households in 2025, with pet owners leading adoption.
- Smart plugs and outlets have seen a 31% adoption rate due to ease of use and energy tracking.
- Smart doorbells are installed in 33% of homes, with Ring and Google Nest being the most popular brands.
- Indoor security cameras are used by 29% of connected households for monitoring pets and packages.
- Smart lighting systems are found in 38% of smart homes, especially popular in open-concept living areas.
- Leak and moisture sensors have grown to 14% adoption as homeowners become more risk-aware.
- Smart locks now secure 22% of homes, offering keyless entry and remote control.
Usage Statistics
- 84% of smart home users in the US control their devices using mobile apps regularly.
- 68% of smart home interactions in 2025 are initiated via voice assistants.
- 37% of users automate lighting routines, especially for energy efficiency and bedtime transitions.
- 56% of households with smart devices use remote monitoring when away from home.
- 29% of users customize their thermostat schedules weekly based on weather and work routines.
- 22% of users leverage geofencing features to activate devices based on location.
- 41% of smart home users engage in routine-based automation, such as morning wake-ups and evening wind-downs.
- 19% of users connect their devices through IFTTT or similar platforms to expand functionality.
- 61% of smart home users sync devices with smartphones, followed by 32% using tablets.
- 9% of users connect their smart home ecosystems with wearables, particularly smartwatches.
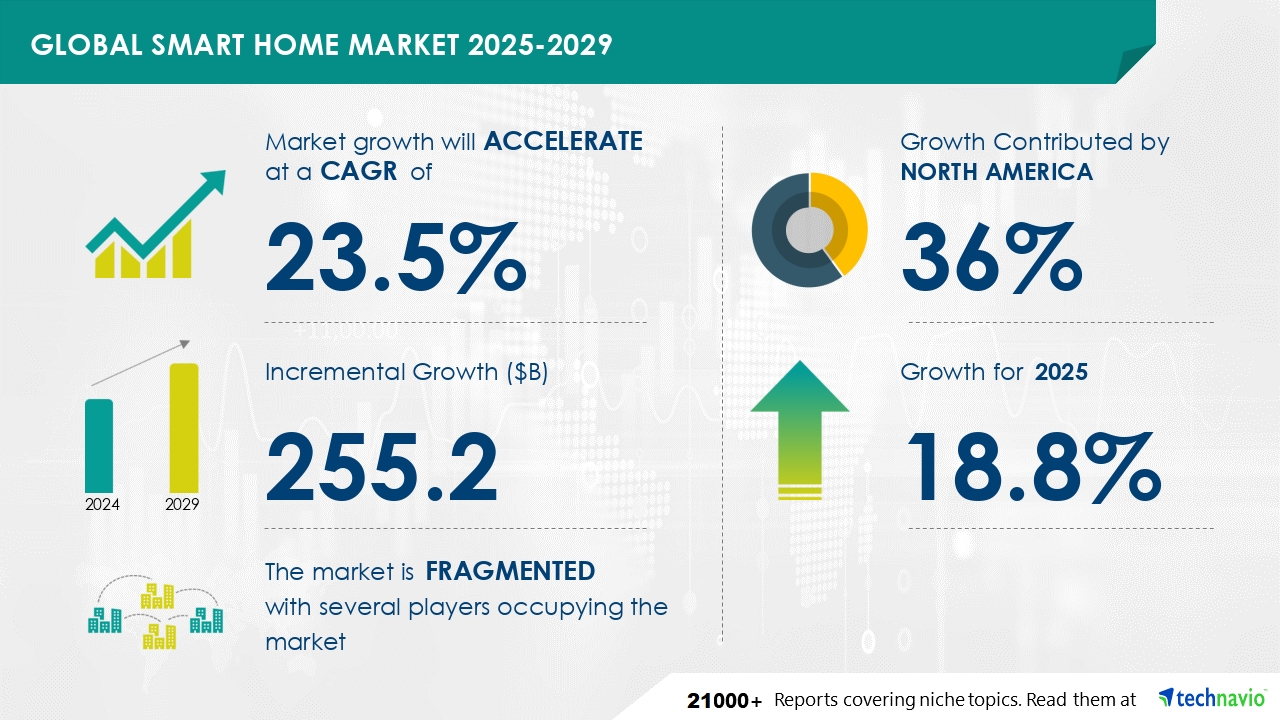
Global Smart Home Market Forecast
- The market is projected to grow at a CAGR of 23.5% from 2025 to 2029.
- Incremental growth over the forecast period is expected to reach $255.2 billion.
- North America will contribute approximately 36% of the total market growth.
- In 2025 alone, the market is set to grow by 18.8%.
- The industry remains fragmented, with several key players competing for market share.
Consumer Demographics and Smart Home Adoption
- 65% of US smart home users are under the age of 45, reflecting high tech affinity among millennials and Gen Z.
- 44% of homeowners aged 25–34 have installed three or more smart devices.
- 52% of male consumers report active interest in smart home tech, compared to 47% of female consumers.
- Households with children under 12 are 1.7x more likely to adopt voice assistants and smart cameras.
- 78% of first-time home buyers in 2025 consider smart home readiness a major purchase factor.
- Higher-income households (earning over $100,000 annually) are 2.3x more likely to adopt full smart home systems.
- 26% of users live in urban apartments, where smaller square footage boosts the utility of automation.
- 38% of adopters are repeat buyers upgrading from legacy smart devices.
- 29% of smart home users say their primary motivation was security, followed by energy savings.
- 62% of new smart home device users say they were influenced by friends, family, or neighbors.
Benefits and Motivations
- 56% of global users cite energy efficiency as the top reason for adopting smart home devices.
- 47% of consumers value the convenience of controlling devices from anywhere.
- 39% prioritize home security, especially in suburban and rural areas.
- 33% of homeowners adopt devices to support elderly family members, enabling safer aging in place.
- 28% of users are driven by automation and scheduling capabilities to streamline routines.
- 23% of smart home adopters want to reduce utility bills, especially heating and electricity.
- 18% choose smart devices for their sustainability benefits, such as managing carbon footprint.
- 14% are motivated by tech enthusiasm, enjoying innovation and gadget ecosystems.
- 9% of households mention insurance discounts as a reason for adopting smart home security systems.
- 5% adopt smart homes for eco-certification goals, particularly in new builds or renovations.
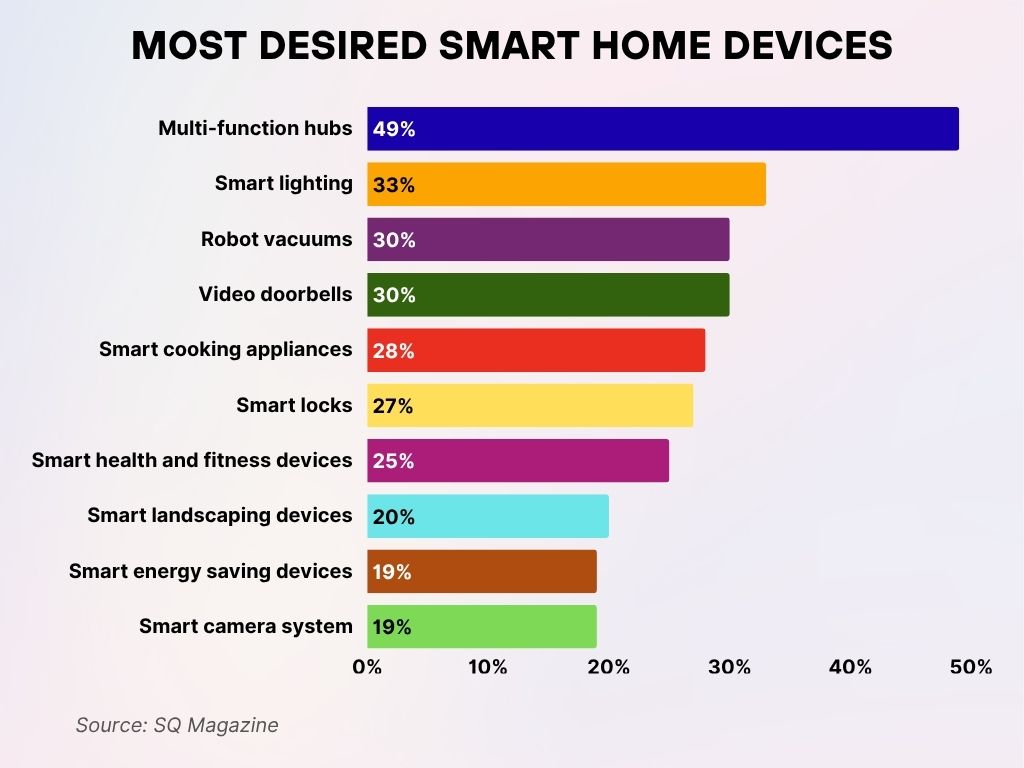
Most Desired Smart Home Devices
- 49% of consumers want multi-function hubs, making them the most in-demand smart home device.
- 33% are interested in smart lighting, highlighting its popularity for ambiance and energy efficiency.
- Both robot vacuums and video doorbells are desired by 30% of users for convenience and security.
- 28% prefer smart cooking appliances, reflecting rising interest in connected kitchens.
- 27% are looking for smart locks to enhance home security.
- 25% desire smart health and fitness devices, linking wellness to home tech.
- 20% are interested in smart landscaping devices for outdoor automation.
- 19% want smart energy-saving devices, showing concern for energy efficiency.
- Another 19% of users prioritize smart camera systems for surveillance and safety.
Spending and Revenue
- The average annual spending per smart home user in the US reached $2,500 in 2025.
- Total consumer smart home spending in the US is expected to exceed $60 billion by the end of the year.
- Security systems represent 33% of smart home-related spending in 2025.
- Entertainment systems, including smart TVs and speakers, account for 25% of device revenue.
- Home energy systems like smart thermostats and plugs make up 19% of the total market share.
- Smart kitchen appliances saw a 21% increase in sales year-over-year, led by voice-controlled ovens.
- Installation and integration services generate $8.6 billion in revenue in 2025.
- Subscription services for cloud storage and AI analytics (security and routines) now exceed $3.2 billion.
- DIY smart home kits account for 16% of market revenue in 2025, reflecting growing consumer tech confidence.
- Corporate smart home solutions, targeting property developers and hotel chains, are projected to generate $5.5 billion.
Leading Smart Home Brands and Companies
- Amazon leads the US market with 34% smart device penetration via its Alexa ecosystem.
- Google Nest commands 27% of the US market, focusing on energy, video, and voice integration.
- Apple HomeKit devices are used by 18% of households, with strong appeal among iOS-exclusive users.
- Samsung SmartThings controls 8% of the market, popular among Android users and multi-device homes.
- Ring, owned by Amazon, dominates the video doorbell category with 64% market share.
- Ecobee holds 15% of the smart thermostat market in the US, gaining ground on Google Nest.
- Arlo is a top contender in security cameras with 12% of the market in 2025.
- TP-Link’s Kasa Smart and Wyze Labs continue to grow, especially in budget-conscious households.
- ADT and Vivint remain leading providers in the professional smart security system market.
- Philips Hue dominates smart lighting with 70% brand recall among surveyed users.
Changing Consumer Shopping Behavior and Expectations
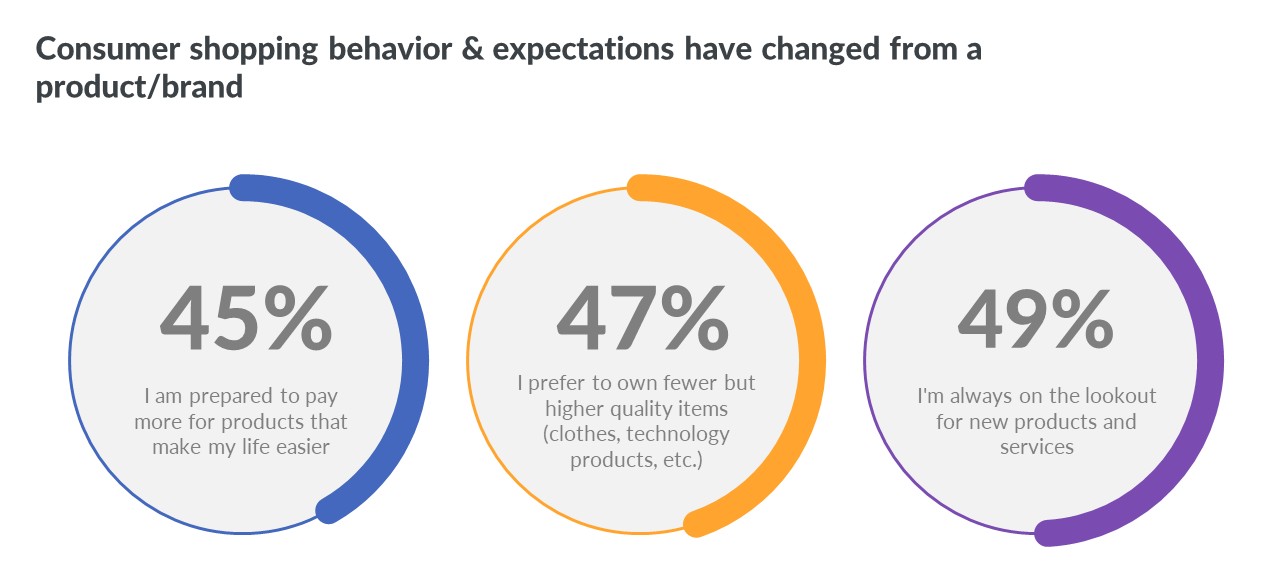
- 49% of consumers are actively looking for new products and services, indicating a high level of brand curiosity.
- 47% prefer to own fewer but higher quality items, such as clothes and tech products.
- 45% are willing to pay more for products that make their lives easier, showing a strong focus on convenience.
Energy Efficiency Statistics
- 56% of smart home adopters report lower energy bills after installing connected devices.
- Smart thermostats reduce heating and cooling energy use by an average of 18% per household.
- 22% of new homes in the US built in 2025 include solar-integrated smart energy systems.
- Smart lighting solutions are estimated to cut lighting-related energy consumption by 30% in connected homes.
- 8.4 billion kWh of energy were saved globally in 2025 due to smart home automation.
- Smart plugs and switches can reduce phantom load energy waste by 15–20%.
- 41% of users set automated schedules for lights, appliances, and HVAC for optimized energy savings.
- Thermostat geofencing features help save 7–12% more on energy costs compared to manual settings.
- Smart energy dashboards are now used by 19% of households to track real-time usage.
- IoT-integrated HVAC systems led to a 12% increase in overall HVAC efficiency in 2025.
Security Trends
- 38% of US households had smart security cameras installed in 2025.
- 33% of homes use video doorbells.
- 24% of households subscribe to cloud video storage services for home monitoring.
- Smart locks saw a 22% adoption rate in 2025, often integrated with door sensors and access logs.
- 52% of homeowners report feeling significantly safer with smart home security systems.
- 22 million households use motion-sensing lights to deter intruders automatically.
- 14% of security-conscious users have adopted facial recognition systems for smart entry.
- Home break-ins in areas with high smart home adoption decreased by 19% from 2022 levels.
- Cybersecurity concerns remain, with 31% of users citing privacy as a top issue.
- 87% of users configure custom alerts and zones, showing demand for user-driven control.
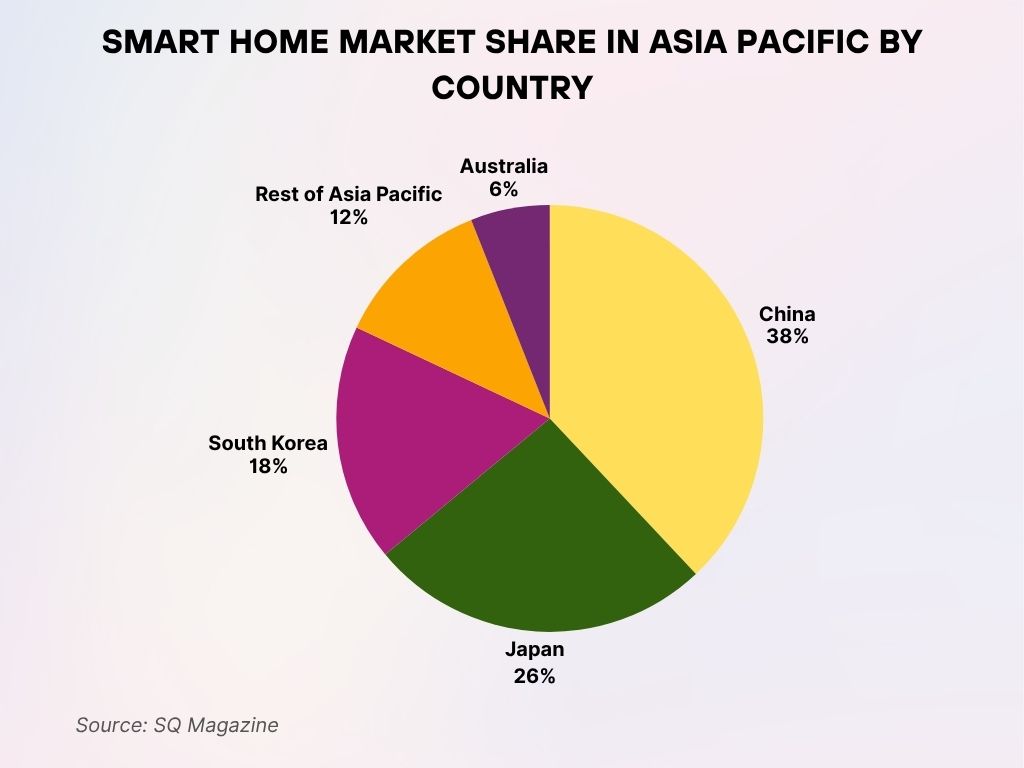
Smart Home Market Share in Asia Pacific by Country
- China dominates the region with an estimated 38% market share, leading the Asia Pacific in smart home investment.
- Japan holds around 26% of the market, showing strong adoption of connected technologies.
- South Korea contributes approximately 18%, driven by its tech-savvy population.
- The Rest of Asia Pacific accounts for about 12%, reflecting steady but varied growth across developing markets.
- Australia makes up the remaining 6%, representing the smallest share among the major contributors.
Entertainment Statistics
- 71% of connected households use smart TVs, the highest among all entertainment devices.
- Smart speakers are used daily by 58% of owners for music, news, or voice assistant queries.
- 32% of users control their home entertainment systems via mobile or voice commands.
- 28% of users integrate streaming services (like Netflix or Spotify) with home automation routines.
- 19% of households use multi-room audio systems, powered by Wi-Fi-connected speakers.
- 23% of users say smart devices have increased family engagement around entertainment.
- 14% of smart home setups include gaming automation like adaptive lighting or auto-boot consoles.
- 12 million US homes use projector-based smart theaters with voice control.
- Time-of-day automation for dimming lights and launching shows is used by 26% of users.
- Sound personalization based on room layout is active in 11% of smart home sound systems.
Smart Home Healthcare Integration Statistics
- 18% of US homes use health-related smart devices, including air quality monitors and sleep trackers.
- 7.5 million households use smart wearables linked to in-home monitoring systems in 2025.
- 13% of homes have fall detection sensors installed, mostly for elderly care.
- 22% of aging adults (65+) live in homes equipped with health-monitoring smart tech.
- Smart pill dispensers saw a 28% increase in adoption from 2023 to 2025.
- Connected bathroom scales and blood pressure cuffs are in 9% of households.
- 17% of smart home users link devices with telemedicine apps for regular check-ins.
- Circadian lighting for improved sleep and mood is used in 12% of smart homes.
- AI-powered reminders for medication and hydration are enabled in 6% of households.
- $4.3 billion is the estimated value of the smart health tech segment within the home ecosystem in 2025.
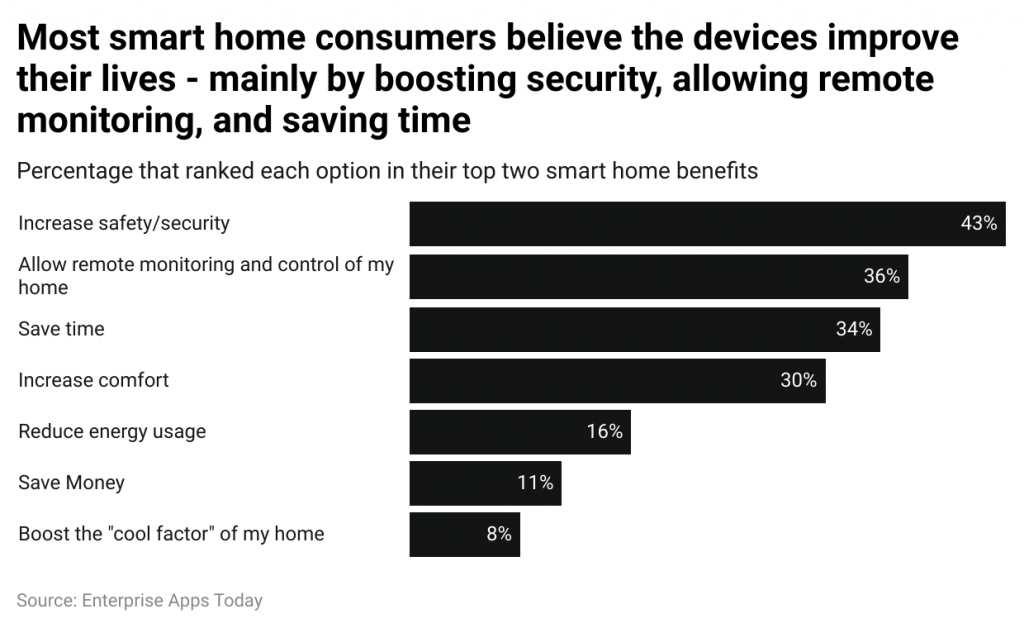
Top Benefits Consumers Expect from Smart Home Devices
- 43% of consumers say smart devices increase safety and security, making it the most valued benefit.
- 36% appreciate the ability to remotely monitor and control their home.
- 34% choose time-saving as a top smart home advantage.
- 30% value increased comfort brought by automation.
- 16% highlight reduced energy usage as a key benefit.
- 11% say smart devices help them save money.
- Only 8% consider the “cool factor” as a main reason for adopting smart home technology.
Challenges (Privacy, Security, Connectivity)
- 31% of users cite data privacy concerns as a major barrier to full smart home adoption.
- 26% have experienced device connectivity issues, especially with cross-brand integration.
- 18% are worried about unauthorized data access, particularly with voice and video devices.
- 16% of households report difficulty managing firmware and software updates for multiple devices.
- 24% of consumers avoid smart devices due to a lack of interoperability.
- 19% say network security risks keep them from adopting more advanced automation.
- 14% of users have experienced false alarms from motion sensors or AI misidentification.
- 9% of smart homes experienced at least one cyber breach attempt in 2024–2025.
- 5% cite limited internet bandwidth as a limitation in remote areas.
- 22% of homeowners believe smart homes should have industry-wide privacy regulations.
Impact of Smart Homes on Real Estate
- 78% of homebuyers in 2025 prefer listings with pre-installed smart home tech.
- Smart-equipped homes sell 8.5 days faster on average than traditional homes.
- 35% of real estate agents report that smart features increase a property’s value by $5,000–$10,000.
- 22% of home sellers upgrade their homes with smart security or thermostats before listing.
- 60% of millennial buyers consider smart homes “essential” for modern living.
- Smart condos in urban markets command 4–6% higher rent compared to standard units.
- Home staging companies now use temporary smart lighting and voice systems in 41% of high-end listings.
- 12% of US residential developments in 2025 are fully smart-integrated from the ground up.
- Buyers under 35 are 2.1x more likely to walk away from a listing that lacks smart capabilities.
- Mortgage lenders in some markets offer green or smart home incentives, reducing rates by 0.25%.
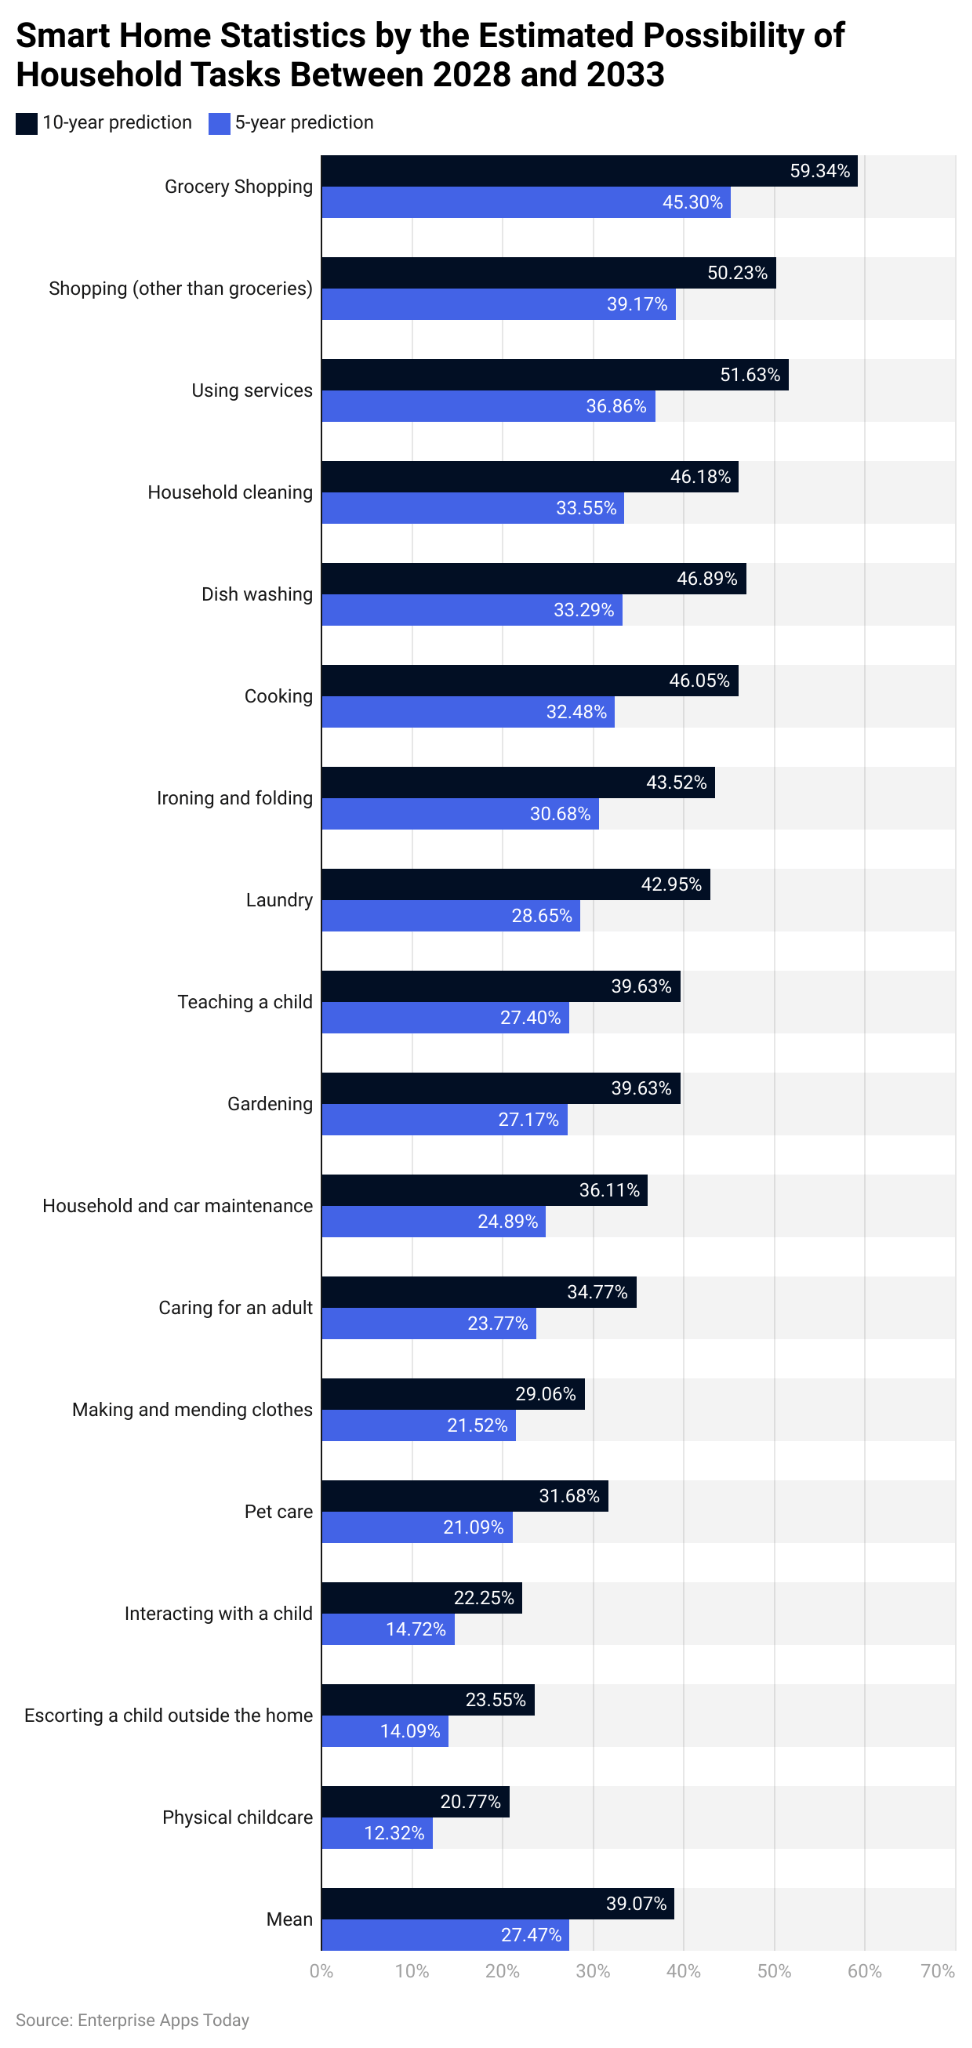
Smart Home Task Automation Predictions
- Grocery shopping is the most likely to be automated, with 59.34% expecting it within 10 years and 45.30% within 5 years.
- Using services and shopping (non-grocery) follow closely, with 51.63% and 50.23% 10-year predictions, respectively.
- Tasks like dish washing (46.89%), cooking (46.05%), and household cleaning (46.18%) show strong automation potential in the next decade.
- Over 40% believe tasks such as laundry, ironing, and teaching a child can be automated within 10 years.
- Gardening and car maintenance automation are predicted by 39.63% and 36.11%, respectively, in 10 years.
- Caring for an adult (34.77%) and pet care (31.68%) also show moderate automation expectations.
- Lower predictions are seen for interacting with a child (22.25%), escorting a child outside (23.55%), and physical childcare (20.77%).
- The average predicted automation rate is 39.07% for 10 years and 27.47% for 5 years, indicating steady growth in household task automation.
Government Incentives and Smart Home Policies
- 11 US states now offer rebates for installing energy-efficient smart thermostats.
- Federal incentives allow up to $600 in tax credits for qualifying smart energy equipment.
- $1.2 billion in funding has been allocated through DOE programs to support smart grid integration.
- California mandates that new homes be solar-ready with smart energy control panels.
- Illinois and New York offer credits for home battery storage connected to smart home networks.
- Home insurance discounts of up to 15% are available for users with certified smart security systems.
- National cybersecurity frameworks were expanded in 2025 to include IoT smart home devices.
- Energy Star now certifies select smart home products, guiding consumers toward efficient choices.
- Public housing upgrades in select US cities now include smart thermostats and lighting as standard.
- Smart Home Readiness Ratings are being piloted in 2025 for real estate appraisals in three states.
Recent Developments & Forecast Projections
- Voice assistant accuracy has improved to 95%, reducing false triggers and misinterpretations.
- AI personalization engines for automation routines are used by 21% of users in 2025.
- Wi-Fi 7 rollouts enable faster, more reliable device connectivity in dense smart environments.
- Smart furniture (e.g., beds, desks) now makes up 6% of the total device category.
- AI-powered HVAC systems are projected to reduce energy usage by 20% by 2028.
- Matter 1.2 adoption reached 40% in 2025, promoting better device interoperability.
- Edge computing in smart homes is expected to rise, cutting latency and cloud reliance by 15–18%.
- Global adoption rate forecast to reach 30% by 2028, up from 22.4% in 2025.
- Tech giants are investing heavily in privacy-preserving machine learning, expected to dominate smart home AI by 2026.
Conclusion
Smart homes in 2025 are no longer an early adopter’s novelty; they’re a global norm reshaping how we live, secure, and manage our environments. Driven by demand for energy efficiency, convenience, and intelligent automation, smart devices have entered every room and every age group.
But adoption is not without its complexities. Privacy, connectivity, and standardization remain challenges, especially as systems grow more advanced. Yet, with accelerating market growth and government backing, the smart home revolution is set to embed itself even deeper into the foundation of modern living.
For consumers, brands, and policymakers alike, 2025 represents a turning point, where smart living isn’t just the future, it’s the present.

