Imagine a coffee shop in downtown Chicago in early 2025. A young professional scrolls through her phone while waiting for her cappuccino, toggling between an e-commerce app, a news site, and her email. Nearby, a retiree reads the same news on a laptop. This scene reflects the evolving tug-of-war between mobile and desktop usage, where preferences no longer fall along simple generational lines.
In today’s world, device choice isn’t just about convenience, it defines how users engage with content, shop online, and make decisions. As we step into 2025, understanding how mobile and desktop usage differ can help marketers, developers, and business owners meet users where they are.
Editor’s Choice
- Mobile devices account for 59.6% of all global web traffic as of Q1 2025.
- Desktop usage has declined by 7.2% year-over-year globally, now holding a 38.1% share.
- Tablets contribute just 2.3% to overall traffic, showing limited growth.
- Bounce rates on mobile are 12% higher than on desktops in 2025, indicating a continued gap in session engagement.
- Conversion rates on desktop (4.3%) still outpace mobile, which lags at 2.2%, despite rising traffic.
- In North America, mobile usage now dominates with 62% of internet time, while desktop accounts for 34%.
- Voice search queries are now initiated via mobile 75% of the time, reflecting increasing on-the-go engagement.
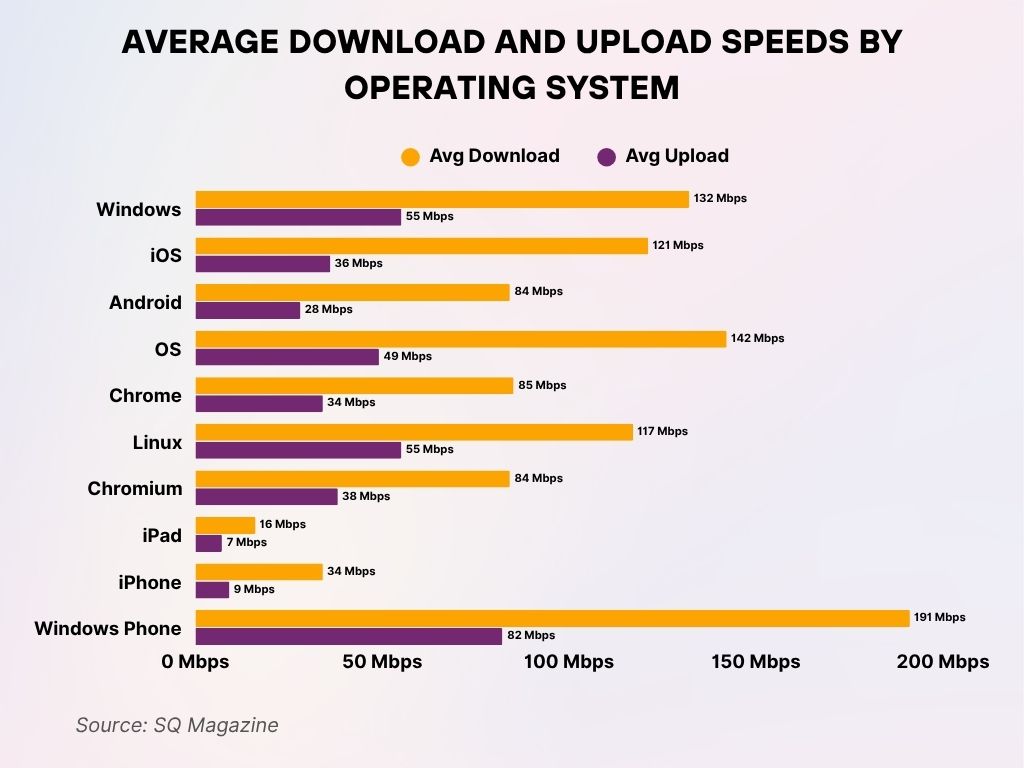
Average Download and Upload Speeds by Operating System
- Windows delivers an average download speed of 132 Mbps and an upload speed of 55 Mbps.
- iOS records an average download speed of 121 Mbps and an upload speed of 36 Mbps.
- Android sees a lower performance with 84 Mbps download and 28 Mbps upload on average.
- Generic OS leads most categories with a high 142 Mbps download and 49 Mbps upload.
- Chrome OS maintains solid speeds with 85 Mbps download and 34 Mbps upload.
- Linux matches Windows in upload at 55 Mbps, with 117 Mbps download.
- Chromium OS averages 84 Mbps download and 38 Mbps upload.
- iPad shows low bandwidth with 16 Mbps download and only 7 Mbps upload.
- iPhone fares slightly better with 34 Mbps download and 9 Mbps upload.
- Windows Phone surprisingly tops all platforms with 191 Mbps download and 82 Mbps upload, the highest in both categories.
Global Market Share: Mobile vs Desktop
- As of early 2025, mobile devices command 59.6% of web usage.
- Desktop usage dropped to 38.1%, compared to 41.2% last year, continuing a five-year downward trend.
- Asia-Pacific leads in mobile dominance, with mobile accounting for 71% of total internet traffic in the region.
- In contrast, Europe retains a balanced profile with mobile at 52% and desktop at 45%, showing slower adoption rates.
- Latin America experienced the highest mobile traffic surge, jumping 5.9% year-over-year in early 2025.
- In Africa, mobile usage now comprises 84% of all traffic, largely due to mobile-first infrastructure development.
- Tablet usage remains minimal across regions, never surpassing 4% in any major market.
User Behavior Trends by Device Type
- Mobile users tend to browse in shorter, more frequent bursts, averaging 4.8 sessions per day, compared to 2.1 on desktop.
- Desktop users still dominate weekday traffic during work hours, accounting for 64% of B2B site visits between 9 a.m. and 5 p.m.
- Mobile search sessions are more intent-driven, with 1.6x higher likelihood to include a location-based query.
- Scrolling depth is 33% higher on desktop, showing more in-depth exploration on larger screens.
- Abandonment rates for mobile carts in e-commerce are now at 83%, significantly higher than desktops’ 67%.
- Multitasking behavior is more common on desktops, where users often engage in dual-screen usage (e.g., video conferencing + browsing).
- Mobile users are more likely to act quickly; over 61% of searches from mobile result in an action (call, visit, or purchase) within an hour.
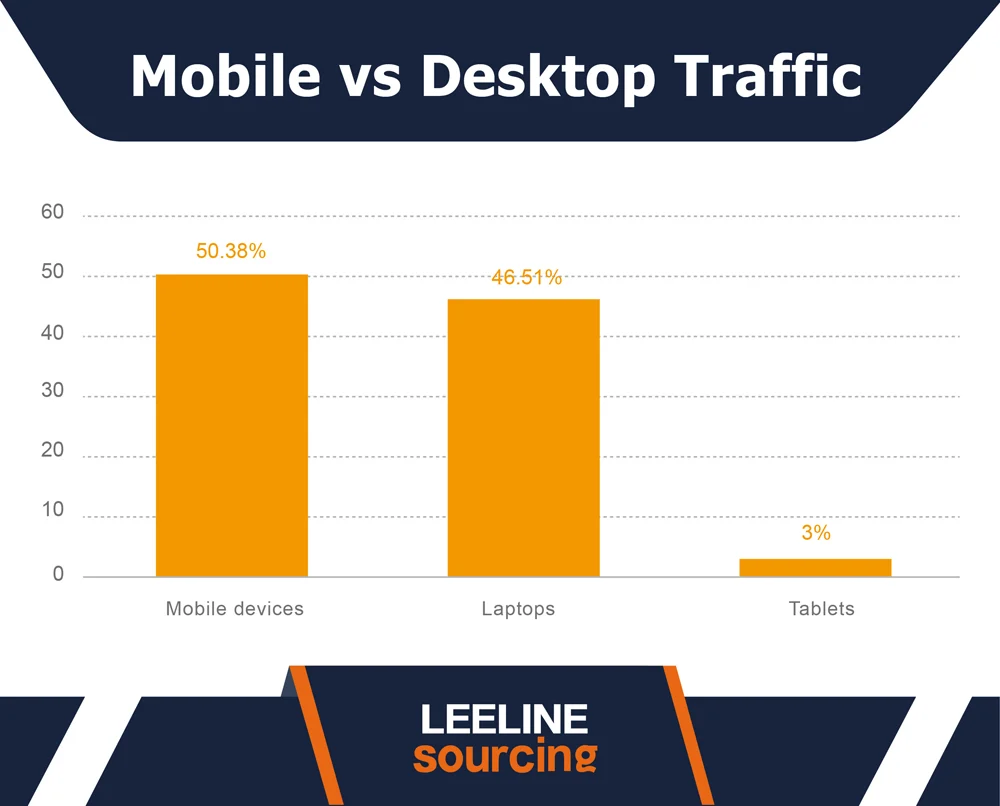
Mobile vs Desktop Website Traffic Share
- Mobile devices lead with 50.38% of total web traffic.
- Laptops (desktops) follow closely at 46.51%, indicating nearly equal usage.
- Tablets contribute a small share of just 3% to overall traffic.
The data shows that mobile-first design is essential as over half of users now access websites via smartphones.
Time Spent Online: Mobile vs Desktop
- In the US, average mobile screen time hit 4 hours 58 minutes daily in 2025.
- Desktop usage per user is declining, averaging 2 hours 16 minutes per day, a 10-minute drop year-over-year.
- Social media apps dominate mobile screen time, accounting for 36% of total usage, while desktops lean towards productivity tools and email.
- Streaming on mobile devices makes up 71% of all video consumption in 2025.
- Desktop remains the preferred medium for long-form content such as academic articles, where session times average 15 minutes, compared to 5.4 minutes on mobile.
- Gen Z users spend nearly 6.1 hours daily on mobile, surpassing all other generations.
- Mobile gaming now represents 49% of all gaming time, whereas desktop gaming holds steady at 42%.
Conversion Rates Comparison
- Desktop conversion rates lead in nearly all verticals, with an average rate of 4.3% versus 2.2% for mobile in 2025.
- In high-ticket e-commerce categories, desktop outperforms by over 2.5x, reflecting higher trust and ease of multi-tab comparison.
- Mobile conversions rise for food delivery, with rates as high as 6.1%, thanks to app-first design.
- Travel booking conversion rates remain low on mobile (1.4%) compared to desktop (3.9%), where a detailed comparison matters.
- The average checkout time on mobile is 40% longer than on desktop, often due to UX friction or smaller screens.
- One-click checkout features are now adopted on 54% of mobile sites, helping close the conversion gap.
- Desktop AOV (Average Order Value) remains higher, $122 vs $86 on mobile, driven by broader product browsing behavior.
- Abandonment triggered by form complexity is still twice as likely on mobile, despite streamlined autofill options in 2025.
Mobile vs Desktop Search Statistics
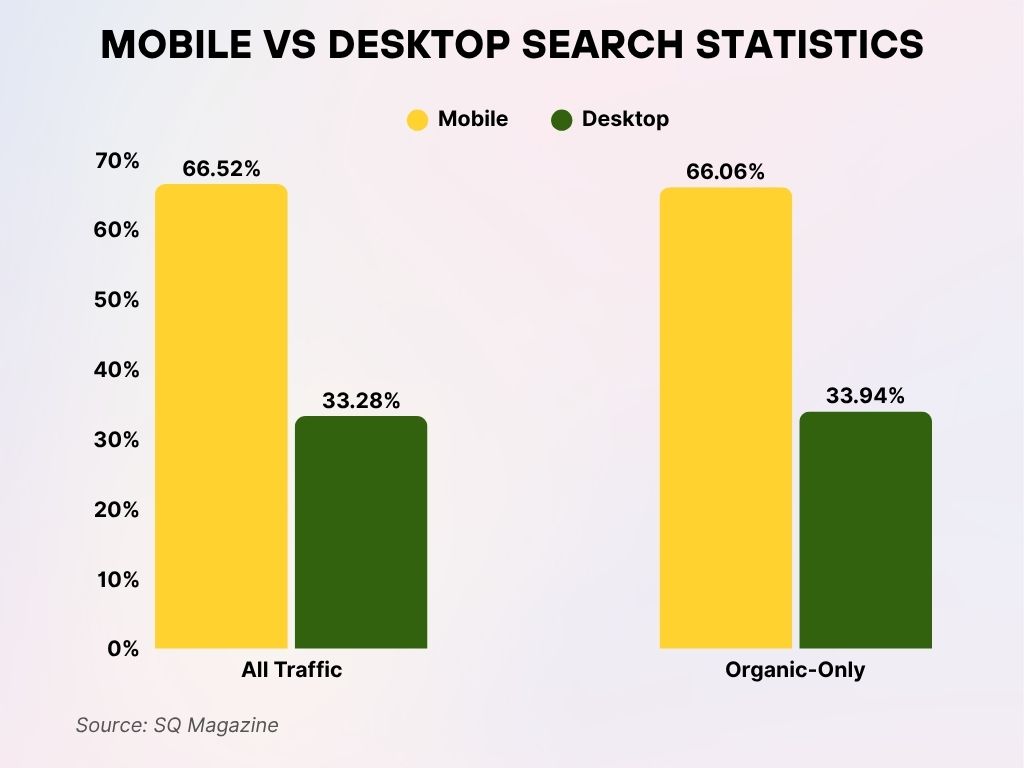
- Mobile devices account for 66.52% of all web traffic, showing dominant user behavior across platforms.
- Desktops contribute only 33.28% of all traffic, highlighting a mobile-first trend.
- When looking at organic search only, mobile still leads with 66.06%, while desktop holds 33.94%.
These stats reinforce the importance of mobile-optimized SEO and responsive design for search visibility.
Mobile vs Desktop Traffic Share by Industry
- In retail, mobile dominates with 72% of traffic, but only 46% of conversions, showing continued friction in mobile purchasing flows.
- Finance and insurance see 58% of traffic from desktops, as users prefer larger screens for detailed transactions.
- Healthcare platforms experience balanced traffic: 51% mobile vs. 47% desktop, with mobile dominating for appointment bookings.
- Media and entertainment sites report 80% mobile traffic, led by streaming and social discovery apps.
- Real estate browsing still favors desktop, holding 62% of visits, due to photo galleries, map interactions, and form filling.
- In education tech, desktops account for 67% of long-session users, especially for learning management system (LMS) access.
- Gaming platforms are seeing a shift, 54% of visits are now mobile, largely driven by freemium mobile game ecosystems.
- SaaS services see 74% desktop traffic, consistent with B2B environments focused on functionality and collaboration.
- Travel industry trends mobile in search (68% of visits), but sees desktop dominate for bookings and itinerary planning.
- Government and utility sites remain desktop-heavy, with 57% traffic share, due to forms and document-based interfaces.
Device Preferences Across Age Groups
- Gen Z (ages 10–27) uses mobile for 83% of digital time, particularly for social media, video, and quick tasks.
- Millennials (ages 28–44) show the most balanced use, with 63% mobile and 35% desktop, reflecting hybrid work and personal tech behaviors.
- Gen X (ages 45–60) prefers desktops for productivity and shopping, though mobile adoption has reached 62% for general browsing.
- Baby Boomers (ages 61–78) still lean toward desktop use (52% of online time), valuing screen size and familiarity.
- Gen Alpha, the emerging generation, now spends over 90% of screen time on mobile devices, including tablets.
- Work-from-home users aged 30–50 report 68% of work tasks on desktops, but mobile usage spikes after 6 p.m. for personal needs.
- Mobile-only users are more common among younger users: 45% of Gen Z and 36% of Millennials rarely or never use desktops.
- Older adults (65+) show increased mobile adoption, with 51% using smartphones as their primary device in 2025.
Devices Used to Access the Internet
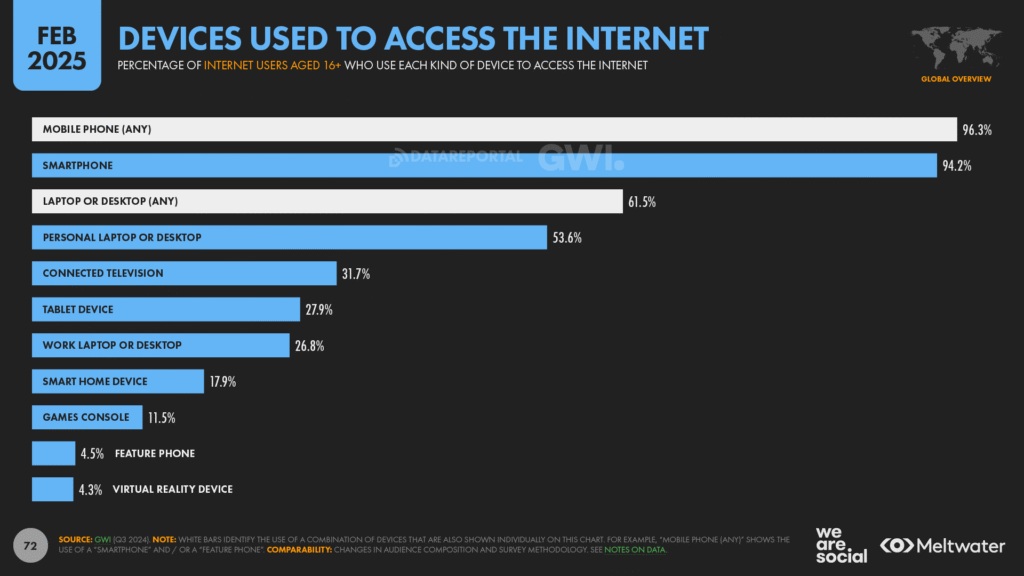
- 96.3% of internet users aged 16+ access the internet via any mobile phone.
- 94.2% specifically use a smartphone to go online.
- 61.5% use laptops or desktops (any type).
- 53.6% rely on a personal laptop or desktop.
- 31.7% access the internet through a connected TV.
- 27.9% use a tablet device.
- 26.8% go online via a work laptop or desktop.
- 17.9% use a smart home device to connect.
- 11.5% use a games console for internet access.
- Only 4.5% still use a feature phone, while 4.3% access the web through a virtual reality device.
E-commerce Engagement by Device
- Mobile now accounts for 70.2% of all e-commerce traffic.
- Desktop drives 57% of total e-commerce revenue, reflecting its higher conversion power.
- Fashion and apparel lead in mobile engagement, with 78% of visits and 47% of purchases coming from smartphones.
- In electronics, desktop dominates purchases, with an average AOV of $284 vs. $192 on mobile.
- Mobile cart abandonment remains high at 83.1%, thanks to better checkout flows.
- Voice-assisted purchases via mobile make up 6.4% of all mobile transactions, up from 4.2% last year.
- Mobile e-commerce app usage grew by 19% YoY, with top retailers seeing over 58% of sales originate from their apps.
- Mobile users are more responsive to personalized offers, with CTRs up to 2.3x higher than desktop on push notifications.
- Flash sales convert better on mobile, with 48% higher urgency-based conversion rates in time-limited events.
Mobile App Usage vs Desktop Web Browsing
- In 2025, users spend 87% of their mobile time in apps, with the remaining 13% on mobile browsers.
- Desktop users still rely on browsers for 91% of activity, especially for research, work, and formal interactions.
- News consumption is now predominantly mobile app-based, with 74% of users accessing content via dedicated news apps.
- Productivity tools like Microsoft Teams and Slack see 70% desktop usage, despite having strong mobile app counterparts.
- Mobile app users engage 2.4x longer per session compared to mobile web, reflecting smoother UX and personalization.
- Gaming apps make up 37% of all app time, while desktop browser-based gaming fell by 5% in usage.
- Mobile browsers are most used for on-the-go Google searches, price comparisons, and quick product lookups.
- Subscription services (e.g., streaming, fitness, meditation) report 81% of engagement from apps, not websites.
- Desktop browsing still leads for content creation (writing, video editing), which sees 72% activity on non-mobile devices.
Do Lead Magnets Boost Signup Rates?
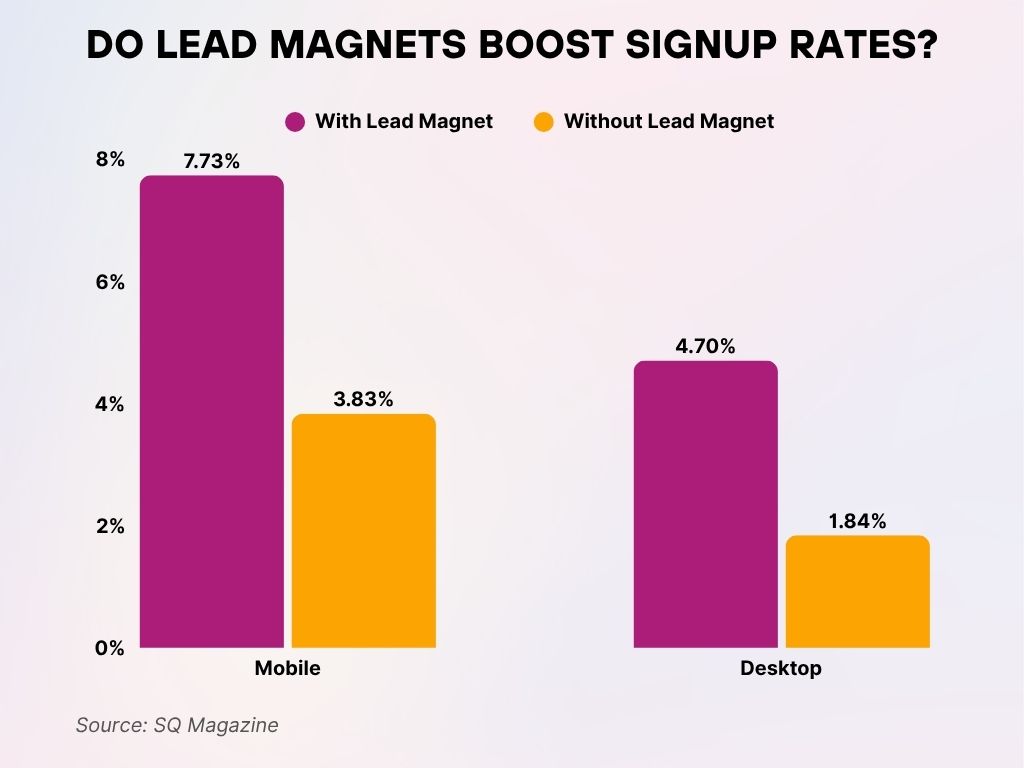
- On mobile devices, using a lead magnet increases email signup rates to 7.73%, compared to just 3.83% without one.
- On desktop, lead magnets drive 4.7% signup rates, more than doubling the 1.84% rate without them.
- Across both device types, lead magnets significantly improve signup performance, with mobile users responding more strongly than desktop users.
This highlights the effectiveness of lead magnets, especially on mobile platforms, in boosting conversion rates.
Advertising Performance by Device
- Mobile ad spend is projected to reach $389 billion globally in 2025, accounting for 73% of all digital ad spend.
- Desktop ads maintain higher CTRs in B2B sectors, with an average CTR of 1.9% compared to 1.2% on mobile.
- Mobile video ads outperform other formats, with completion rates at 85%, especially on social platforms.
- Programmatic ad placements are now 78% mobile-first, due to app-based inventory and behavioral data granularity.
- Desktop display ads show higher dwell times for industries like SaaS, legal, and finance.
- Mobile ads face more accidental clicks, especially in gaming and entertainment, affecting quality metrics.
- Retail brands see better ROAS (Return on Ad Spend) on desktop for high-value items, while mobile excels in retargeting.
- Mobile interstitial and native ads generate 3.5x higher engagement than banner ads, particularly within apps.
- Desktop PPC (pay-per-click) campaigns convert at higher rates for long-form landing pages and B2B lead gen.
Device-Based Bounce Rates and Session Duration
- Bounce rates on mobile average 54.3%, compared to 42.8% on desktop, reflecting quick-exit tendencies.
- Session duration on desktop is 3 minutes 46 seconds, while mobile lags at 2 minutes 19 seconds.
- Optimized mobile sites show a 22% reduction in bounce rates, highlighting the value of responsive design.
- AMP (Accelerated Mobile Pages) content shows 35% longer time-on-page than non-AMP mobile content.
- High-resolution product images increase bounce rates on mobile if not properly optimized, especially in retail.
- Session re-entry is more common on mobile, with users returning 2.1 times per day on average to resume browsing.
- Content-heavy sites such as blogs and research tools retain desktop users 64% longer than mobile users.
- Video autoplay on mobile leads to 18% higher early exits, suggesting a need for UX reconsideration.
- Page speed remains a top factor, every 1-second delay increases mobile bounce by 8.3% in 2025.
Smartphone Dependency by Income in the U.S.
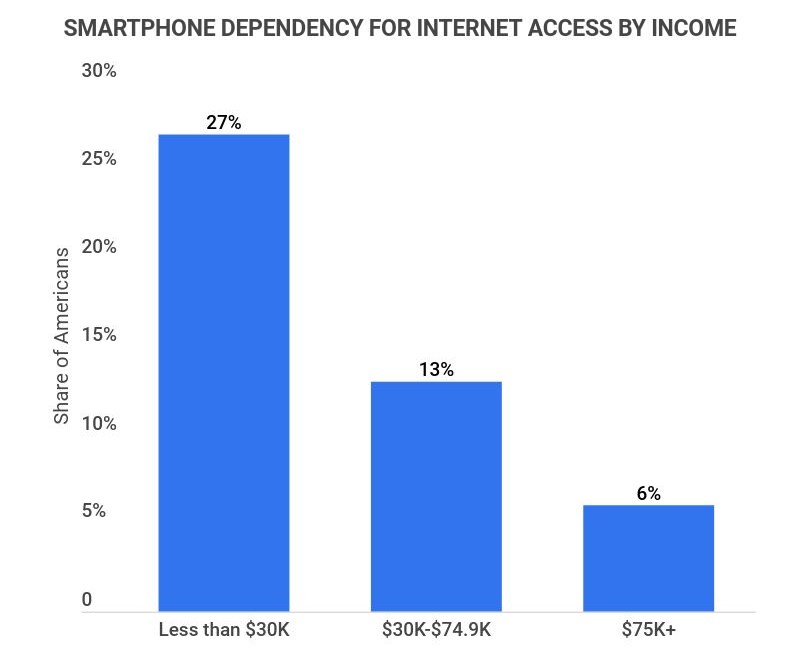
- 27% of Americans earning less than $30K rely on smartphones as their primary internet access.
- Among those earning $30K–$74.9K, 13% are dependent on smartphones for online connectivity.
- Only 6% of individuals with $75K+ income rely primarily on smartphones to access the internet.
The data reveals a clear digital divide, with lower-income groups significantly more reliant on mobile-only internet access.
Regional Differences in Device Usage
- North America sees a split of 62% mobile vs. 34% desktop, with mobile steadily gaining across all demographics.
- Europe maintains a more even balance, with mobile holding a 52% share and desktop at 45%, especially among professional users.
- In Asia, mobile is king, with 71% of traffic and the highest app adoption rates globally.
- Sub-Saharan Africa continues to be the most mobile-centric region, with mobile accounting for over 84% of traffic, due to lower PC access.
- Latin America mobile use jumped from 63% in 2024 to 69% in 2025, driven by growing smartphone penetration.
- Australia and New Zealand reflect high mobile usage (61%), but desktop use is higher for government services and health portals.
- India leads in mobile-only usage, with 41% of internet users accessing the web solely through smartphones.
- Japan and South Korea maintain stronger desktop usage (approx. 48%), especially in gaming and enterprise contexts.
- Middle Eastern countries show heavy mobile use in social and entertainment, while desktop still leads in financial and corporate services.
Mobile vs Desktop in B2B and B2C Environments
- B2B websites receive 68% of their traffic from desktops, reflecting task-focused engagement during business hours.
- B2C brands attract 74% of users via mobile, led by social commerce, app campaigns, and mobile-first advertising.
- Mobile drives top-funnel engagement in B2B but struggles with conversion; decision-makers prefer desktops for proposals, downloads, and demos.
- Content downloads (whitepapers, case studies) are 2.3x more likely to occur on desktop devices.
- E-commerce B2C transactions have shifted mobile-first, with 58% of checkouts on smartphones.
- Email open rates are 68% mobile across both B2B and B2C, but click-throughs remain stronger on desktop.
- Live chat and chatbots see better performance on desktop for B2B queries, with 30% longer session durations.
- App-based loyalty programs are driving mobile B2C re-engagement, especially in retail, food delivery, and wellness sectors.
- B2B webinars and virtual events have a 71% desktop attendance rate, reflecting user comfort with larger screens for content viewing.
Accessibility and Usability Differences
- Mobile UX issues account for 48% of user drop-offs, primarily due to misclicks, small CTA buttons, or slow load times.
- Desktop interfaces offer more customizable accessibility features, including screen reader compatibility and font resizing.
- Voice control features are now integrated into 56% of mobile apps, enhancing accessibility for visually impaired users.
- Color contrast and font clarity remain a challenge on mobile, particularly for older adults and users with visual impairments.
- Keyboard navigation is still preferred for users with motor disabilities, making desktops the go-to device.
- Dark mode adoption has increased by 38% on mobile apps, improving readability and reducing eye strain.
- Accessibility lawsuits in the U.S. rose 11% year-over-year, with many complaints tied to mobile web compliance gaps.
- Responsive design adoption reached 94% of major U.S. websites, ensuring better consistency across mobile and desktop.
- Gesture-based navigation on mobile apps is intuitive for younger users but confusing for older age groups.
Cybersecurity Concerns on Mobile vs Desktop
- Mobile phishing attacks surged 33% in 2025, with SMS-based scams being the most prevalent.
- Desktops remain more secure, with lower malware infection rates, thanks to enterprise-level firewalls and antivirus systems.
- Mobile app data breaches rose by 22% YoY, especially affecting financial, health, and retail apps.
- Two-factor authentication (2FA) is used on 67% of desktop logins, but only 48% of mobile app logins, creating a vulnerability gap.
- Public Wi-Fi attacks target mobile users more often, with 28% of incidents tied to unsecured connections.
- Mobile OS updates are less frequently applied; only 62% of users install updates within a week, versus 79% on desktops.
- Desktop users use password managers at twice the rate of mobile users, improving security hygiene.
- Biometric authentication (fingerprint/face ID) is now used in 68% of mobile banking apps, aiding both convenience and protection.
- Ransomware incidents still skew toward desktop environments, especially in corporate or hybrid work settings.
Recent Developments
- Google’s March 2025 Core Update prioritized mobile-first indexing, affecting over 41% of desktop-only sites in rankings.
- Apple’s iOS 18 introduced advanced cross-device integration, blurring the line between mobile and desktop workflows.
- Meta’s AI ad tools now optimize creatives differently for mobile vs desktop, increasing conversion rates by up to 23%.
- Samsung’s Galaxy Flex 3 introduced dual-mode usage, allowing seamless toggling between mobile app and desktop UI.
- Microsoft Edge’s adaptive layout now supports content fluidity between touchscreen laptops and mobile devices, enhancing accessibility.
- Progressive Web Apps (PWAs) gained momentum in 2025, with 31% of top retail brands shifting away from native apps.
- 5G rollout in rural U.S. areas boosted mobile accessibility, increasing mobile traffic by 15% in these zones.
- AI chatbots optimized for mobile UI saw a 40% increase in use across customer support touchpoints.
- VR headset interfaces now support mobile-powered browsing, reshaping both entertainment and shopping landscapes.
Conclusion
Mobile and desktop devices are no longer battling for dominance, they’re learning to coexist in distinct roles. In 2025, mobile is where attention lives, while desktop remains where action finalizes. Businesses that understand and respect this duality are better positioned to build experiences that convert, inform, and retain.
From conversion rates to user behaviors, and from regional trends to accessibility challenges, the divide is clear, but so is the opportunity. By designing with device-specific intent, brands can meet users where they are and where they’re going.


