On a quiet morning in Austin, a mother brews her coffee with a voice command, her fridge restocks groceries autonomously, and her car schedules its maintenance. Across the globe, an engineer in Tokyo monitors a factory floor via sensor data without leaving his apartment. This isn’t science fiction; it’s 2025, and the Internet of Things (IoT) has woven itself into the fabric of everyday life.
IoT is no longer just a buzzword; it’s a sprawling ecosystem reshaping how we live, work, and think. This article dives into the most current IoT statistics to help you grasp its scale, adoption, and implications in 2025.
Editor’s Choice
- The global IoT market value in 2025 is estimated to reach $1.52 trillion, showing a 12.3% compound annual growth rate (CAGR) since 2020.
- There are now 18.8 billion active IoT devices worldwide.
- Smart home devices account for 32% of all consumer IoT usage globally.
- In healthcare, IoT wearables have increased patient compliance rates by 47%.
- Industrial IoT (IIoT) now contributes to 60% of all new IoT installations, with manufacturing leading the charge.
- The average US household uses 21 IoT-connected devices, compared to 15 just two years ago.
- Cyberattacks on IoT endpoints have dropped by 18% due to advancements in edge security and AI-driven threat detection.
Top IoT Categories by Market Share
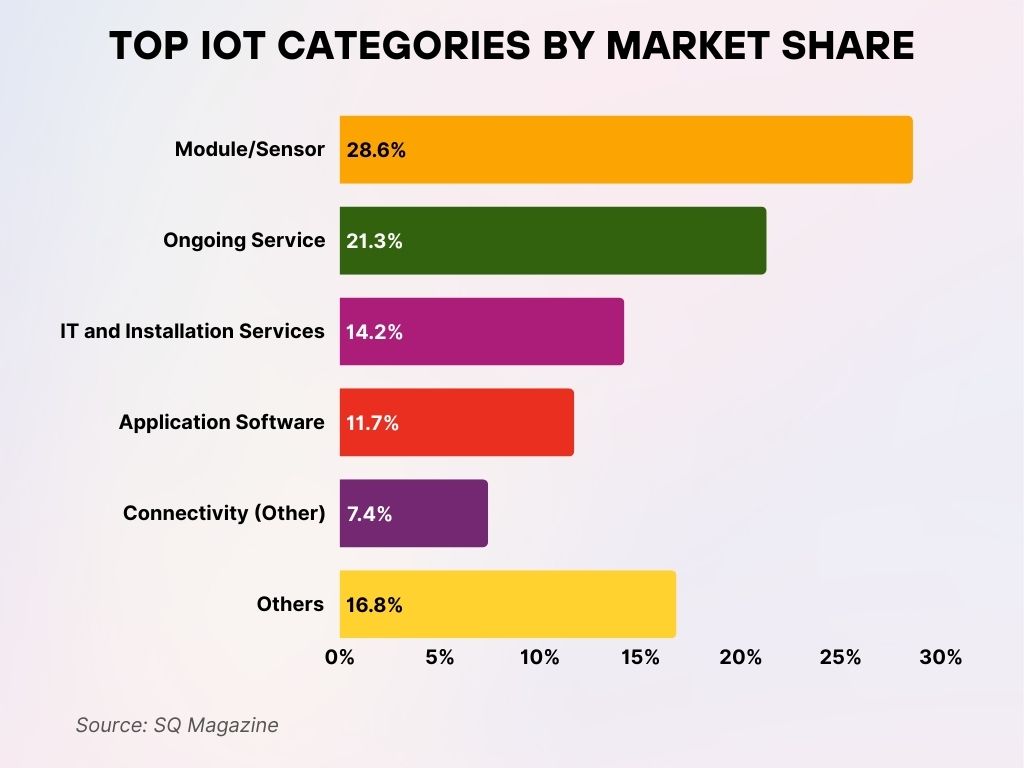
- Module/Sensor dominates the IoT market with a 28.6% share, highlighting its foundational role in device functionality and data collection.
- Ongoing Service accounts for 21.3% of the market, underlining the importance of continuous support and maintenance in IoT ecosystems.
- IT and Installation Services represent 14.2%, showing strong demand for infrastructure setup and deployment.
- Application Software captures 11.7% of the market, crucial for enabling smart functionalities and analytics.
- Connectivity (Other) holds 7.4%, covering various protocols and communication standards within IoT networks.
- Others collectively make up 16.8%, indicating a broad range of additional IoT components and services.
Global IoT Market Size and Growth Trends
- The IoT market in North America alone is expected to surpass $430 billion in 2025, making it the largest regional market.
- By the end of 2025, Asia-Pacific will account for 35% of the total IoT spending, driven by smart city projects in China, India, and Southeast Asia.
- Enterprise IoT investment has risen to $760 billion globally, with logistics and manufacturing dominating budgets.
- The global CAGR for IoT between 2020 and 2025 stands at 12.3%, slightly exceeding early projections of 11.7%.
- IoT software and services now account for 51% of all IoT revenue in 2025.
- Investment in IoT cloud platforms is projected to reach $120 billion by the end of 2025.
- Startup funding for IoT ventures hit $38.5 billion in 2025, a 14% increase over the previous year.
- Automotive IoT is the fastest-growing segment with a projected 17% CAGR, driven by autonomous vehicle integrations.
- IoT analytics platforms have seen an 8x increase in deployment compared to 2021, as companies leverage real-time data.
- Public sector IoT deployments are expected to reach a valuation of $168 billion in 2025, driven largely by smart infrastructure spending.
Number of Connected IoT Devices Worldwide
- As of early 2025, there are 18.8 billion connected IoT devices globally.
- The number of consumer IoT devices stands at approximately 10.9 billion, with Asia accounting for 42% of them.
- Business and industrial IoT devices number 7.9 billion.
- The average household globally now owns 14 IoT devices.
- Smartphones, smart TVs, and wearables remain the top 3 connected device categories by volume.
- IoT device penetration in urban regions has reached 83%, while rural areas are catching up at 56%.
- Global device interconnectivity is now supported by 5G in over 62% of IoT deployments.
- US homes with smart assistants have climbed to 72% in 2025, driven by improved NLP performance.
- Smart meters are now installed in 62% of global households.
- The device churn rate has decreased to 5.4% annually, suggesting improved reliability and lifecycle durability.
IoT in Energy Market Growth
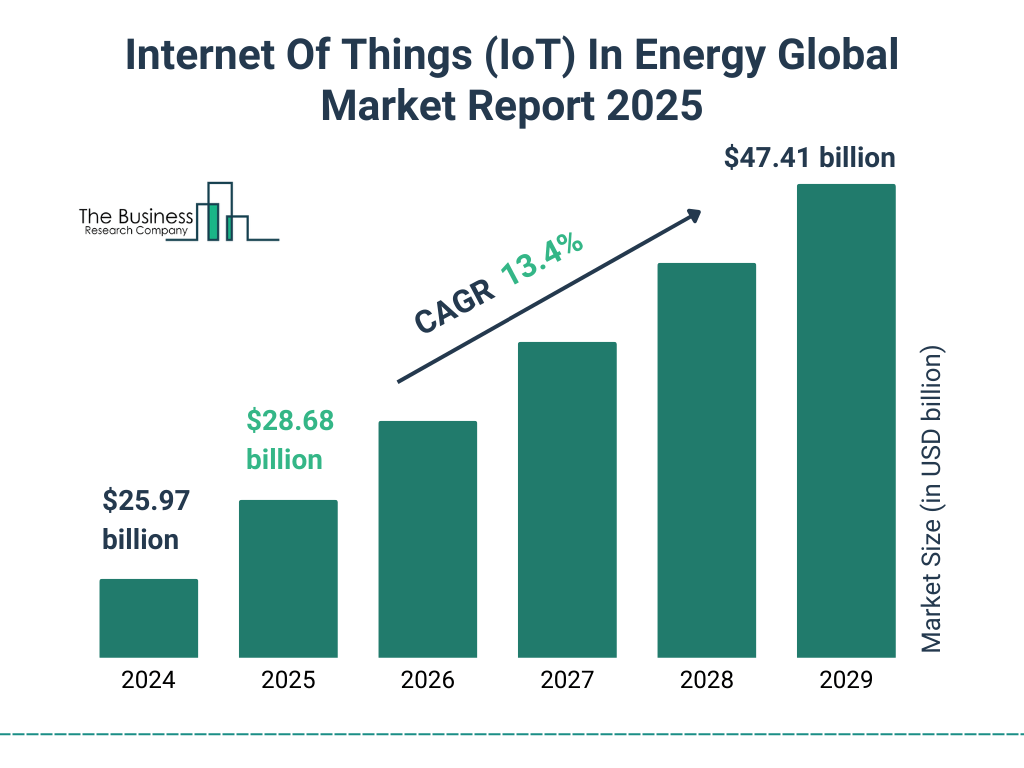
- The IoT in Energy market is projected to grow at a CAGR of 13.4% from 2024 to 2029.
- In 2024, the market was valued at $25.97 billion.
- By 2025, it is expected to reach $28.68 billion.
- The growth trend continues, hitting $47.41 billion by 2029.
Industry-Wise IoT Adoption
- Manufacturing is the largest IoT adopter in 2025, responsible for 34% of total IoT device deployments.
- Healthcare IoT usage has surged, with 89% of hospitals in developed nations using connected monitoring or diagnostics tools.
- Agriculture is experiencing a tech boom, with smart irrigation systems now implemented in 28% of farms globally.
- Retail sector IoT adoption has climbed to 61%, focused on inventory automation and customer behavior tracking.
- Construction industry IoT penetration reached 39%, driven by safety monitoring and resource management.
- Energy and utilities leverage IoT in 67% of grid systems worldwide.
- Educational institutions have embraced IoT in 44% of global campuses, using smart ID, asset tracking, and learning analytics.
- Transportation and logistics use IoT in 72% of fleet systems, focusing on route optimization and vehicle diagnostics.
- Hospitality industry IoT implementation grew to 58% in 2025, enabling automated check-ins, keyless entry, and occupancy sensing.
- Public sector adoption sits at 49%, emphasizing surveillance, waste management, and emergency services.
Consumer vs. Industrial IoT Usage
- In 2025, consumer IoT represents 58% of total device deployments, with smart homes and wearables driving demand.
- Industrial IoT (IIoT) now accounts for 42%, but delivers over 70% of IoT-generated data.
- Manufacturing and logistics sectors use an average of 3.1x more connected sensors per unit than retail or healthcare.
- The average spending per enterprise on IIoT is $2.3 million.
- Consumer IoT sees stronger growth in unit volume, while IIoT leads in monetization and operational ROI.
- Smartwatches and fitness trackers make up 38% of consumer IoT purchases in the US.
- In contrast, predictive maintenance and remote monitoring represent over 50% of IIoT use cases.
- Voice-controlled assistants are used in 71% of smart homes.
- The average factory floor now uses 178 IoT sensors per 10,000 square feet.
- Data sensitivity is a bigger concern for IIoT users: 78% of industrial deployments include custom encryption layers.
Global IoT Market Share by Sub-Sector
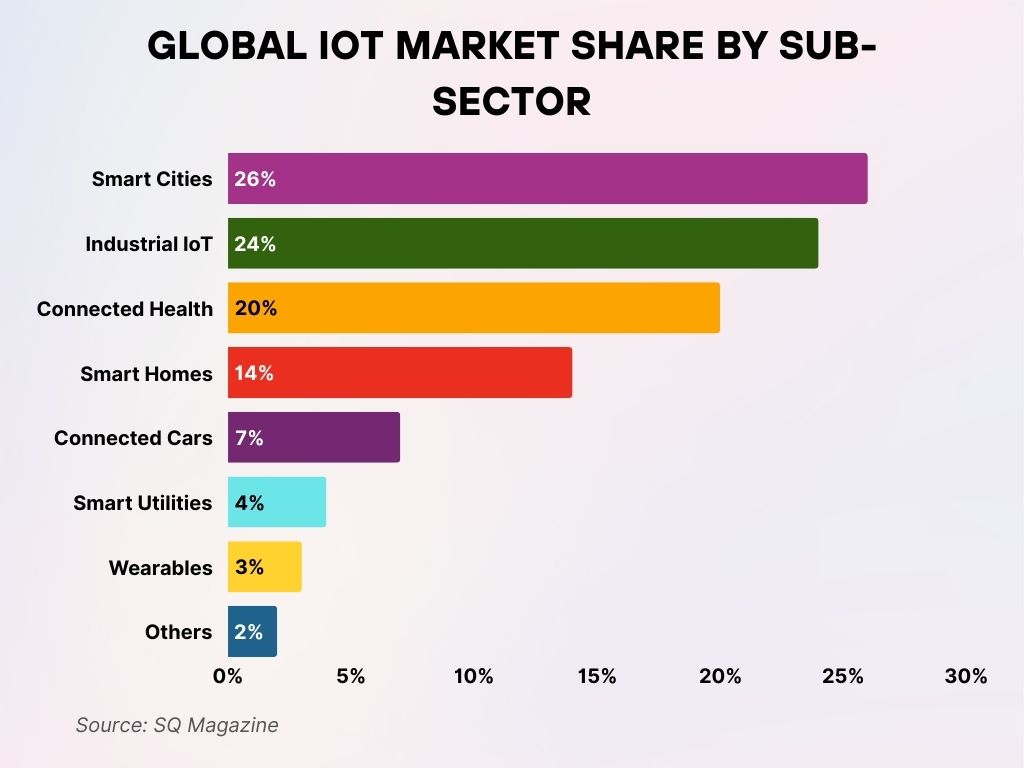
- Smart Cities lead the global IoT market with a 26% share, reflecting the rapid urban adoption of connected infrastructure.
- Industrial IoT follows closely at 24%, driven by smart manufacturing and automation technologies.
- Connected Health holds 20%, emphasizing the growth of remote monitoring and health-tracking solutions.
- Smart Homes account for 14%, showcasing the popularity of home automation and smart appliances.
- Connected Cars represent 7%, supporting advances in autonomous and internet-enabled vehicles.
- Smart Utilities take up 4%, covering smart grids and energy-efficient systems.
- Wearables hold 3%, including smartwatches, fitness trackers, and other personal IoT devices.
- Others make up the remaining 2%, comprising niche or emerging IoT applications.
IoT in Smart Homes: Penetration and Usage Rates
- 84% of newly built US homes in 2025 are equipped with some form of smart home system.
- The average US smart home uses 21.4 connected devices.
- Smart thermostats are the most common device, present in 68% of smart homes.
- Voice assistants (e.g., Alexa, Google Assistant) are in 71% of homes, marking a 20% adoption growth YoY.
- Smart security systems have penetrated 61% of households.
- The smart lighting segment grew by 18% YoY, fueled by rising energy efficiency mandates.
- Smart refrigerators and ovens now account for 9% of total smart appliances sold.
- US consumers spend an average of $1,275/year on smart home upgrades and subscriptions.
- 80% of smart home users report greater convenience, while 63% cite improved energy efficiency.
- Inter-device interoperability has improved, with 68% of households reporting seamless cross-brand functionality.
IoT Applications in Healthcare, Manufacturing, and Transportation
- Healthcare IoT devices exceeded 540 million units in 2025, with remote patient monitoring being the top use case.
- Telemedicine platforms integrated with IoT wearables now support daily care routines for 76 million patients globally.
- Hospital asset tracking with IoT has cut equipment search times by 41%, boosting emergency response efficiency.
- In manufacturing, predictive maintenance has reduced downtime by 28% on average.
- Automated quality control using IoT vision systems has improved defect detection accuracy to 97.2%.
- In transportation, fleet tracking IoT solutions now cover over 90% of logistics providers in the US.
- Connected public transit systems have seen a 31% improvement in on-time arrivals.
- Rail operators using IoT sensors for infrastructure monitoring report a 29% reduction in service interruptions.
- IoT-powered traffic lights and sensors are now live in 145 US cities, easing congestion by 12% on average.
- Aviation maintenance using IoT telemetry cut costs by $2.8 billion globally in 2025.
What People First Associate with the Term “Internet of Things”
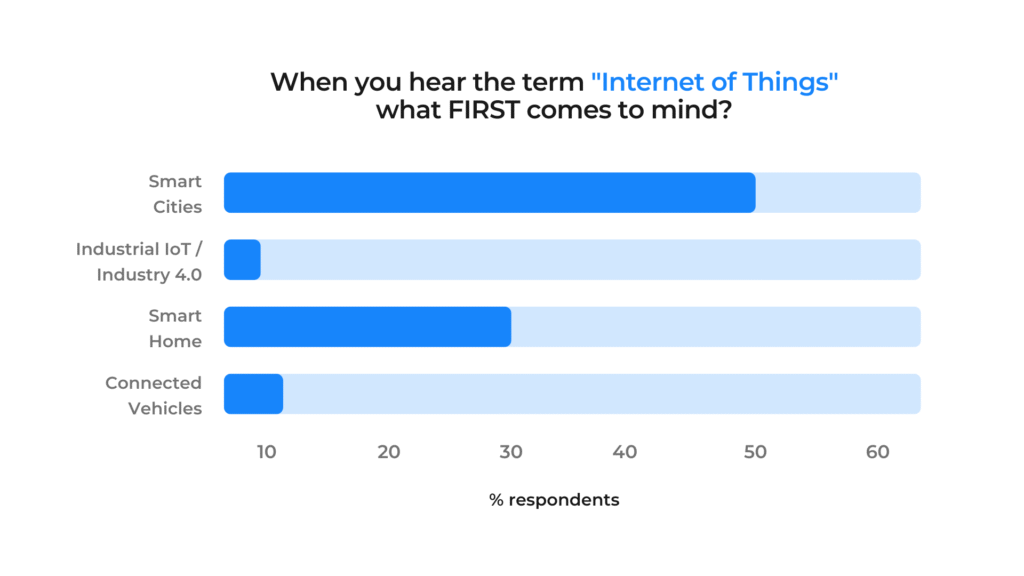
- Smart Cities are the top association, with nearly 50% of respondents thinking of them first when hearing “IoT”.
- Smart Homes come next, cited by around 30% of participants.
- Connected Vehicles are identified by approximately 10% of respondents.
- Industrial IoT / Industry 4.0 ranks lowest, mentioned by less than 10%.
This data reveals a strong public perception of IoT as primarily tied to urban innovation and domestic smart tech, more than industrial or automotive applications. Let me know if you’d like a table format too.
IoT Security and Privacy
- IoT-targeted cyberattacks dropped by 18% in 2025, largely due to the rollout of AI-powered anomaly detection.
- Still, 67% of organizations cite security as their top barrier to IoT expansion.
- Edge computing is now implemented in 43% of IoT networks, reducing centralized data exposure risks.
- 60% of smart home users have enabled multi-factor authentication on IoT apps.
- Zero-trust architecture is used in 38% of enterprise IoT deployments.
- Encryption at rest is now the default for 71% of new consumer devices shipped in the US.
- Compliance frameworks like ISO/IEC 27001 are adopted by 74% of IoT service providers.
- The average data breach cost for IoT-related incidents is $2.17 million, compared to $4.32 million for traditional networks.
- US federal regulations on IoT privacy passed in late 2024 now mandate data minimization standards for device manufacturers.
- User trust in IoT platforms rose to 63% in 2025.
IoT Device Data Traffic and Network Usage
- In 2025, IoT devices will generate over 300 zettabytes of data globally, a 26% YoY increase.
- 5G IoT deployments now account for 62% of all new industrial installations.
- Data usage per device averages 4.2 GB/month.
- Real-time video from security IoT devices represents 22% of all consumer IoT data traffic.
- LPWAN technologies (e.g., LoRaWAN, NB-IoT) are now used in 58% of rural deployments, enabling low-power, long-range connectivity.
- IoT traffic accounts for 19% of all mobile network usage.
- Latency-sensitive applications (e.g., remote surgery, autonomous driving) have led to a 44% growth in edge data centers.
- Data throttling policies have been implemented in 41% of consumer networks, primarily due to increased congestion.
- Data monetization is on the rise: 37% of enterprises now resell anonymized IoT data for market intelligence.
- Wi-Fi 6E and Wi-Fi 7 adoption in IoT hardware now exceeds 52%, enhancing local bandwidth and responsiveness.
Most Popular Connectivity Protocols for IoT Devices
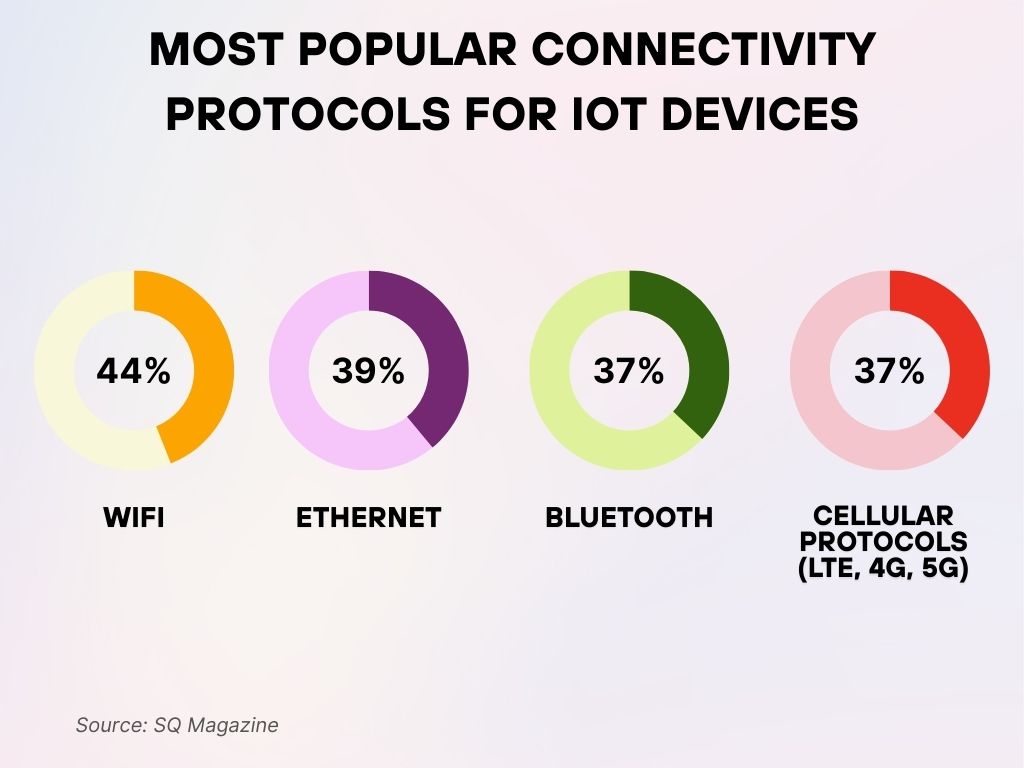
- Wi-Fi leads as the top connectivity option for IoT, used by 44% of deployments due to its widespread availability and ease of setup.
- Ethernet ranks second with 39%, offering stable, wired connections preferred in industrial and fixed-location setups.
- Bluetooth is utilized by 37% of IoT devices, ideal for short-range communication and low-power needs.
- Cellular protocols (including LTE, 4G, and 5G) are also at 37%, supporting mobile and remote IoT applications where constant connectivity is critical.
These figures highlight the diverse connectivity landscape in IoT, with no single protocol dominating all use cases.
Regional Analysis of IoT Deployments
- North America remains the top IoT market, accounting for 28% of global deployments in 2025.
- Europe follows with 25%, driven by sustainability-focused smart city initiatives.
- Asia-Pacific has shown the fastest growth, now hosting 35% of global connected devices.
- China alone is responsible for 18% of global IoT traffic, supported by national industrial automation programs.
- India’s IoT adoption rate grew by 22% YoY, with heavy investments in agriculture and public infrastructure.
- Latin America has expanded smart utility usage to 33% of urban centers.
- In Africa, smart irrigation and mobile health IoT solutions have seen 42% adoption increases, particularly in Kenya, Nigeria, and South Africa.
- Middle East governments have allocated over $14 billion toward smart grid and water management IoT solutions in 2025.
- Oceania has integrated IoT in 79% of new construction projects, with sustainability as a primary goal.
- Cross-border IoT integration is now active in over 41 international corridors, facilitating seamless logistics and trade monitoring.
Leading IoT Vendors and Market Share
- Amazon Web Services (AWS IoT) holds the largest platform market share at 22.4%.
- Microsoft Azure IoT trails with 19.7%, favored for hybrid cloud deployments.
- Google Cloud IoT has gained momentum, now at 13.5% market share, up from 10.8% last year.
- Cisco commands 15% of enterprise IoT network hardware revenue.
- Samsung SmartThings leads the smart home sector with 32 million active installations.
- Huawei holds strong in Asia, powering 16% of device platforms in that region.
- IBM’s Watson IoT is popular in industrial and automotive, now used by 9,800 manufacturers worldwide.
- Bosch IoT Suite is integrated into over 280,000 connected appliances and sensors globally.
- Oracle IoT Cloud services have grown 11% YoY, especially in logistics analytics.
- Intel and Qualcomm remain leading chipmakers, embedded in over 70% of IoT edge devices manufactured in 2025.
Top Operating Systems for IoT Development
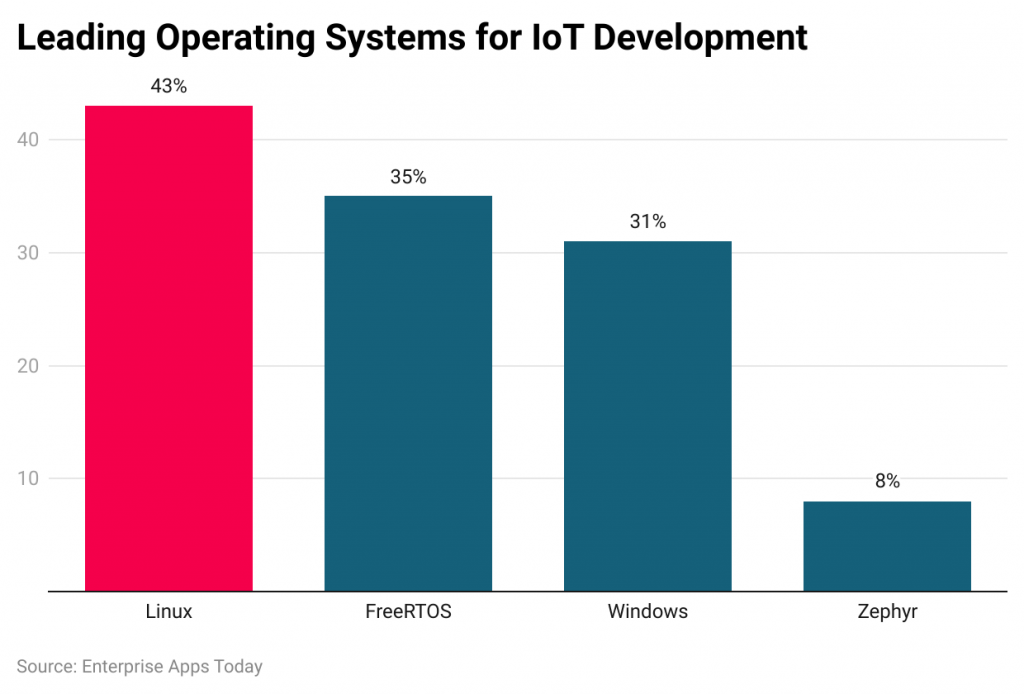
- Linux leads the pack, used by 43% of IoT developers due to its flexibility and open-source ecosystem.
- FreeRTOS is the second most popular, with 35% adoption, favored for its lightweight and real-time capabilities.
- Windows is chosen by 31% of developers, commonly in enterprise and industrial IoT solutions.
- Zephyr is used by 8%, a small but growing share for embedded IoT applications.
This breakdown shows a clear preference for open-source and real-time operating systems in the IoT development space.
Economic Impact of IoT Technologies
- The global economic value created by IoT in 2025 is projected at $5.5 trillion, according to aggregated industry estimates.
- IoT implementations have improved operational efficiency by 21% across logistics, healthcare, and manufacturing.
- SMEs using IoT report a 19% revenue boost through automation and predictive analytics.
- Energy cost reductions from IoT-enabled optimization reached $78 billion globally.
- The job market for IoT specialists expanded by 24% YoY, with the US adding 320,000 new IoT-related roles.
- IoT-driven product innovation now contributes to 11% of R&D ROI.
- In retail, IoT has cut shrinkage losses by 31% and improved in-store customer engagement.
- IoT-backed insurance models have helped reduce claims by 17% through real-time risk assessments.
- Global trade logistics powered by IoT monitoring now sees a 23% reduction in transit losses.
- Industrial IoT contributed $1.3 trillion to global GDP.
Environmental and Sustainability Impact of IoT
- IoT-enabled smart grids have led to 6.1% reductions in CO₂ emissions in urban zones globally.
- Smart building solutions helped reduce energy consumption by 38% in corporate campuses.
- IoT-driven precision farming reduced global pesticide use by 21%, improving soil health and yield.
- Smart waste management systems have cut landfill overflows by 46% in participating cities.
- IoT sensors in water systems have saved over 18 billion gallons of water worldwide in 2025 alone.
- Electric vehicle (EV) IoT charging networks expanded by 73% YoY, reducing charging times by 34%.
- Smart thermostats helped save an average of $310/year per US household on heating/cooling.
- IoT-controlled HVAC systems improved energy efficiency in commercial buildings by 28%.
- Smart factories deploying closed-loop monitoring have cut waste by 23% and emissions by 12%.
- IoT in environmental monitoring has enabled real-time air quality tracking in over 180 major cities.
Recent Developments in IoT Technologies and Standards
- The Matter protocol has become the universal standard for smart home device compatibility as of Q1 2025.
- 6G-ready IoT prototypes are being tested in urban testbeds across Seoul, Berlin, and Austin.
- Edge AI integration is now standard in 62% of industrial IoT devices, enabling localized decision-making.
- Digital twins created via IoT data have reduced testing cycles in manufacturing by 40%.
- Blockchain-backed IoT networks now manage $3.7 billion worth of supply chain contracts.
- Zero-touch provisioning (ZTP) has sped up enterprise IoT device onboarding by 55%.
- Open-source IoT development kits usage grew by 31%, democratizing innovation for startups.
- AI-trained threat models have been embedded in 68% of new consumer IoT security systems.
- Nanoscale IoT sensors are now being deployed in biomedical and food safety applications with high early success rates.
- IoT interoperability standards from ETSI and IEEE have seen 74% global vendor adoption.
Conclusion
The Internet of Things is no longer a prediction, it’s the pulse of modern society. In 2025, IoT’s impact spans personal comfort, industrial productivity, environmental resilience, and even regulatory reform. With 18.8 billion devices, a market worth $1.52 trillion, and tangible global benefits, IoT is not just scaling; it’s maturing. Whether you’re a consumer upgrading your smart home or an enterprise optimizing global logistics, IoT is shaping a future that’s not just connected but truly intelligent.

