As the cryptocurrency landscape matures, Bitcoin and Tether continue to dominate discussions around digital finance. Bitcoin, the first decentralized cryptocurrency, represents a volatile but high-growth investment asset. Tether, in contrast, offers stability through its peg to the US dollar, acting as a bridge between traditional finance and digital assets. Real-world use cases, such as cross-border payments and municipal integration in cities like Lugano, highlight their growing economic relevance. This article offers a comprehensive, stats-rich comparison of both assets, exploring volume, adoption, volatility, security, and more.
Editor’s Choice
- The total crypto‑assets market capitalization surpassed $4.2 trillion in Q3 2025.
- The global crypto adoption rate reached 9.9%, representing about 559 million users worldwide.
- The daily trading volume of Tether exceeded $140 billion in 2025.
- The world’s largest cryptocurrency, Bitcoin (BTC), hit an all‑time high above $126,000 in October 2025.
- Tether’s on‑chain dominance: Asia accounted for over 45% of global USDT volume in Q1 2025, and Latin America accounted for about 18%.
Recent Developments
- Crypto adoption in the U.S. rose roughly 50% between January and July 2025 compared with the same period in 2024.
- The global stablecoin on‑chain transaction share reached 30% of all crypto transaction volume in 2025.
- Latin America saw nearly $1.5 trillion in crypto transaction volume between 2022 and 2025, with Tether expanding its regional footprint.
- The city of Lugano, Switzerland, hosted the 2025 “Plan ₿ Forum,” signalling increased real‑world adoption of Bitcoin for payments and municipal use.
- The crypto assets market cap was equivalent to about 13% of the U.S. Treasury debt market by September 2025.
- In Q3 2025, perpetual derivative trading on decentralized exchanges reached $1.81 trillion, up 87% from Q2.
- Tether’s monthly volume on the TRON network averaged about $20 billion per day by May 2025.
- The U.S. accounted for only around 11% of global Tether activity in 2025, with the bulk concentrated in Asia and Latin America.
Bitcoin Trading Pair Market Share
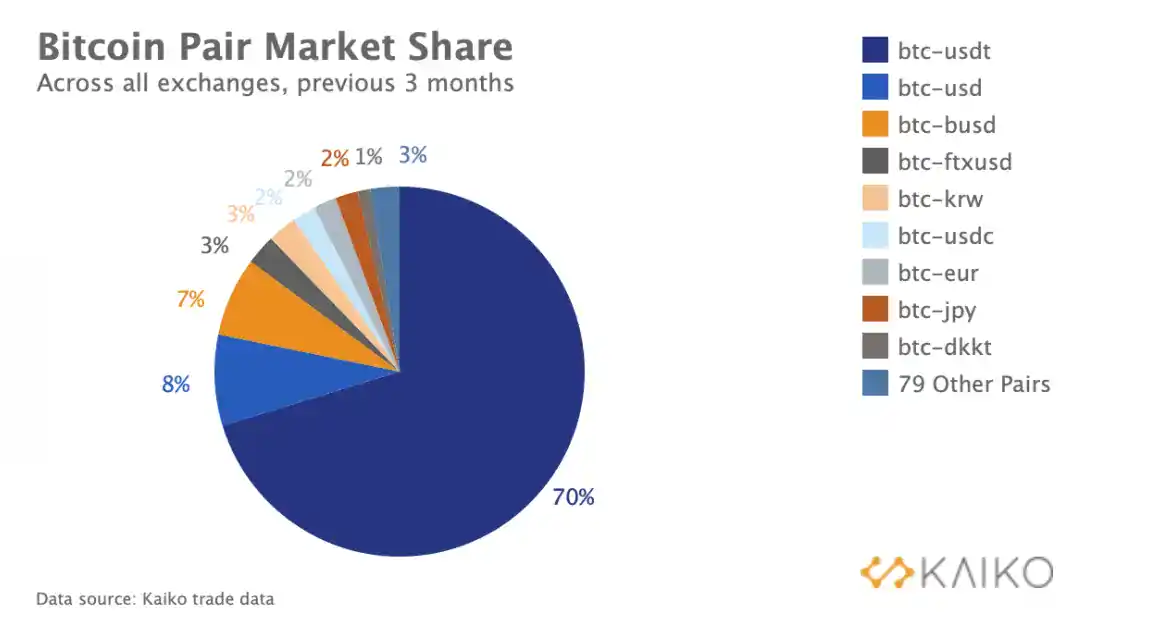
- btc-usdt commands a dominant 70% share of Bitcoin trading across all exchanges.
- btc-usd ranks second with 8%, followed closely by btc-busd at 7%.
- btc-ftxusd and btc-krw each hold a 3% share of the market.
- btc-usdc and btc-eur both contribute 2% to the overall volume.
- btc-dkkt and btc-jpy trail at 2% and 1%, respectively.
- A group of 79 other pairs together make up the remaining 3% of market share.

Trading Volume
- USDT daily trading volume exceeded $140 billion in 2025, making it the most‑traded cryptocurrency by volume.
- USDT on‑chain monthly transaction volume peaked at $1.01 trillion in June 2025.
- The circulating supply of USDT is about $89 billion as of November 2025.
- The global crypto market cap in 2025 crossed $4.2 trillion, supporting increased volume activity.
- On major exchanges, USDT trading pairs accounted for approximately 41% of all transactions globally in 2025.
- Asia represented more than 45% of global USDT volume in Q1 2025.
- The U.S. spot Bitcoin ETFs saw a record $40 billion in trading volume in one week in November 2025.
Price Volatility Trends
- Bitcoin reached an all‑time high above $126,000 in October 2025.
- By May 2025, Bitcoin was trading above $110,000, marking a substantial recovery compared with prior years.
- Research shows realized volatility for Bitcoin declined significantly; for example, Bitcoin was nearly half as volatile in 2024 compared to 2021.
- In February 2025, Bitcoin’s price moved within a narrower band ($94K–$100K), reflecting a phase of consolidation.
- Stablecoin dominance (such as USDT) helped dampen some crypto‑market swings by providing a “safe‑haven” within the ecosystem.
- The correlation between Tether minting/burning events and Bitcoin intraday price responses shows asymmetrical behaviour; positive responses post‑minting are stronger within 5–30 minutes.
- Large volumes on derivatives and perpetual contracts, especially in Q3 2025, suggest elevated short‑term price movements with increased volume.
Cryptocurrency Market Expectations
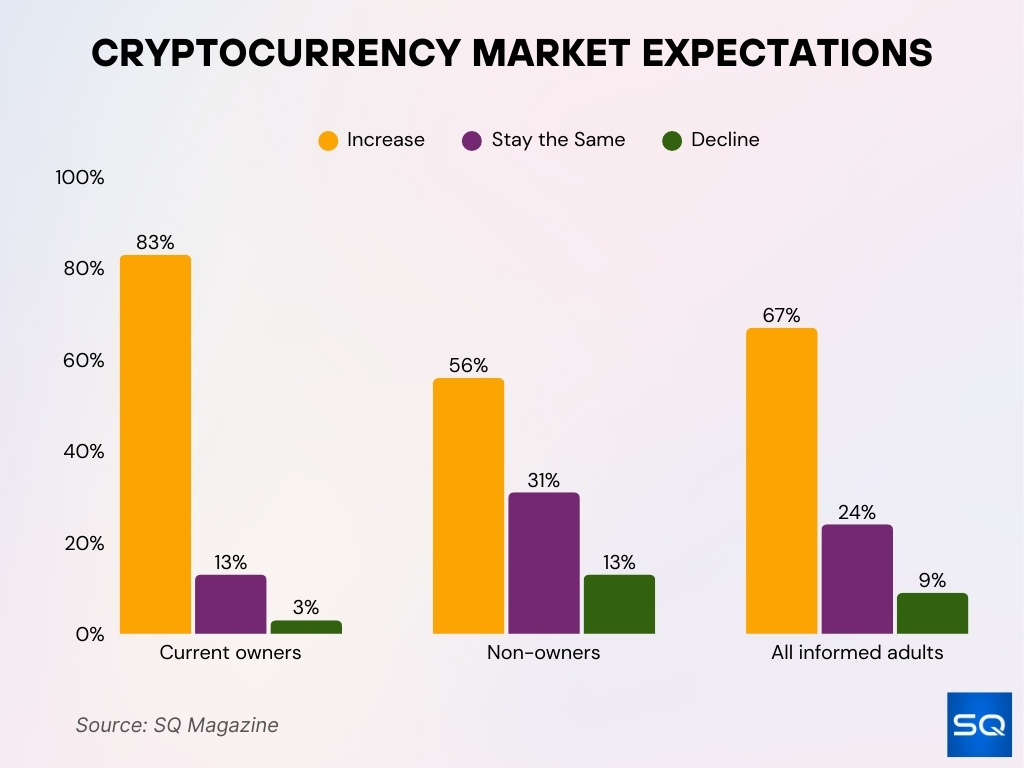
- 83% of current owners expect the crypto market to increase in 2025, while 13% see no change and 3% expect a decline.
- 56% of non‑owners anticipate market growth, with 31% expecting stability and 13% predicting a decline.
- 67% of all informed adults foresee an increase, 24% expect no change, and 9% anticipate a decline.

Adoption Rates and Use Cases
- Global crypto adoption reached approximately 9.9% of internet users (~559 million people) in 2025.
- The U.S. crypto transaction volume (Jan–July 2025) increased by about 50% compared to the same period in 2024.
- Merchant acceptance: Approximately 46% of merchants globally now accept cryptocurrency payments.
- Tether’s user base reached about 433 million users globally in 2025.
- Latin America accounted for 18% of global Tether usage in 2025, driven by inflation hedging in Argentina and Venezuela.
- Africa’s monthly on‑chain USDT volume reached nearly $25 billion in March 2025.
- In Asia, more than 45% of global USDT volume in Q1 2025 was based, highlighting regional adoption hotspots.
- Municipal use case, Lugano, Switzerland, accepted Bitcoin payments and hosted the Plan ₿ forum in 2025, signalling real‑world utility.
- Stablecoins (including USDT) now account for about 30% of all on‑chain crypto transaction volume.
Blockchain Activity and Transaction Counts
- The Bitcoin network processed about 381,803 daily transactions around November 2025.
- The average transaction value in the Bitcoin network was ~0.9014 BTC (~$79,292) in the last 24 hours, per the tracked data.
- Blockchain-based payments globally are projected to exceed $3 trillion in 2025.
- About 78% of Fortune 500 companies are exploring or piloting crypto or blockchain payments in 2025.
- The daily active addresses on the Bitcoin network numbered around 151,413 in the last 24 hours, according to one dataset.
- As of 2025, more than 1.08 billion transactions have been recorded in the Bitcoin transaction graph, with over 39.7 billion edges in one academic study.
- The growth of decentralized finance (DeFi) on blockchain saw TVL rebound by ~30% in Q1 2025 compared with the earlier slump.
- Blockchain-based remittances represent around 3–5% of global remittance flows in 2025.
- The average transaction cost on blockchain networks dropped 60–70% compared to traditional methods by 2025.
Most Donated Cryptocurrencies
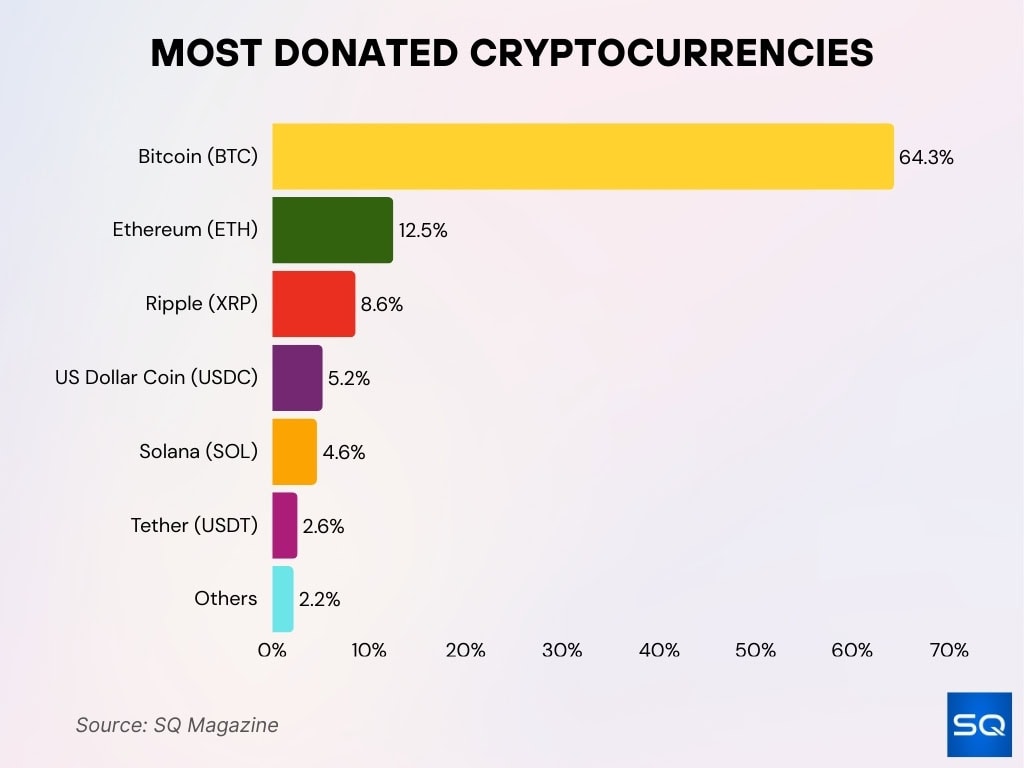
- Bitcoin (BTC) leads all crypto donations with a 64.3% share.
- Ethereum (ETH) comes second, contributing 12.5% of donations.
- Ripple (XRP) holds an 8.6% share, showing growing donor use.
- US Dollar Coin (USDC) accounts for 5.2%, reflecting stablecoin trust.
- Solana (SOL) represents 4.6%, gaining traction in donations.
- Tether (USDT) contributes 2.6%, popular for its price stability.
- Other cryptocurrencies collectively make up the remaining 2.2%.

Wallet Distribution and Ownership Concentration
- Approximately 950,000 wallet addresses hold 1 BTC or more in 2025, representing less than 0.2% of all addresses.
- Just 83 wallets control about 11.2% of the total Bitcoin supply as of August 2025.
- Four wallets alone control around 3.23% of the supply.
- Addresses holding between 10–100 BTC represent 0.23% of total addresses but about 21.43% of BTC value.
- Addresses in the 100–1,000 BTC range (~0.03% of addresses) hold ~25.59% of the supply in one dataset.
- The number of wallet addresses richer than 1 BTC is roughly 950,000, yet many of these are custodial or institutional rather than individual.
- Over 3–4 million BTC (up to ~20% of supply) is estimated to be permanently lost, tightening the actual circulating supply.
- Corporate holdings, some public companies own more than 1 million BTC in total, equal to about 5% of the supply.
- Institutional holdings intensify concentration and raise questions around decentralization and network influence.
Exchange Listings and Liquidity Metrics
- The top cryptocurrency spot exchanges have a combined 24-hour volume of around $1.5 trillion.
- Around 197 crypto exchanges are tracked with a total 24-hour volume of about $181 billion.
- A liquidity analysis report indicated that liquidity profiles differ drastically between centralized and decentralized exchanges, and that liquidity remains a challenge.
- Aggregate stablecoin market capitalization exceeded $280 billion by September 2025, with projections up to $1.9 trillion by 2030.
- A looming “liquidity crisis” in crypto markets in Asia in 2025 relates to structural free-float and market depth limits.
- Liquidity and depth metrics now factor heavily into exchange trust scores and asset-ranking models.
- Exchanges with higher market-making presence enable tighter spreads and better execution for assets like Bitcoin.
- Stale liquidity, spoofing and inconsistent refresh rates are still flagged as weaknesses in market quality for crypto exchanges in late 2025.
Tether’s Reserves Composition
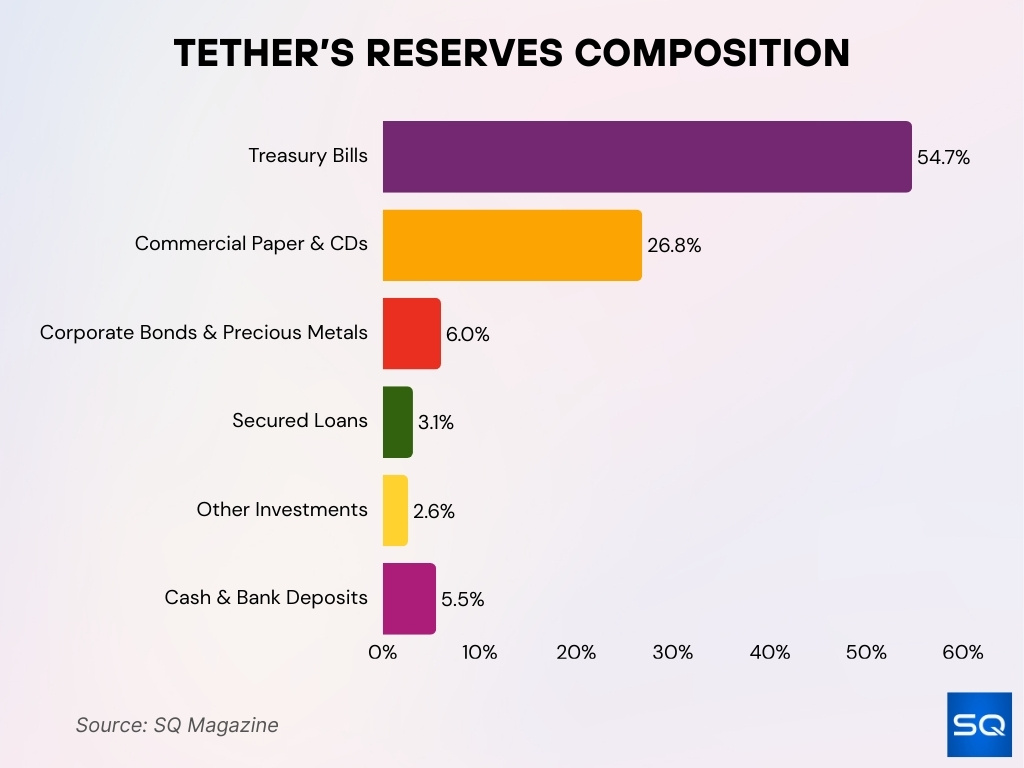
- Treasury Bills make up the largest share at 54.7% of Tether’s total reserves.
- Commercial Paper & CDs account for 26.8%, emphasizing short-term debt reliance.
- Corporate Bonds & Precious Metals hold a 6.0% share, showing modest diversification.
- Secured Loans represent 3.1%, reflecting limited loan-backed exposure.
- Other Investments contribute 2.6%, covering smaller alternative assets.
- Cash & Bank Deposits make up 5.5%, providing liquidity for redemptions.

Stablecoin vs. Cryptocurrency Performance Metrics
- In September 2025, stablecoins settled about $772 billion in transactions, roughly 64% of all on-chain volume.
- The circulating market cap of stablecoins topped $275 billion by Q3 2025.
- By Q2 2025, the stablecoin market cap passed $230 billion, with USDT holding ~65% and USDC ~26%.
- The daily velocity of the two largest stablecoins is estimated at ~0.15–0.25 times per day.
- Bitcoin in Q1 2025 had an average price volatility of ~2.8%, while Tether’s deviation remained under 0.1%.
- Crypto-asset market cap as of Q3 2025 reached ~13% of the U.S. Treasury debt market.
- Bitcoin underperformed other market segments in Q3 2025.
- Stablecoin usage is tied to payments and global rails, while cryptocurrencies serve as store-of-value or speculative assets.
- Stablecoins act more like payment infrastructure, and cryptocurrencies play investment and technology roles.
Institutional vs. Retail Usage
- 59% of institutional respondents plan to allocate over 5% of their AUM to crypto.
- Institutional accumulation of Bitcoin increased in 2025 even as some retail activity cooled.
- 78% of global institutional investors have a crypto risk-management framework.
- 83% of institutional funds in North America have dedicated crypto-risk teams.
- Millennials and Gen Z account for ~57% of U.S. crypto holders.
- U.S. crypto transaction volume increased by ~50% in Jan–July 2025 compared to 2024.
- Crypto exposure is shifting from retail wallets to ETFs, institutions, and asset managers.
- 56% of European institutional investors use ISO-certified crypto asset management frameworks.
- Institutional flows reduce reliance on retail-driven volume spikes.
- Retail investors still drive short-term trends and social sentiment.
Environmental Impact and Energy Consumption
- Bitcoin mining consumes approximately 211.58 terawatt-hours annually, around 0.83% of global electricity.
- U.S. crypto mining operations represent 0.6–2.3% of U.S. electricity consumption.
- 48% of Bitcoin electricity in 2025 came from fossil fuels, 43% from renewables.
- Global power demand will rise 2.4% in 2025, with crypto mining contributing.
- Malaysia saw $1.11 billion in electricity losses from illegal crypto mining by Aug 2025.
- Traditional banking systems remain far less energy-intensive per transaction.
- Some jurisdictions now require mining firms to report energy usage and adopt renewables.
- Renewable energy in mining is rising, but fossil-fuel offset remains a challenge.
- Energy intensity and carbon footprint are now part of due diligence.
Security Incidents and Risk Factors
- Over $2.17 billion was stolen in crypto-asset thefts by mid-2025.
- The ByBit exchange hack in 2025 caused a $1.5 billion loss.
- $1.93 billion was stolen in crypto-related crimes in H1 2025, and phishing attacks rose by ~40%.
- Wallet compromises account for 23.35% of all stolen funds YTD 2025.
- Off-chain attacks now account for 56.5% of attacks and 80.5% of lost funds in DeFi.
- Only 44% of global institutional investors conducted two independent audits in the past 12 months.
- 83,085 smart contracts were upgraded, exposing 31,407 security issues.
- AI-driven scams surged 456% between May 2024 and April 2025.
- Attackers now target infrastructure, wallets, and governance over protocol exploits.
Frequently Asked Questions (FAQs)
Above $230 billion.
Over 60% of the overall stablecoin market.
About $126,199 (Bitcoin / Tether pair recorded at 126,199 USDT).
Conclusion
The comparison between cryptocurrencies such as Bitcoin and stablecoins like Tether reveals a dynamic and evolving ecosystem. Stablecoins have grown dramatically in transaction volume, market cap, and use-case breadth, moving beyond trading pairs into payments and global rails. At the same time, cryptocurrencies continue to see rising institutional interest, evolving adoption metrics and increasing scrutiny in environmental, regulatory, and security domains.
For U.S. and global investors alike, the clear takeaway is that these two asset classes serve distinct but complementary roles. Stablecoins work as liquidity and settlement infrastructure, cryptocurrencies remain speculative, store-of-value and technology bets. As always, users should consider risk factors, including energy use, regulatory uncertainty and escalating security threats, while noting that the crypto space is no longer niche.


