Bitcoin’s energy use has sparked debates about sustainability, grid strain, and climate impact. Today, that discussion is more urgent than ever as mining power expands and regulators take notice. You’ll see how mining compares to entire nations, how its carbon output stacks up, and what shifts are underway in the industry. Dive in to understand the numbers behind the headlines.
In real-world settings, major utility zones in Texas and Sichuan province now report spikes in demand tied to Bitcoin farms, altering load forecasts. Meanwhile, data centers in certain EU countries see Bitcoin mining being used as a “demand sink” to absorb excess renewable generation during off‑peak hours. Explore the full analysis below.
Editor’s Choice
- Bitcoin’s annualized energy consumption in 2025 is estimated at ~173 TWh.
- Renewable energy use in mining hit 52.4% in the same year, up from ~37.6% in 2022.
- Bitcoin mining now claims about 0.5% of global electricity use.
- The network draws ~10 GW of continuous power, translating to ~168 TWh annually.
- Coal remains part of Bitcoin’s global power mix, though estimates vary from 10–20%, with substantial regional differences.
- Bitcoin’s energy use rivals that of nations like Poland or Ukraine, ~155–172 TWh.
Recent Developments
- In 2024, cryptocurrency mining electricity use grew ~16%, adding ~7 TWh to U.S. demand.
- Utility-scale Bitcoin farms now clock ~10 GW continuous draw, pushing annual demand past 160 TWh.
- AI infrastructure is projected to match or exceed Bitcoin’s energy burden by late 2025.
- Regulatory bodies are drafting energy tax proposals for crypto mining in the U.S. and Europe.
- Sustainable energy share reached 52.4%, with natural gas (38.2%) overtaking coal (8.9%).
- Some mining operations now run as “demand response” loads, ramping up only when the grid has excess power.
- There is increased pressure on public companies in the mining space to disclose energy sources and carbon footprints.
Bitcoin Electricity Use vs Nations and Tech Giants
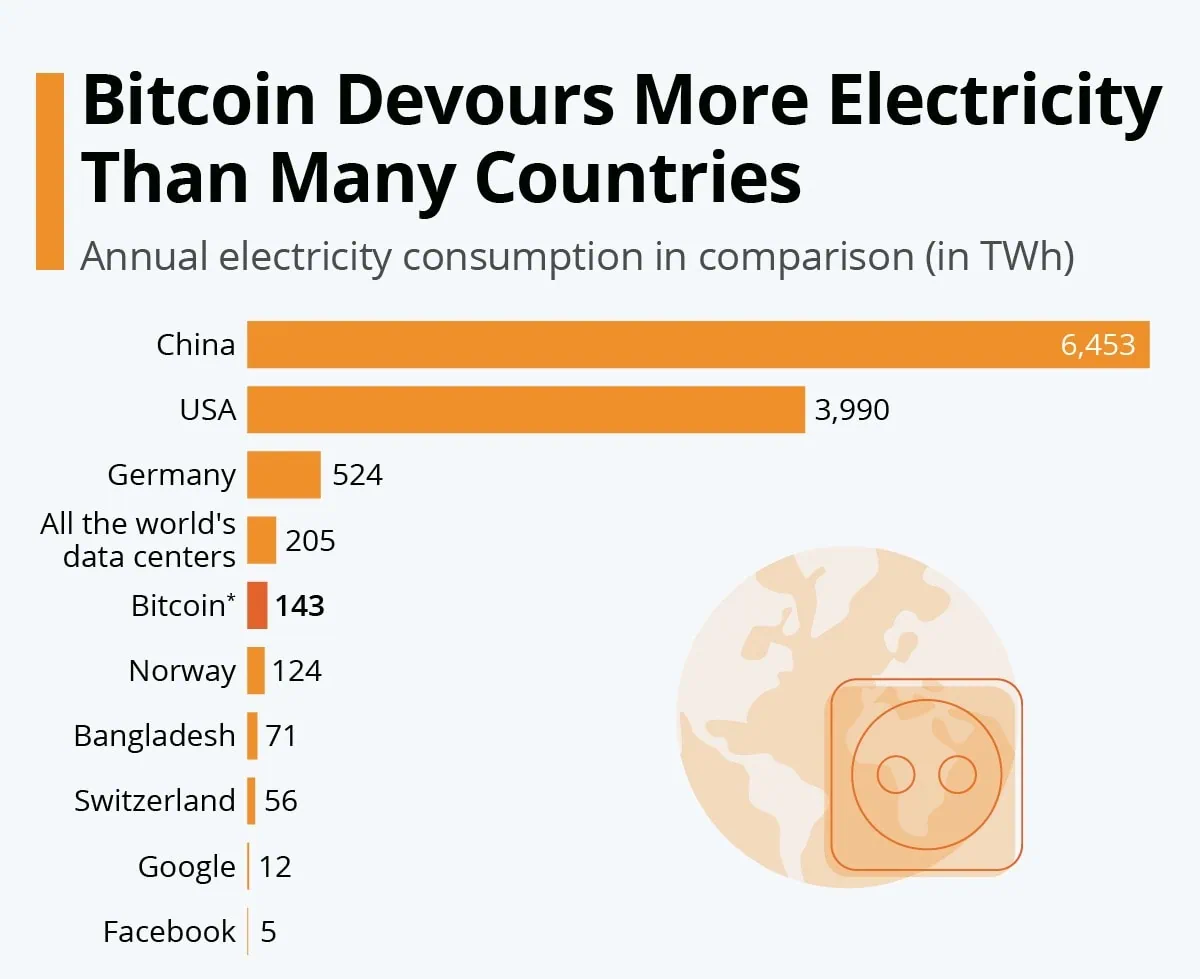
- Bitcoin uses 143 TWh annually, more than Norway (124 TWh) and Bangladesh (71 TWh).
- It exceeds global data centers’ usage of 205 TWh.
- China leads globally with 6,453 TWh, followed by the USA at 3,990 TWh.
- Bitcoin outpaces Switzerland (56 TWh), Google (12 TWh), and Facebook (5 TWh) in power use.

Key Bitcoin Energy Consumption Statistics
- Estimated 2025 consumption: ~173 TWh annually.
- Continuous draw: ~10 GW, implying ~168 TWh per year.
- Global share: ~0.5% of worldwide electricity demand.
- In 2024, mining’s U.S. electricity use rose by 7 TWh, 16%.
- Carbon emissions per transaction: ~712 kg CO₂.
- Renewable + sustainable energy share: ~52.4% in 2025.
- Energy mix: natural gas ~38.2%, coal ~8.9%, renewables + nuclear rest.
- Annual range estimate from CBECI, 2024: 80–170 TWh, mid estimate.
How Much Energy Does Bitcoin Use?
- A Bitcoin transaction now uses ~1,335 kWh on average in 2025, roughly the power of a U.S. home for ~45 days.
- Some prior estimates placed usage as low as ~1,200 kWh per transaction.
- The Bitcoin network’s total annual draw is estimated between 150–173 TWh.
- In some models, during January 2024, CBECI estimated bounds from 80 to 390 TWh annualized.
- Compared to Finland’s national demand, ~85–95 TWh, Bitcoin’s usage is now about twice as high.
- The network uses more electricity annually than countries like Poland, ~150–172 TWh.
- Energy per block, assuming 144 blocks per day, totals thousands of kWh; exact value varies with network hash rate.
- As mining difficulty rises, energy per coin mined increases, ~209 MWh/coin in 2025.
Crypto Energy Use Per Transaction (in Wh)
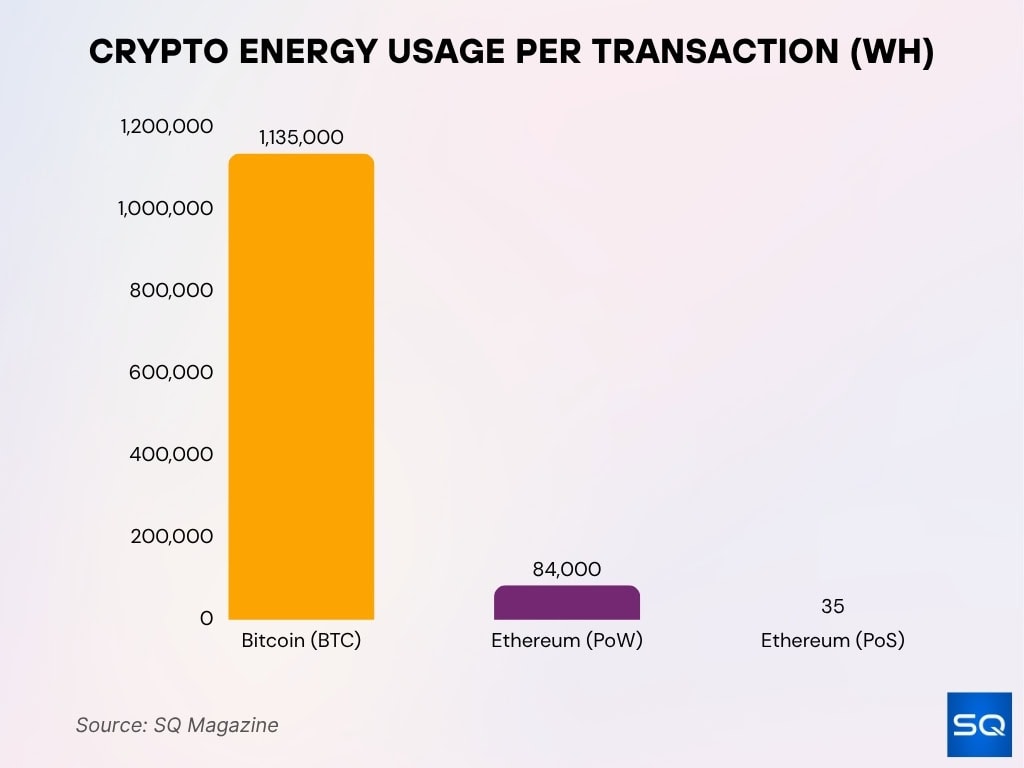
- Bitcoin uses 1,135,000 Wh per transaction, the highest among major cryptocurrencies.
- Ethereum (PoW) uses 84,000 Wh per transaction, much lower than Bitcoin.
- Ethereum (PoS) uses only 35 Wh per transaction, showing PoS efficiency.
- Switching from PoW to PoS leads to a >99.9% drop in Ethereum’s per-transaction energy use.

Consumption vs Other Countries
- Bitcoin’s annual electricity demand is estimated between 155 TWh and 172 TWh, comparable to nations like Poland.
- Some forecasts push the 2025 figure even higher, ~199 TWh, per Digiconomist.
- If Bitcoin were a country, it would outrank many middle‑income nations in power consumption.
- Bitcoin’s share of global electricity use is around 0.5%–0.6% in 2025.
- Over 52% of Bitcoin’s power now comes from sustainable sources.
- The network’s carbon footprint in 2025 is estimated at ~98 million metric tons CO₂.
- Bitcoin’s electricity use now exceeds several small to mid‑sized nations and is close to some larger ones.
- Compared to Finland’s ~90 TWh national usage, Bitcoin often surpasses it.
Consumption vs Major Industries
- Bitcoin’s annual energy consumption is estimated at 173 TWh in 2025, while gold mining uses roughly 240 TWh per year, making gold ~39% higher.
- Global data centers consume around 415 TWh annually (for all services), about 1.5% of global electricity, with the U.S. making up 45% of this share.
- Oil and gas industries use thousands of terawatt-hours, orders of magnitude more than Bitcoin; e.g., ExxonMobil alone consumed over 1,500 TWh in 2024.
- Steel and cement sectors each consume well over 2,000 TWh per year globally, over 10× Bitcoin’s usage.
- The U.S. share of national electricity used by crypto mining is 0.6%–2.3% in certain states for 2025.
- Gold mining emits 9 tons of CO₂ per Bitcoin’s worth of gold, while mining a single Bitcoin emits about 223 tons of CO₂, showing higher carbon intensity for Bitcoin.
- Automotive (including EVs) and electronics manufacturing can match or top Bitcoin’s energy use locally, with certain EV gigafactories drawing 8–10 TWh yearly.
- Bitcoin’s energy footprint is forecasted to grow faster than many traditional sectors due to scaling and price surges; a 400% price boom triggered a 140% rise in energy use from 2021-2022.
- Data centers’ electricity needs are projected to more than double by 2030, potentially reaching 945 TWh, outpacing total Bitcoin and gold mining combined.
Hourly Electricity Use: Bitcoin Mining vs Appliances
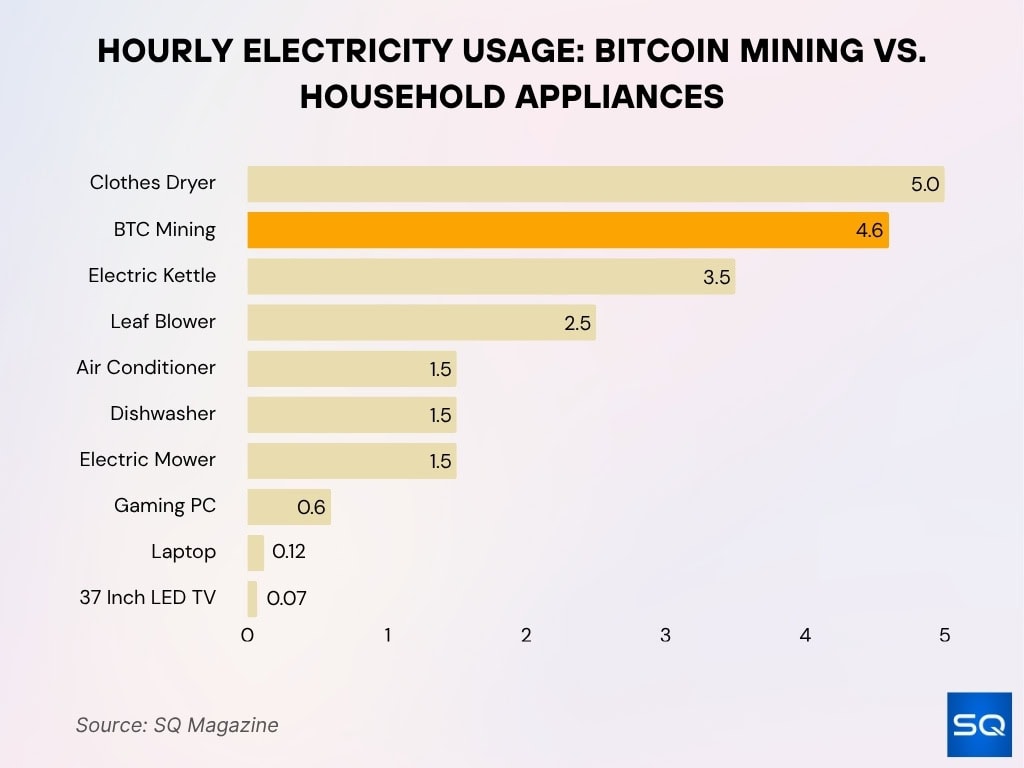
- Bitcoin mining uses 4.6 kWh per hour, close to a clothes dryer’s 5.0 kWh.
- It consumes more than an electric kettle (3.5 kWh) and a leaf blower (2.5 kWh).
- Appliances like ACs, dishwashers, and mowers use about 1.5 kWh, roughly one-third of Bitcoin mining.
- A gaming PC uses 0.6 kWh, a laptop 0.12 kWh, and a 37-inch LED TV just 0.07 kWh per hour.

Bitcoin vs Traditional Banking Energy Use
- Global banking consumes 258.85 TWh annually, compared to Bitcoin’s 167.14 TWh, making banks use 35% more energy.
- Some studies claim the banking sector is 56× more energy-intensive than Bitcoin when comparing all infrastructure layers.
- The Visa network alone uses 7.81 TWh per year, while Bitcoin’s annual energy usage ranges from 88–150 TWh.
- Global banking infrastructure, including ATMs and branches, consumes about 0.2% of worldwide electricity, similar to a small nation’s demand.
- Bitcoin processes far fewer transactions, causing its energy per transaction to exceed banking by 2–3 orders of magnitude.
- Bitcoin miners sustain a power draw, so network energy is not directly scaled by transaction count, unlike banking.
- Physical bank branches add 22.68 TWh, and ATMs use 2.91 TWh yearly; continuous power sources are absent in Bitcoin.
- Studies argue that infrastructure comparisons can be misleading; estimates vary 25–50× depending on modeling inclusions.
- Some analyses suggest Bitcoin mining is a million times more efficient per payment in select metrics, but is limited by transaction scaling.
- Global banks lack transparent public reporting, so consumption figures may be underestimated by 10–20%.
Other Cryptocurrencies (Energy Comparison)
- Bitcoin, Proof of Work, generally consumes orders of magnitude more energy than Proof of Stake networks.
- Ethereum’s shift to PoS in 2022 reduced its energy usage by over 99%, making Bitcoin much more energy‑intensive in contrast.
- Some PoS blockchains claim energy usage that is negligible compared to the power draw in traditional finance or Bitcoin.
- Litecoin, Monero, and Bitcoin Cash also share mining energy burdens, but their hashrates are lower, so their absolute consumption is smaller.
- In cross‑crypto metrics, average energy per USD mined is ~5 kWh for Bitcoin, ~2 kWh for Ethereum pre‑merge.
- Some hybrid or alternative consensus chains, e.g., DAG, aim for minimal energy consumption footprints.
- The gap between Bitcoin and low‑energy cryptos may widen as Bitcoin demand rises and difficulty increases.
Bitcoin Mining Global Energy Mix
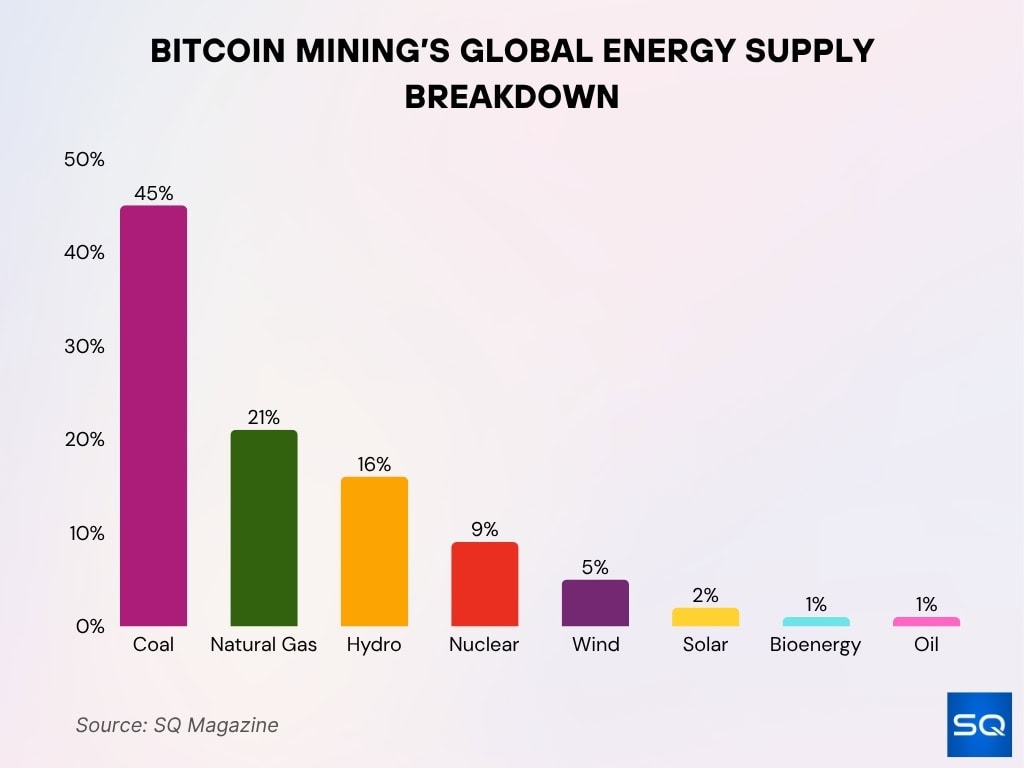
- Coal powers 45% of Bitcoin mining, remaining the dominant source.
- Natural gas supplies 21%, playing a major supporting role.
- Hydropower provides 16%, highlighting renewable use.
- Nuclear energy contributes 9%, offering low-carbon support.
- Wind energy makes up 5%, and solar adds 2% to the mix.
- Bioenergy and oil each account for 1%, the least utilized sources.

Mining and Renewable Energy Use
- In 2025, the sustainable energy share of Bitcoin’s mix rose to ~52.4%, up from ~37.6% in 2022.
- Within that, renewables, wind, hydro, and solar, constitute ~42.6%, while nuclear accounts for ~9.8%.
- Natural gas now replaces coal as the largest fossil energy source in Bitcoin mining, at ~38.2%, while coal is down to ~8.9%.
- The Bitcoin Mining Council claims ~56% sustainable power usage in Q2 2025.
- Some mining farms are designed as demand response loads, engaging only when renewable generation is abundant.
- Regions rich in hydro, e.g., Québec, Sichuan, remain hubs of “green mining” during wet seasons.
- Critics question the consistency of renewable claims and whether miners displace other users of renewables.
- Some subsidized or off‑grid mining connects directly to solar, wind farms, or geothermal sites to avoid grid carbon intensity.
Environmental Impact and Carbon Emissions of Bitcoin Mining
- A single Bitcoin transaction in 2025 emits ~712 kg CO₂, roughly equal to 1.58 million Visa transactions.
- The network’s total carbon emissions for 2025 are estimated to be ~98 million metric tons CO₂.
- The mining industry contributes ~139 million tonnes CO₂‑eq if accounting for broader GHG sources.
- Life‑cycle assessments suggest up to 80% of environmental impact may originate from mining hardware production rather than just operation.
- Bitcoin’s e‑waste footprint is significant; decommissioned ASICs contribute to electronic waste streams.
- Water consumption, land use, and local emissions, cooling, and diesel backup compound the footprint.
- In regions with coal or gas electricity, displaced mining can increase net emissions elsewhere, carbon leakage, when bans push miners to dirtier grids.
Hardware Efficiency Trends
- In 2025, top ASIC miners achieved ~46 J/TH, about a 12% improvement over 2024’s best models.
- Some leading models now operate in the 25–30 J/TH range under ideal conditions.
- The average mining farm’s PUE improved to ~1.18, down from ~1.23, meaning less overhead energy wasted on cooling.
- Earlier ASICs often ran above 80–90 J/TH; the shift to modern 5nm and 3nm chip designs has driven efficiency leaps.
- Some projections aim for ≤ 5 J/TH rigs by late 2025–2026 through chip innovations.
- Efficiency gains are constrained by diminishing returns; improvements below ~10 J/TH require disproportionate cost.
- Mining operators also refine thermal design, airflow, and cooling to reduce idle wattage lost per hash.
- Efficiency wins in hardware only translate to real energy savings if deployed at scale; older rigs often operate inefficiently or retire early.
Hashrate Trends
- In 2025, the Bitcoin network’s hashrate peaked at 1.12 billion terahashes per second, 1,120 EH/s.
- The 2025 hash growth was ~38% year-over-year.
- The United States now commands ~37.8% of the global hashrate share.
- China, despite prior crackdowns, still contributes ~14.1% of the network’s mining share.
- Russia holds ~15.5% of mining capacity as of 2025.
- Kazakhstan’s share dropped to ~2.1% in Q4 2025, reflecting stricter regulation and energy constraints.
- Paraguay, leveraging >99% hydro, claims ~3.9% of global mining share.
- Hashrate growth pressures all miners, pushing them toward more efficient machines or exiting.
Methods for Estimating Bitcoin’s Energy Consumption
- Cambridge CCAF’s annual best-guess energy estimate for Bitcoin in 2025 is 95.5 TWh, with a daily power demand of about 13 GW.
- Top-down models link mining revenues and energy demand, assuming electricity is 51.05% of total miner income.
- Bottom-up methods add reported miner wattage and usage rates, but often under‑represent downtime, leading to 10–20% errors.
- Cambridge’s hybrid models now adjust for hardware obsolescence and regional electricity mixes, yielding emission deviations up to 16%.
- Using 25 J/TH versus 50 J/TH can halve or double a model’s estimated consumption, illustrating the critical impact of average efficiency assumptions.
- Life cycle energy models, factoring in manufacturing and disposal, can raise total footprint estimates by 8–12%.
- Satellite imagery and grid load data are used in 2025 to validate site activity and correct for opaque miner reporting.
- Real-time telemetry and blockchain-based energy logs now cover at least 13 countries, improving reporting accuracy.
- The kWh-per-transaction method is increasingly criticized, as network scaling and batching can skew averages by 2–3x.
- Analysts combine energy consumption with grid carbon intensity for emissions, but emissions are still overestimated by 67.6% when outdated carbon factors are used.
Regulation and Policy Responses to Bitcoin Mining
- Over 40 U.S. states introduced or considered cryptocurrency mining legislation between 2024–25, focusing on registration, energy use, and zoning.
- Kentucky’s 2025 “Blockchain Digital Asset Act” accounts for 11% of the U.S. Bitcoin hashrate and mandates mining disclosures.
- Nebraska requires all miners to register and comply with utility sourcing and noise rules, with local shutdowns possible for noncompliance.
- Norway will impose a ban on new power-intensive crypto mining facilities starting in autumn 2025 due to energy strain.
- Proposed Norwegian rules would block new proof-of-work centers, impacting crypto mining that uses ~0.7 TWh of electricity, equal to 44,000 households.
- The European Union’s “Cryptocurrency Mining Sustainability Act” takes effect in 2025, mandating carbon emission data disclosure per kilowatt-hour used.
- Some U.S. states, like New York, have enacted or extended temporary bans on new fossil-fueled mining operations, citing environmental impact.
- Energy or carbon taxes now affect mining costs in select jurisdictions to curb emissions and incentivize renewable sources.
- The SEC proposed in July 2025 to update securities rules for digital assets, potentially raising compliance costs for mining firms.
- Global reviews of crypto mining stress ESG, anti-money laundering, and mandatory power-use transparency, shifting enforcement priorities in 2025.
Technological Innovations for Reducing Bitcoin Mining Energy Demand
- Photonic computing could cut Bitcoin mining energy use by up to 90% compared to current ASICs.
- Hybrid Proof-of-Work algorithms may yield 30‑50% lower energy consumption per hash than standard SHA‑256 mining.
- Adaptive mining protocols allow over 40% reduction in power draw during grid stress events.
- Liquid immersion cooling boosts energy efficiency by 10–15% and enables up to 96% heat reuse.
- Miners enrolled in demand response programs can curtail usage and collectively reduce a region’s grid load by hundreds of megawatts during peaks.
- Co-location with renewables provides miners access to cheap, zero-carbon electricity at rates under $0.02 per kWh.
- Hashrate financialization tools enable miners to hedge energy costs, avoiding price spikes that can be 2–3x higher at peak hours.
- New domain-specific architectures are pushing energy per hash to below 30 Joules per TH, a 75% improvement over previous generations.
- Advanced algorithm optimizations can reduce overall computation requirements, with block processing time shortened by up to 20%.
- Some mining farms reclaim waste heat for district heating, offsetting up to 80% of their own operational energy footprint.
Frequently Asked Questions (FAQs)
About 173 TWh per year.
Roughly 52.4 % of its electricity mix.
Around 712 kg CO₂ per transaction.
Between 0.6% and 2.3% of U.S. electricity consumption.
Conclusion
Bitcoin’s energy demands remain vast, rivaling medium-sized countries and demanding scrutiny. Hardware continues to inch forward, but regulation and innovation are now equally crucial levers shaping the future. As mining shifts, the tensions between growth, sustainability, and regulation will define whether Bitcoin’s environmental footprint shrinks or expands. In the sections above, we’ve laid out current stats, models, policies, and technologies. Want a deeper dive into any area, say emissions modeling or ASIC architecture?


