Android continues to shape the mobile world. From billions of users to the latest AI enhancements, its relevance spans industries and individual lives alike. For example, Android powers mission-critical earthquake alert systems in regions with minimal infrastructure, turning everyday phones into early-warning sensors. In another use case, retail chains leverage Android’s wide app reach to deploy contactless payment tools across thousands of stores. Explore this article to see how Android’s data underpins global impact.
Editor’s Choice
- 76% of global mobile operating systems now run on Android, up from 78% in 2024.
- Android commands 72.5%–73.9% of the worldwide smartphone market across sources.
- iOS leads in the U.S. with approximately 57% market share, compared to Android’s 42–43%.
- Estimates suggest there are between 3.9 and 4.2 billion active Android smartphone users globally in 2025.
- Version distribution is shifting, Android 15 holds 17–27%, while Android 14 remains near 19–34%.
- Android devices accounted for 76% of smartphone shipments in Q1 2025, up from 74% in Q4 2024.
- Google’s Android XR platform is debuting, powered by Gemini AI and targeting mixed-reality use, marking a “new era” for Android innovation.
Recent Developments
- A critical security bulletin was issued in September 2025 to patch actively exploited vulnerabilities in Android.
- Google expanded its Emergency Earthquake Alerts system, using phone accelerometers to issue warnings across all 50 U.S. states.
- Google introduced Android 16 with a refreshed Material 3 design plus Gemini AI integration, stepping into mixed reality via Android XR.
- A rising malware threat, Brokewell, is targeting Android users via fake Meta ads and sideloaded APKs, underscoring persistent security risks.
- Developers continue to favour iOS for initial app launches due to Android’s device diversity and version fragmentation.
Android Version and Device Distribution
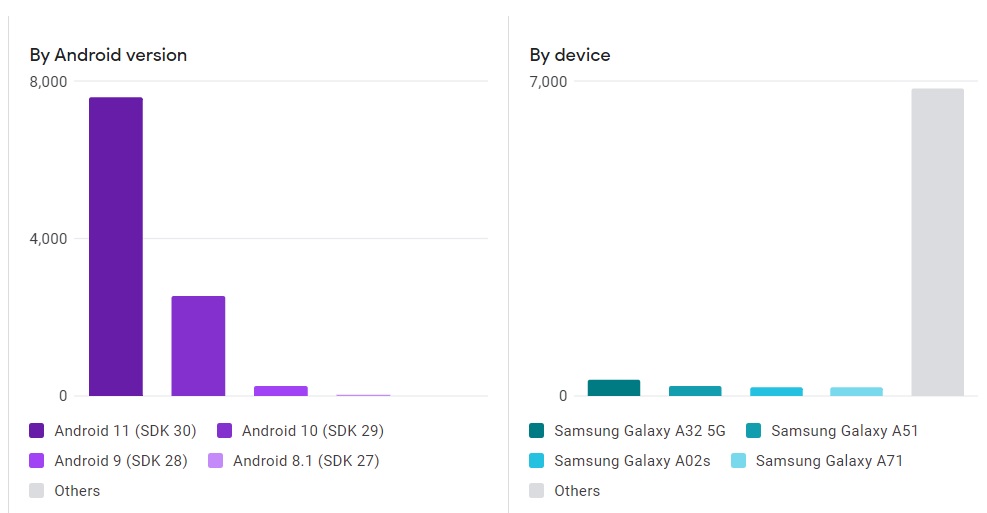
- Android 11 (SDK 30) leads with around 7,600 active devices, making it the most widely used version.
- Android 10 (SDK 29) follows with approximately 2,800 devices, still holding a significant base.
- Older versions like Android 9 (SDK 28) remain on about 500 devices, showing a gradual decline.
- Android 8.1 (SDK 27) accounts for roughly 200 devices, highlighting its legacy use.
- Versions classified as Others represent only a very small fraction of the total.
- Among devices, the Samsung Galaxy A32 5G holds about 350 active units, leading individual models.
- The Samsung Galaxy A51 comes next with around 300 units still in circulation.
- Both the Samsung Galaxy A02s and Galaxy A71 maintain close numbers at 250 devices each.
- Other devices dominate the market, totaling nearly 6,800 units, far exceeding single-model shares.
Android vs iOS Market Share Comparison
- Globally, Android retains between 70% and 76% of mobile OS market share, while iOS trails between 19% and 28%.
- Android stands at 73.9% and iOS at 25.7% worldwide in August 2025.
- In the U.S., iOS holds 57.24% and Android 42.51%, reinforcing Apple’s regional strength.
- Android’s global share is 72.46% as of July 2025.
- Samsung held 35.3% of the Android vendor share in the past year.
Number of Active Android Devices
- Global estimates place the Android user base between 3.5 and 4.2 billion, depending on whether the metric includes active smartphone users, other Android-powered devices, or multiple device ownership.
- Android smartphone users number 4.2 billion in 2025, up from 3.9 billion in 2024.
- Some sources cite 3.5 billion active users, a slightly conservative figure.
- There are over 3 billion active Android devices, compared to 1 billion iPhones.
- Worldwide smartphone users total roughly 4.88 billion in 2024, with many owning multiple devices.
- Active Android smartphone installations span 190 countries.
iPhones vs Android Smartphone Sales in Select Countries
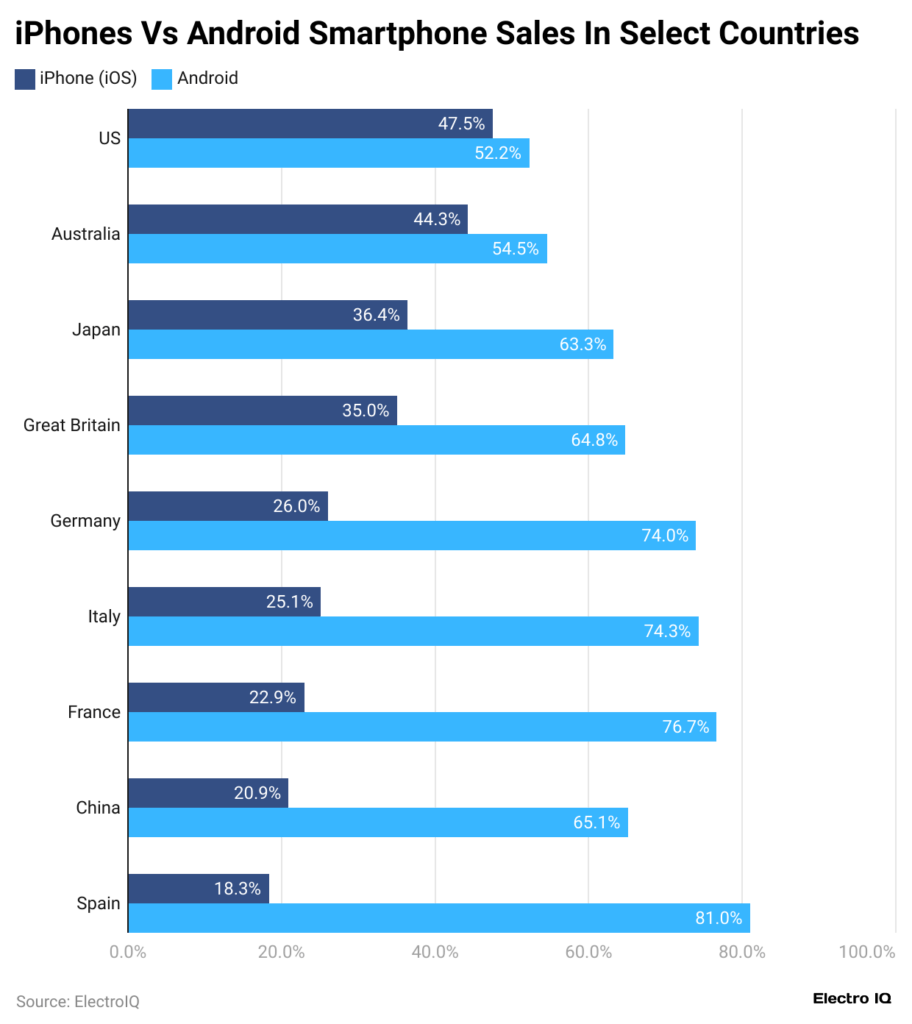
- In the US, Android leads with 52.2% while iPhones hold 47.5%, showing a nearly balanced market.
- In Australia, Android commands 54.5% compared to 44.3% for iPhones, reflecting a steady Android preference.
- In Japan, Android dominates with 63.3%, while iPhones trail at 36.4%, highlighting regional brand loyalty.
- In Great Britain, Android takes 64.8% of sales, far ahead of iPhones at 35.0%.
- In Germany, Android accounts for 74.0%, leaving iPhones at just 26.0% of the market.
- In Italy, Android holds 74.3%, while iPhones capture 25.1%, showing strong Android dominance.
- In France, Android commands 76.7%, with iPhones at 22.9%, underscoring Europe’s Android-heavy market.
- In China, Android has 65.1%, while iPhones remain at 20.9%, reflecting Android’s global scale.
- In Spain, Android peaks at 81.0%, compared to iPhones at 18.3%, marking one of the widest gaps.
Android Smartphone Sales
- Around 1.3 billion Android smartphones were shipped in 2024, up from over 1 billion the previous year.
- Android OS devices made up 76% of smartphone shipments in Q1 2025, growing from 74% in Q4 2024.
- Android shipments have consistently exceeded those of iOS since 2015.
- Android units led iOS in every quarter of 2024.
Best‑Selling Android Smartphones
- The Samsung Galaxy S25 series topped global Android sales in Q1 2025, leading both units and revenue in the flagship segment.
- Xiaomi’s entry-level models retained strong demand in emerging markets, capturing over 25% of global Android shipments outside premium tiers.
- Oppo’s Reno line reported a 15% year-over-year sales increase in Southeast Asia, bolstered by aggressive specs-to-price positioning.
- The OnePlus Nord series grew by 12% in Europe, appealing to mid-range buyers seeking performance.
- Google’s Pixel 8a saw a notable sales bump, up 10% compared to the 7a, thanks to AI camera enhancements.
- In India, Samsung’s A-series and Xiaomi’s Redmi Note series consistently ranked among the top sellers, each claiming about 20% of local Android device sales.
- The surge in foldable devices, led by Samsung and Oppo, translated into a 30% increase, though still a niche in the total Android market.
- Motorola’s Edge series gained 8% share in Latin America, driven by improved battery life and competitive pricing.
Android Version Distribution
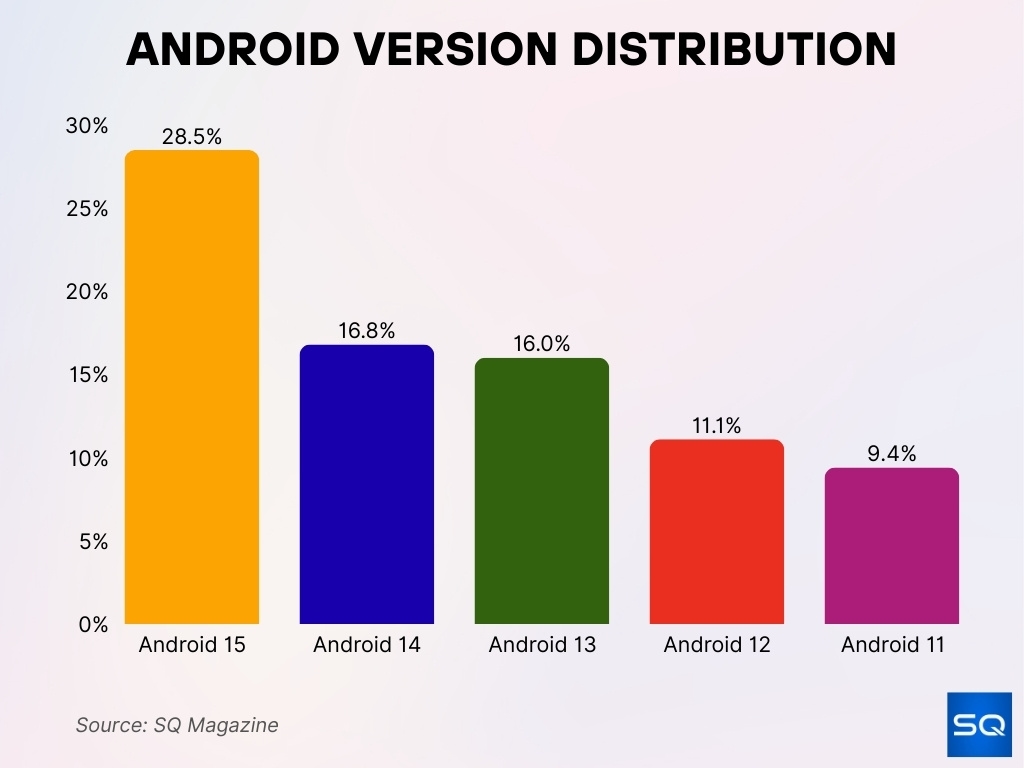
- As of mid-2025, Android 15 holds 28.5% while Android 14 sits at 16.8%.
- Android 13 accounted for 16% of devices in mid‑2025.
- Android 12 remained relevant, covering 11.1% of devices.
- Older versions like Android 11 made up 9.4% of the active device base.
Android App Store Statistics
- The Google Play Store hosted approximately 2.06 million apps by early 2025.
- The total may be 3.3 million apps, reflecting platform expansion.
- Developers push an average of 1,205 new apps daily, with about 41,000 added monthly.
- Active publishers numbered around 580,876 developers.
- Play Store installs climbed by 31%, reaching 28.3 billion new app installs between 2023 and 2024.
- Approximately 97% of apps are free, while just 3% are paid.
- Over 95% of apps receive annual updates, 28% are updated weekly, 72% monthly.
Google Play Store Revenue
- User spending on the Google Play Store reached between $46.7 billion and $55.5 billion.
- Projections estimate revenue will reach $60–65 billion in 2025.
- Some figures cite 2024 revenue at $46.7 billion, reflecting variation in data sources.
- Business models with heavy reliance on in-app purchases and advertising underpin this growth.
- Despite having more apps, the Play Store still trails Apple in revenue due to spending behavior differences.
Global Android Vendor Market Share
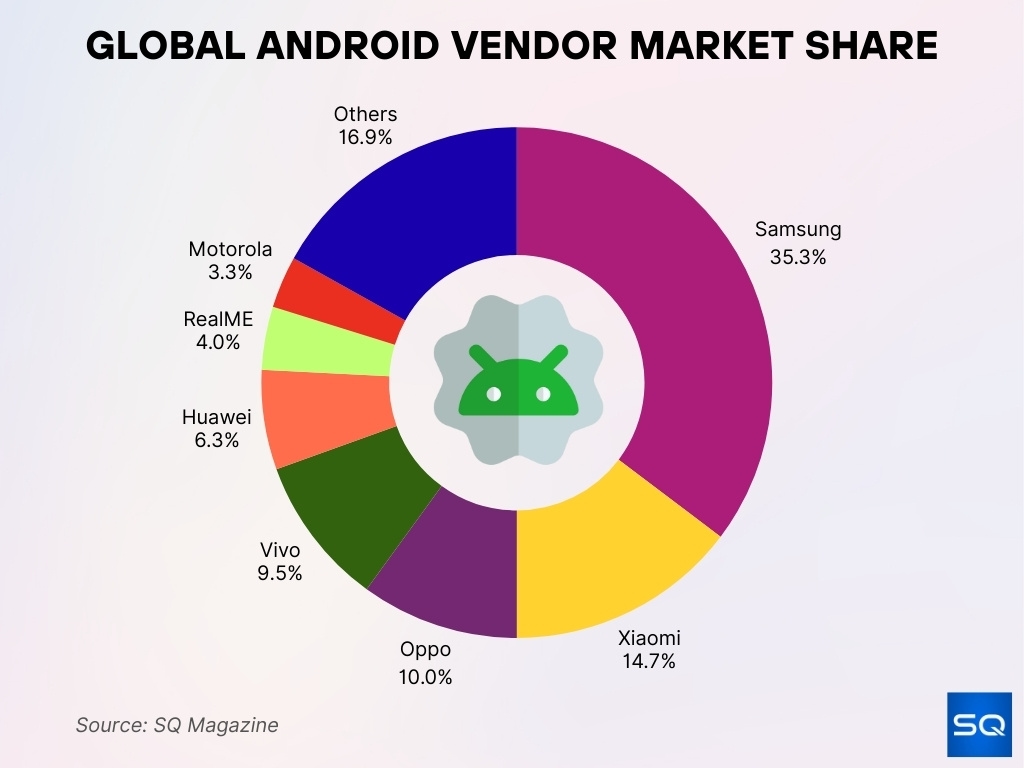
- Samsung leads the market with 35.3%, holding over one-third of the global Android share.
- Xiaomi secures 14.7%, ranking as the second-largest Android vendor worldwide.
- Oppo captures 10.0%, establishing itself as a strong mid-tier competitor.
- Vivo holds 9.5%, keeping close competition with Oppo in global sales.
- Huawei maintains 6.3%, despite regulatory and market challenges.
- RealME accounts for 4.0%, sustaining its position among emerging brands.
- Motorola holds 3.3%, reflecting a modest share compared to top vendors.
- Other brands collectively represent 16.9%, showing the fragmented nature of the remaining market.
Most Downloaded Android Apps
- In July 2025, ChatGPT led downloads with 52 million installs globally.
- TikTok followed closely with 39 million, and Instagram with 38 million downloads.
- Temu ranked top in shopping apps, with 27 million downloads, and CapCut logged 23 million.
- April 2025 saw ChatGPT again at 52 million, and Tinder reached 60 million downloads overall in 2024.
- TikTok, Instagram, and WhatsApp remained the top three global download leaders in 2025.
- Social apps accounted for 31% of global downloads, with shopping apps like Amazon, SHEIN, and Flipkart exceeding 2 billion cumulative downloads in 2025.
User Demographics
- Android accounts for roughly 72.7% of global mobile OS share in 2025; iOS holds ~26.9%.
- In the U.S., iOS leads with 55%, while Android has 45% market share.
- Android penetration in India stands at 92%, and in China at 67%.
- Android controls 71.85% of the global market share in 2025, with 42.34% in the U.S., and more than 85% in emerging markets.
- Smartphone ownership among U.S. ethnic groups is high, 75–77% across white, Hispanic, and Black populations.
- Android appeals more to older U.S. demographics; in December 2023, iPhone usage led in the 18–29 age group (44% vs 30%), but Android regained preference in older groups.
User Behavior & Activities
- U.S. smartphone users spend 3 hours and 45 minutes daily in apps, while browser time averages just 18 minutes.
- Android users average 3h 42m of screen time, send 26 texts, and take 7 selfies per day.
- More than 90% of mobile time is spent within apps, not web browsers.
- Emerging markets continue a trend toward mobile-first behaviors, and apps dominate news, payments, and social interaction.
- Android’s openness fosters customization; a growing share of users install alternative launchers, keyboards, and icon packs.
- Social media, messaging, and video apps remain top usage categories worldwide.
- Increased adoption of AI features, like in-app translation and editing tools, increases multitasking and app engagement times.
Device Upgrade Cycles
- The average smartphone replacement cycle in the U.S. is just over 2.5 years.
- By mid‑2025, nearly 11% of U.S. consumers reported a recent upgrade, and 16% plan to upgrade within six months.
- Slower innovation and minimal year-over-year hardware changes extend upgrade intervals.
- Foldables and AI-enabled handsets are pushing faster replacement cycles due to clear functional differences.
- Manufacturers offering extended software support (e.g., 7–8 years for Samsung, Pixel, Fairphone) influence longer ownership periods.
- Budget-conscious consumers increasingly hold onto phones longer during economic uncertainty.
- Pricing pressures and AI features are nudging some users to upgrade sooner.
Regional Trends in Android Adoption
- Android holds 86.6% in Africa, 90.9% in Latin America, and dominates much of Asia-Pacific.
- In India and Indonesia, Android exceeds 85% market share; in Brazil, similar dominance appears.
- North America remains more balanced, iOS leads with around 58% in the U.S., and Android holds ~42%.
- In Europe, Android holds about 65%, buoyed by affordability and app diversity.
- Regional differences reflect economics, device availability, and brand preference, with Android being strongest in emerging economies.
Android Price Segmentation
- The average global selling price (ASP) of Android smartphones is approximately $254.
- Mid-range models ($200–$500) accounted for 45% of sales in 2023, and are expected to grow to 47% in 2024.
- High-end devices (priced above $500) made up 25% of Android sales in 2023, with growth forecasted.
- Flagship models like Pixel 9 Pro ($999+), Galaxy S25 Ultra ($1,200+), and Pixel 9a ($499) illustrate high-end vs mid-range segmentation.
- Search interest for “latest Android phones” surged from 62 to 100 (August 2024 to 2025), pointing to peak interest in premium launches.
- Economic pressures hit the budget segment hardest in developing regions, shrinking low-cost unit sales.
- Demand for AI features and long-term updates is driving growth in premium pricing tiers.
AI Integration in Android Devices
- Samsung’s Galaxy S25 series, launched in February 2025, features an AI personal concierge, with CPU performance up 37% and neural processing up 40%.
- Google’s Pixel 10 lineup introduces AI enhancements in the camera, real-time translation replicating a user’s voice, and the Magic Cue assistant, all on-device.
- Honor Magic V5 delivers real‑time on‑device translation with 38% faster inference and 16% improved accuracy.
- Motorola’s Razr 2025 series includes the adaptable Moto AI suite, “Pay Attention,” “Remember This,” generative photo tools, and “Next Move” suggestions.
- Google extends its AI expertise beyond phones; Gemini now powers Wear OS 6 smartwatches, Android Auto, and smart TVs.
- Developers gained access to on‑device AI tools like Gemini Nano, GenAI APIs in ML Kit, and Firebase‑powered flagship models.
- Android is reportedly exploring “Zero UI” design paradigms, where gesture-based, voice-driven, and context-aware AI interfaces may replace traditional screen interactions, an idea promoted by Google’s design teams and experimental Android UX labs.
Conclusion
Android’s landscape reflects a dynamic balance of scale, innovation, and regional diversity. Over 3.3 billion users engage in app-first behaviors, supported by a fragmented upgrade cycle averaging 2.5 years, yet shifting as AI gains influence. Samsung, Xiaomi, Vivo, and others continue to shape the vendor map amid slowing global growth. Price segmentation reveals a robust mid-range tier, even as premium AI-enhanced devices climb.
The rise of AI, embedded in flagship phones and software ecosystems, signals Android’s evolution beyond smartphones into intelligent companions. Whether in foldables, watches, or everyday apps, the integration of Gemini, context-aware tools, and real-time processing redefines user expectations. In short, Android remains a global foundation, now accelerating toward an intelligent, responsive future.

