The stablecoin market has grown into a substantial piece of the digital asset ecosystem, influencing payments, treasury operations, and cross-border flows. In the financial services industry, corporates use stablecoins for near-instant settlement across jurisdictions, and in DeFi, protocols rely on them for liquidity and risk-hedging. This article examines how stablecoins distribute across different blockchain networks and segments. Explore the full breakdown below.
Editor’s Choice
- The global stablecoin supply recently surpassed $308 billion in 2025.
- USDT and USDC now hold nearly 90% of the total stablecoin market share as of November 2025.
- In September 2025, about 64% of stablecoin transactions were settled on the Ethereum and Tron blockchains.
- Between June 2024 and June 2025, USDT monthly transaction volume ranged around $703 billion, peaking near $1.01 trillion.
- A May 2025 survey found that among stable-coin payments companies, about 90% of volume was attributed to USDT.
- Stablecoin payment volumes (daily) are estimated at around $30 billion, still under 1% of global money flows.
- Most stablecoins (>99%) remain denominated in U.S. dollars.
Recent Developments
- The total supply of stablecoins has grown by 100% in the past 18 months.
- Adjusted annual stablecoin transaction volume reached approximately $9 trillion in 2025, up about 87% year-on-year.
- Stablecoins facilitated over $46 trillion in gross transaction flows in the last 12 months.
- One major stablecoin issuer held around $98.5 billion in U.S. Treasury bills by Q1 2025.
- B2B stablecoin flows annualize at $36 billion and P2P flows at $18 billion as of early 2025.
- Binance Smart Chain controls about 14-16% of the stablecoin supply, ranking second.
- Tron leads as the most active stablecoin settlement chain with roughly 60% of on-chain trade volume.
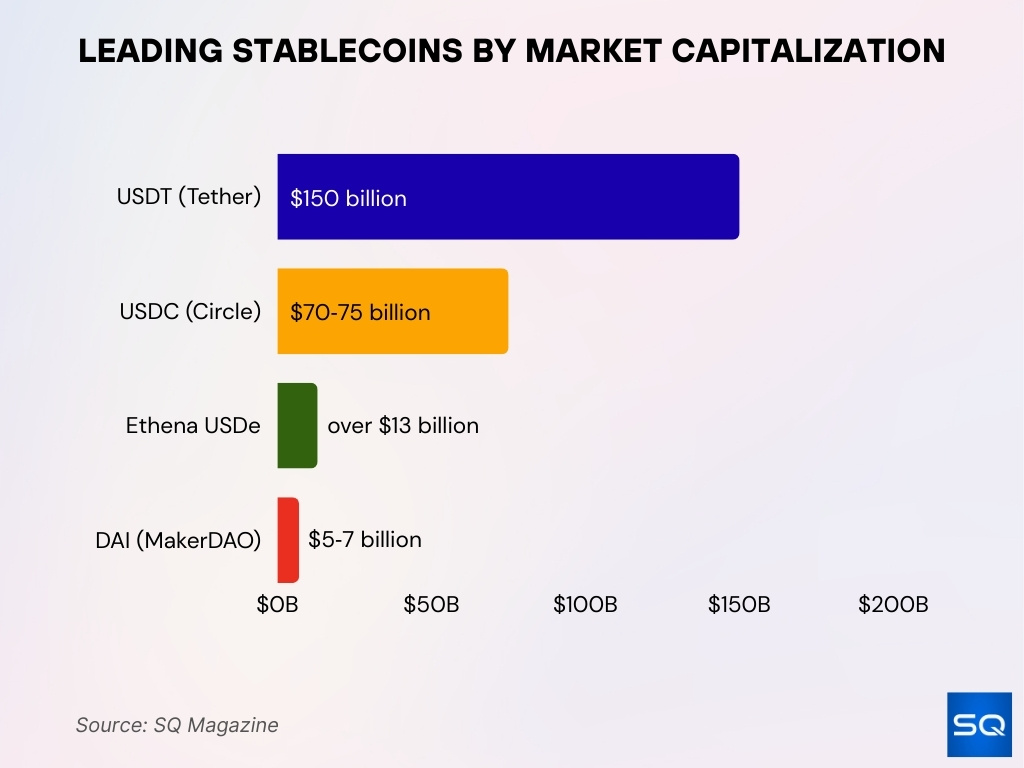
Leading Stablecoins by Market Capitalization
- USDT (Tether) leads with over $150 billion in market cap as of mid‑2025.
- USDC (Circle) holds second place with a $70–75 billion market cap.
- Ethena USDe has risen fast, reaching over $13 billion in market cap.
- DAI (MakerDAO) trails with $5–7 billion, depending on the supply metric used.
Top Chains for Stablecoin Circulation
- Ethereum network holds approximately 70% of all stablecoin supply as of mid-2025.
- Tron network processes over $78 billion in circulating USDT stablecoins with 343 million user accounts.
- Ethereum + Tron accounted for about 64% of stablecoin transaction volume in September 2025.
- Polygon Network’s stablecoin supply grew by 85% over 18 months, reaching about $3 billion in Q3 2025.
- Ethereum network stablecoin supply hit a record $166 billion, bolstering its DeFi settlement role.
- Payment firms rank Tron first by volume, supported by its high daily active user count of 2.6 million.
Stablecoin Share on Ethereum vs Competing Chains
- In September 2025, $772 billion in stablecoin transactions settled on Ethereum and Tron, about 64% of total volume.
- Stablecoins reached a $308 billion total market cap in November 2025.
- Ethereum holds roughly 65.4% of the total stablecoin supply across chains by mid-2025.
- Tron holds about $77.7 billion in stablecoin supply, ranking second to Ethereum.
- Ethereum’s steady throughput supports large stablecoin and DeFi flows despite fees spiking up to $15-$30 during congestion.
- Tron delivers an average transaction fee of less than $0.001, making it cost-effective for payments.
- Ethereum’s monthly stablecoin transaction volumes reached $2.82 trillion in October 2025, dominant but facing competition.
- Tron processes over $78 billion in circulating USDT stablecoins with 2.6 million daily active users in 2025.
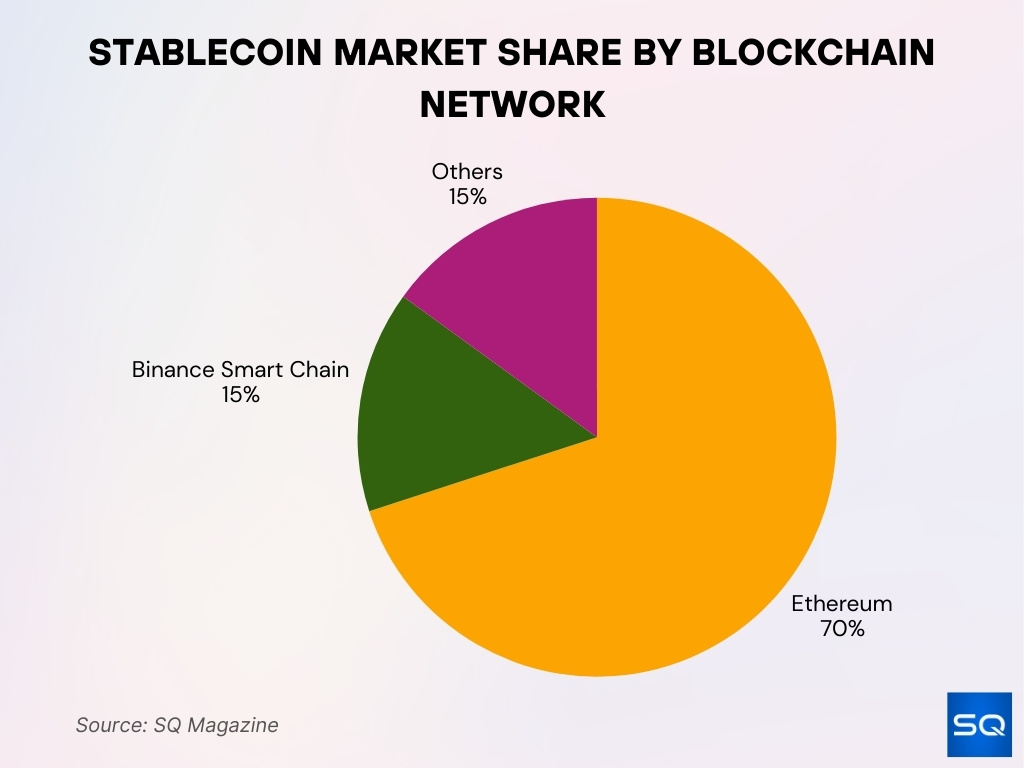
Stablecoin Market Share by Blockchain Network
- Ethereum dominates with about 70% of the total stablecoin supply.
- Binance Smart Chain holds around 15% of the stablecoin market.
- Solana, Tron, Polygon, and others collectively share the remaining 15%.
Activity on Emerging Blockchains
- Avalanche, Polygon, and Binance Smart Chain accounted for 82.8% of non-USD pegged stablecoin transactions in Southeast Asia Q2 2025.
- Stablecoin supply on non-Ethereum chains rose by over 40% year-on-year to mid-2025.
- Latin America and Africa reported stablecoin-to-GDP usage of around 6-7% in regional remittance flows.
- Active wallets holding stablecoins on newer chains increased by more than 50% year-over-year.
- Layer 2 roll-ups saw stablecoin liquidity pools grow by over 100% in 2025.
- Lower transaction costs on alternative chains attracted users away from high-fee networks.
- Cross-chain stablecoin transfer volume grew by approximately 25% in the first half of 2025.
- Stablecoins on emerging chains represent nearly 15% of total stablecoin DeFi activity outside Ethereum.
- Avalanche led Southeast Asia non-dollar stablecoin transactions with a 39.4% share in Q2 2025.
- Polygon held a 39.2% share of active stablecoin wallets among Southeast Asia’s non-USD stablecoins in Q2 2025.
Fiat-backed vs Crypto-backed Stablecoins
- As of early 2025, fiat-backed stablecoins still account for the vast majority of supply, over 90% of the market.
- More than 99% of fiat-backed stablecoins are pegged to the U.S. dollar.
- Crypto-backed stablecoins (those backed by other crypto-assets) represent less than 10% of market cap and have grown modestly.
- On average, crypto-backed stablecoins trade with higher volatility and have collateral ratios of >150% to absorb crypto risk.
- Monthly transaction volume in fiat-backed stablecoins exceeded $1 trillion in some months in 2025, driven by trading and institutional flows.
- Crypto-backed stablecoins’ use is concentrated in DeFi collateral and synthetic-asset issuance rather than payments.
- Some issuers of fiat-backed coins reported treasury holdings of U.S. Treasuries and short-term cash equivalent reserves in hundreds of billions (for example, USDT held $98.5 billion as of Q1 2025).
- Market participants cite reserve transparency as a key differentiation; fiat-backed models are increasingly subject to audit and regulatory scrutiny.
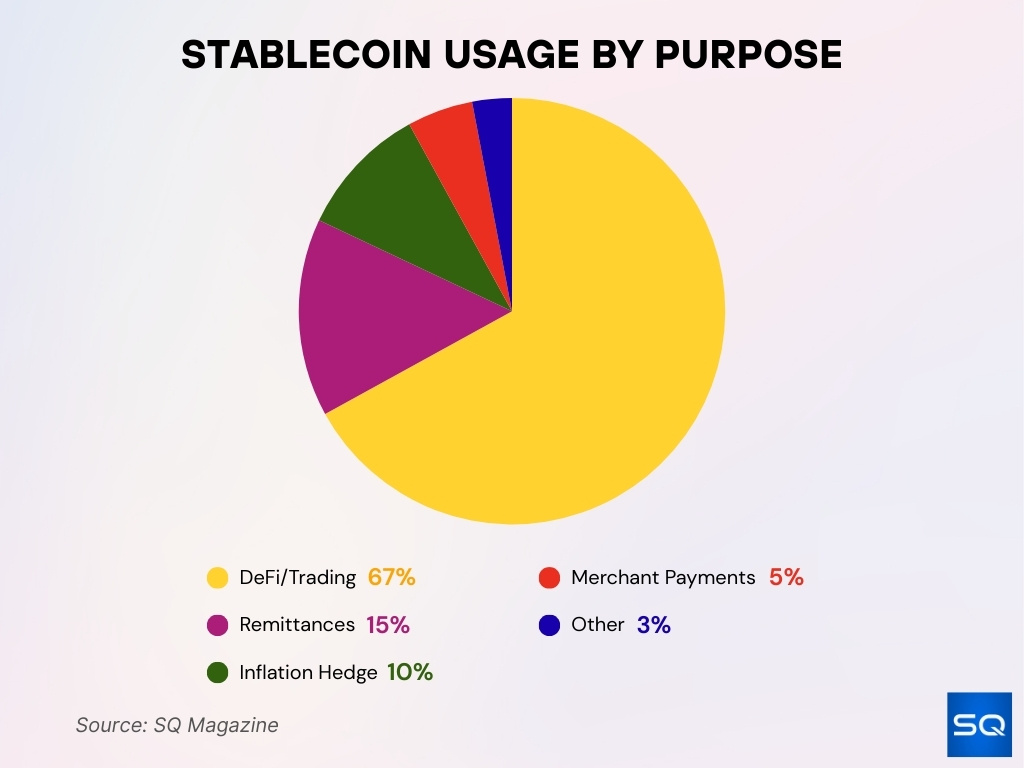
Stablecoin Usage by Purpose
- DeFi and Trading dominate with 67% of total stablecoin usage.
- Remittances account for 15%, driven by cross-border adoption.
- Inflation hedging makes up 10%, used in unstable economies.
- Merchant payments hold 5%, reflecting retail and business use.
- Other purposes represent 3%, showing emerging experimental cases.
Algorithmic Stablecoins, Market Share by Chain
- Algorithmic stablecoins, those without full collateral backing, now represent a minor share of the stablecoin market in 2025.
- FRAX displayed year-over-year growth of ~1,277% in 2025 among algorithmic/hybrid coins.
- Chains known for high DeFi activity (e.g., Ethereum L2s) host the bulk of algorithmic stablecoin issuance.
- Algorithmic coins show a higher risk of peg deviation, which has dampened institutional adoption.
- Some algorithmic models are hybrid, partially collateralised, using governance tokens and liquidity incentives rather than pure algorithmic supply control.
- Volume of algorithmic stablecoins remains small relative to fiat-backed coins, so chain-share by algorithmic coins is correspondingly limited (<5%).
Centralized vs Decentralized Stablecoin Market Share
- Centralized stablecoins held over 80% of the total supply and usage in 2025.
- Decentralized stablecoins represent about 20% of the market, up from ~18% in 2023.
- Centralized stablecoins USDC and USDT dominate liquidity, trading pairs, and institutional flows.
- Decentralized stablecoins see higher usage in governance, protocol treasuries, and DeFi collateral.
- About 75% of all DeFi liquidity is stablecoin-backed, mostly from decentralized coins like DAI.
- The total stablecoin market cap reached around $308 billion in October 2025, with centralized coins leading.
Stablecoins as a Proportion of the Crypto Market
- Bitcoin leads with $2,303 billion, making up 60% of the crypto market.
- Stablecoins represent $265 billion, accounting for 7% of the market.
- Other cryptocurrencies total $1,292 billion, holding the remaining 33%.

Leading Decentralized Stablecoins by Network
- DAI (on the MakerDAO protocol) is the largest decentralized stablecoin, with a market cap of ~$10 billion and wide DeFi use.
- FRAX is a hybrid model (part algorithmic, part collateralised) showing rapid growth in pool usage and network coverage.
- RSV holds about $500 million in supply and is relevant in Latin America remittance flows.
- Other decentralized coins (e.g., LUSD) remain well under $1 billion in cap but serve niche applications in synthetic assets and DeFi.
- On-chain data shows Ethereum remains the predominant chain for decentralized stablecoin deployment and usage.
- Many decentralized stablecoins integrate cross-chain bridges and liquidity protocols, increasing network distribution beyond single ecosystems.
Regional Differences in Stablecoin Usage
- Between June 2024 and June 2025, USDT processed peaks of ~$1.01 trillion in monthly transaction volume.
- Regional realities are shaping the stablecoin race, with Asia and Africa driving high growth in volumes.
- In emerging markets, stablecoins are increasingly used as a hedge against inflation, with millions of users globally transacting 24/7 at very low cost.
- The average stablecoin supply in circulation grew by ~28% year-over-year in early 2025.
- Regional adoption in Asia and Africa contributes nearly 50% of global stablecoin transaction volume.
- In the United States, consumer use of cryptocurrency for payments declined from 2022 to 2024, with 6.3% of Black consumers using crypto for payments in 2022, falling to 3.2% in 2024.
- Payment providers globally report that stablecoins are key for cross-border remittances and B2B flows in regions where banking infrastructure is weak.
- Some regions are exploring local digital-fiat stablecoins, such as the launch of a regulated naira-pegged stablecoin in Nigeria.
Stablecoin Adoption in DeFi Platforms by Chain
- Stablecoin usage in DeFi accounts for roughly $60 billion in value as of early 2025.
- Stablecoins represent about 30% of all crypto transaction volume between January and July 2025.
- On Ethereum, stablecoins dominate as collateral in lending and liquidity pools.
- Stablecoins on Layer 2 chains capture a growing share of DeFi total value locked (TVL) due to lower fees and faster settlement.
- Over 90% of financial institutions are actively using stablecoins for payments and settlement via DeFi rails.
- DeFi liquidity pools with stablecoin collateral have increased by over 40% in TVL in 2025.
- Protocols like Aave and Compound increased stablecoin-backed loans to over $14 billion in Q3 2025 with borrowing APRs near 6.7%.
Cross-Border Stablecoin Transactions by Blockchain
- Stablecoins are increasingly powering cross-border payments, remittances, and B2B flows due to their cost and speed advantages.
- In Brazil, roughly 90% of crypto flows are tied to stablecoins.
- USDT processed ~$703 billion per month on average between June 2024 and June 2025, with peaks at ~$1.01 trillion.
- The use of stablecoins for cross-border settlement is strongest on chains with low fees and fast settlement, like Tron and Ethereum.
- Stablecoin flows bridging chains grew by an estimated ~25% in H1 2025 in banking and fintech use cases.
Merchant and Institutional Adoption by Network
- Over 300 banks and payments providers have onboarded stablecoins, processing about 15% of global stablecoin volume via one platform.
- 57% of financial institutions plan to actively explore stablecoin services, with 15% already offering them.
- Institutional flows favor chains with strong enterprise support and audit transparency.
- Stablecoin settlement volumes annualized over $4 trillion between January and July 2025.
- Major payment networks are developing stablecoin-linked products for merchants, signalling growing mainstream adoption.
- Merchants benefit from stablecoins’ near-instant settlement, 24/7 availability, and cross-border reach.
- Trusted banks and institutions drive consumer adoption, with over 75% of consumers willing to try stablecoins if offered by their bank.
Frequently Asked Questions (FAQs)
Approximately 70%.
About 64%.
Fiat-backed coins account for over 90%, while crypto-backed coins are under 10%.
About 90% of stablecoin volume is among that sample.
Conclusion
Stablecoins have clearly stepped beyond niche crypto-use and are now gaining meaningful traction across payments, DeFi, cross-border settlement, and institutional operations. The chains that support them, especially those offering strong regulatory compliance, low fees, and broad interoperability, are rising in market share. Regional adoption is accelerating in Asia, Africa, and Latin America, and the regulatory environment is becoming more mature. The full implications for the global payments system and blockchain settlement infrastructure remain unfolding, but the data point to a durable shift.


