The streaming world revolves significantly around Netflix, which continues to deepen its impact on global entertainment and media consumption. From the rise of ad-supported tiers to strategic live-event programming, Netflix’s evolution is visible in both consumer behavior and industry economics. For example, major sports and original releases have translated into stronger subscriber growth and higher engagement. And in markets like the U.S. and Latin America, content strategy shifts are already influencing competition among streaming services. Read on to explore detailed statistics that shape Netflix’s current trajectory.
Editor’s Choice
- In Q1 2025, Netflix generated about $10.54 billion in revenue, up ~13 % from Q1 2024.
- Netflix ended 2024 with about 301.6 million paid subscribers globally.
- Global average revenue per user (ARPU) rose to about $11.70 in 2024.
- The U.S. & Canada region posted an ARPU of roughly $17.26 in 2024.
- Netflix announced it will stop reporting quarterly subscriber counts starting in 2025, focusing instead on revenue and engagement metrics.
Recent Developments
- Netflix will cease reporting quarterly global subscriber totals beginning in 2025; it views revenue and engagement as more meaningful metrics.
- The platform recorded its largest-ever quarterly gain of 18.9 million paid subscribers in Q4 2024.
- Netflix’s ad-supported tier hit 94 million users as of May 2025, revealing strong uptake for lower-cost options.
- Netflix expanded into live-event content, e.g., major boxing matches, NFL games, to attract new users and boost engagement.
- Password-sharing enforcement increased in 2024, which appears to have helped convert non-paying users into subscribers.
- Netflix’s content spend for 2025 was projected at about $18 billion, supporting growth strategies in originals and global markets.
TV and Streaming Snapshot
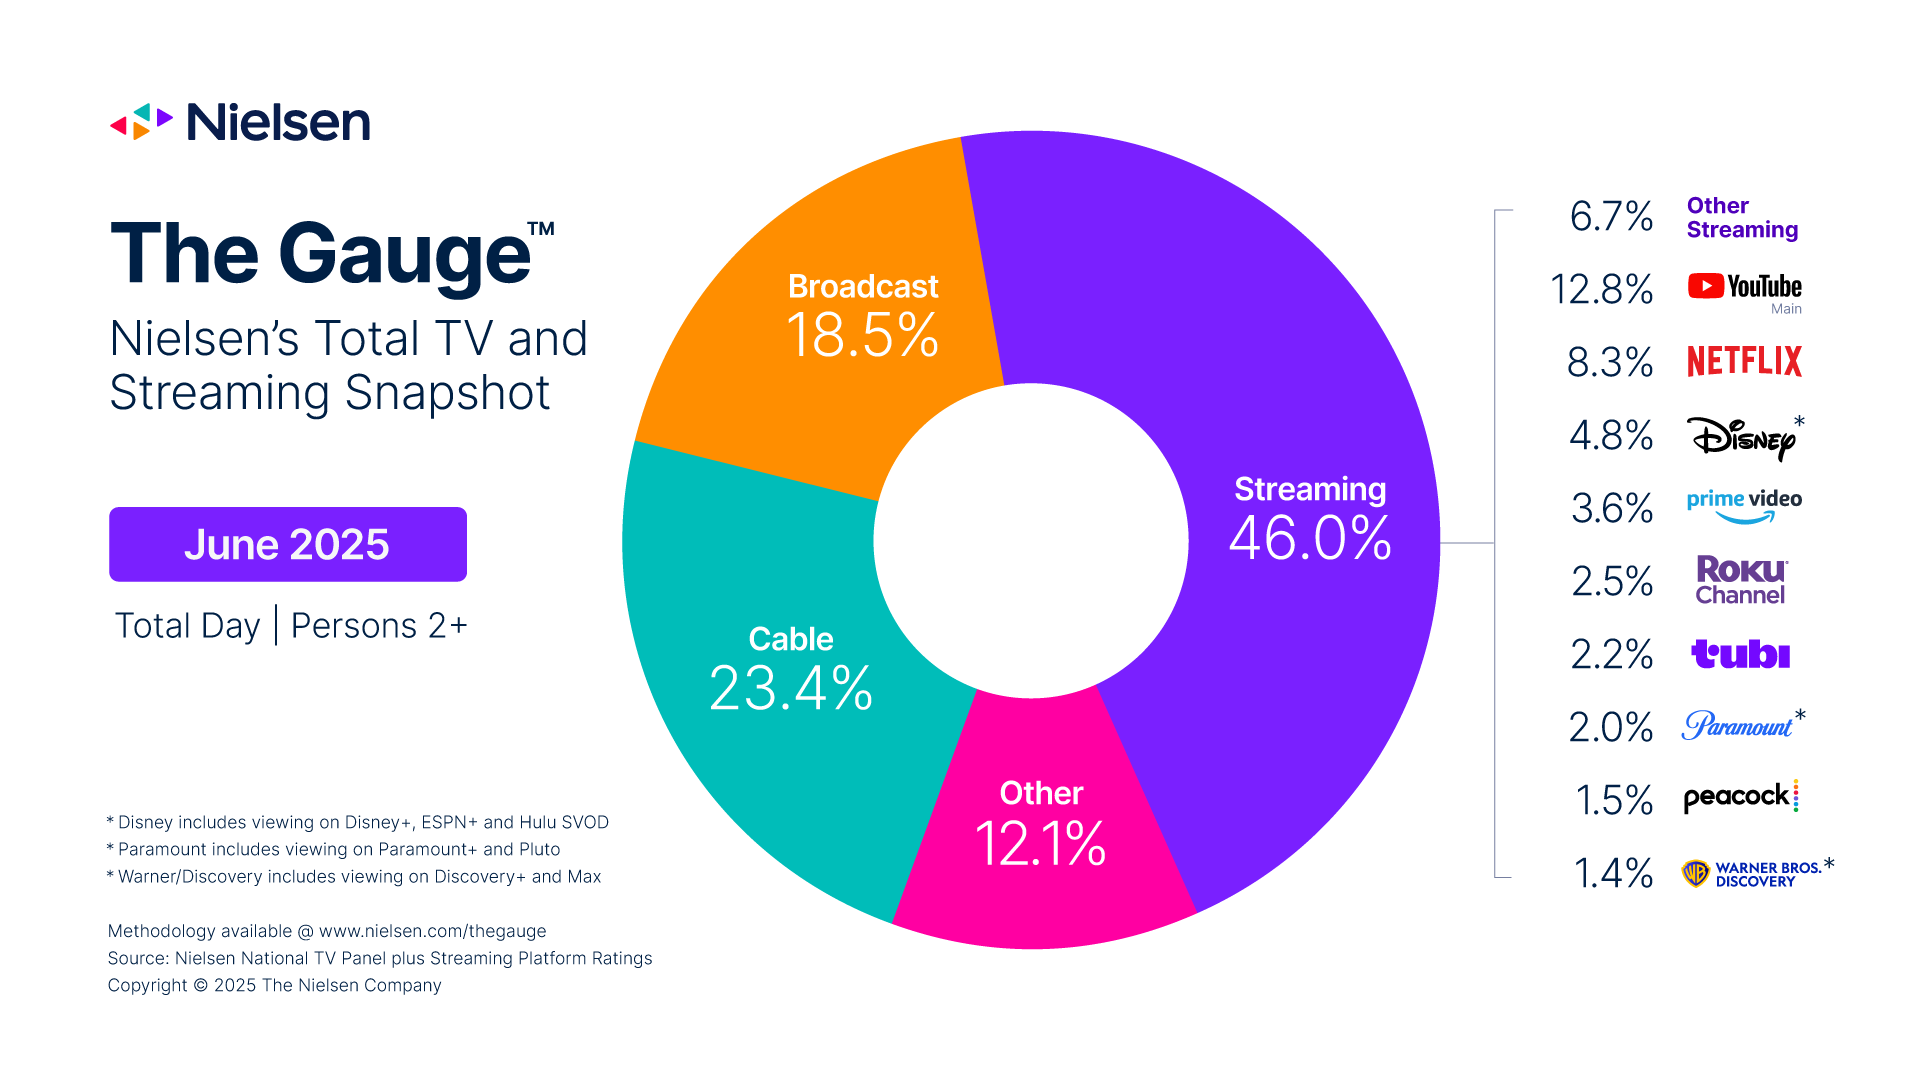
- Streaming accounts for 46.0% of total TV viewing in the U.S. This makes it the dominant way people consume content today.
- Cable holds 23.4%, still ahead of broadcast networks. It shows that traditional pay-TV maintains a sizable footprint.
- Broadcast TV captures 18.5% of total viewing hours. This share continues to decline year over year.
- Other sources represent 12.1% of total TV time. These include gaming, physical media, and miscellaneous inputs.
- YouTube leads all streaming platforms with 12.8% of total viewing. It outpaces even paid services in daily reach.
- Netflix holds 8.3% of the total streaming share. It remains the most-watched subscription-based platform.
- Disney+ (including Hulu and ESPN+) captures 4.8% of streaming. This reflects the strength of Disney’s bundled services.
- Amazon Prime Video has 3.6% of total streaming time. It continues to benefit from its bundled offering with Prime memberships.
- The Roku Channel accounts for 2.5% of streaming share. Its free, ad-supported model appeals to budget-conscious viewers.
- Tubi captures 2.2% of the total streaming audience. It continues to grow through its AVOD (ad-supported video on demand) strategy.
- Paramount (including Pluto) makes up 2.0% of streaming. Its combined offering boosts reach across paid and free tiers.
- Peacock holds 1.5% of the streaming market. It remains a smaller but steady player in the hybrid streaming space.
- Warner Bros. Discovery (Max and Discovery+) totals 1.4%. Their consolidation efforts show limited share gains so far.
- Other streaming services together make up 6.7% of viewing. This category includes dozens of smaller niche and regional platforms.
Netflix Subscribers by Region
- Netflix’s ARPU for the U.S. & Canada region in 2024 stood at roughly $17.26 per month.
- EMEA (Europe, Middle East, Africa) region ARPU in 2024 was about $11.11.
- Latin America region ARPU in 2024 was approximately $8.00 per subscriber.
- Asia-Pacific region ARPU in 2024 was roughly $7.34, representing lower monetization despite growth potential.
- By country, the U.S. alone had around 81.4 million subscribers as of early 2025 estimates.
- Estimated subscriber numbers in other markets, Brazil (~15.3 million), UK (~14.1 million) in 2024.
- Netflix derived about 44 % of its revenue from the U.S. & Canada region in recent years.
Netflix Revenue Statistics
- In Q2 2025, Netflix reported revenue of $11.08 billion, up ~15.9% compared to the same quarter in 2024.
- Netflix raised its full-year revenue guidance for 2025 to a range between $44.8 billion-$45.2 billion.
- The U.S. & Canada region contributed a significant portion of revenue, estimates suggest around $17 billion in 2024 from that region alone.
- Netflix’s ad-supported tier (AST) is becoming a meaningful revenue lever; the company projected ad revenues in the billions for 2025 and beyond.
- Content investment, Netflix planned to spend approximately $18 billion on content in 2025.
Subscriber Demographics
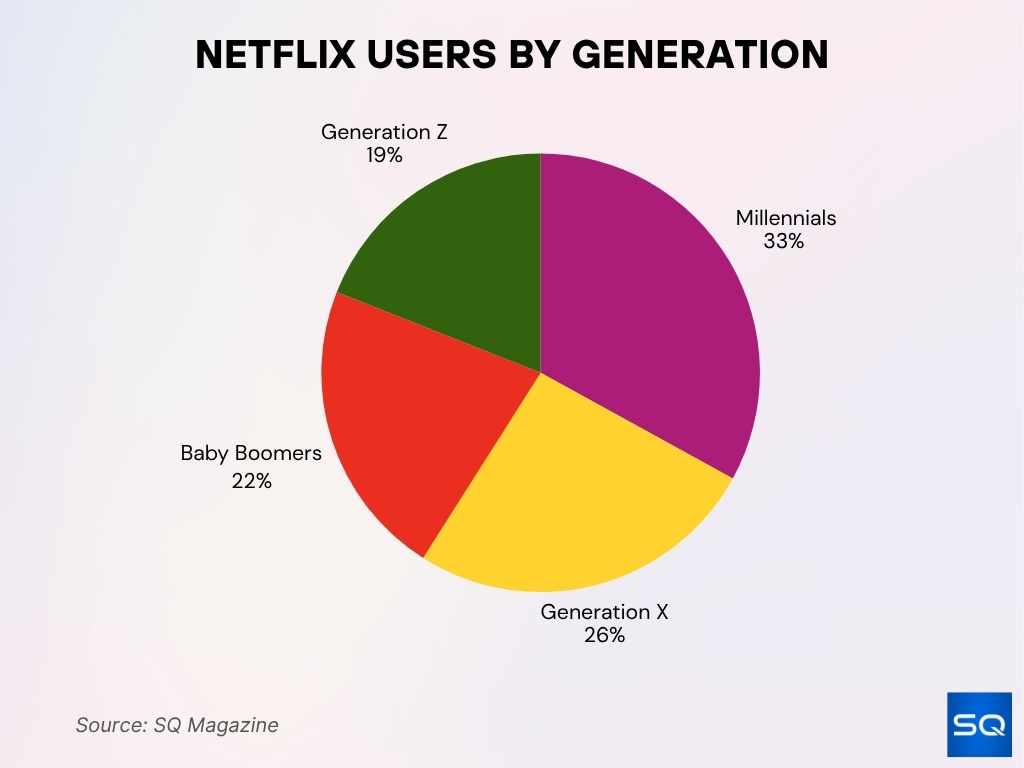
- For Netflix, Millennials (born 1981-1996) represent the largest segment of users at about 33%.
- Generation X accounts for 26% of Netflix users, while Baby Boomers make up 22%.
- Generation Z users (born after 1996) comprise roughly 19% of the audience.
- A large share of subscribers in 2025 is transitioning via Netflix’s ad-supported tier, offering lower price options aimed at younger, cost-sensitive viewers.
Financial Performance of Netflix
- In Q1 2025, Netflix reported revenue of about $10.54 billion, up ~13% from Q1 2024.
- Operating income in Q2 2025 climbed to approximately $3.8 billion, representing a ~45% increase year-over-year.
- Revenue per member (ARPU) continues to rise in mature markets, driven by price increases and premium tiers.
- Cash flow remains positive and robust, giving Netflix flexibility in content investment and global expansion.
- Netflix’s stock valuation assumes continued margin expansion and growth in ad revenue; analysts project longer-term operating margin potential in the low 30s.
- Currency effects (a weakening U.S. dollar) contributed to revenue growth in 2025 when converting international earnings to USD.
- Netflix’s cost structure, especially content amortisation and marketing expenses, remains under scrutiny as it scales original and live event content.
Content Library Size
- Netflix’s U.S. active library reached nearly 7,500 titles in 2024 with a net increase of around 650 titles for the year.
- Netflix’s incremental library growth was about +650 titles in the major U.S. market in 2024.
- Regional Netflix content availability varies significantly due to licensing restrictions, affecting title counts by up to 5,000 titles between countries.
- Netflix increased its global content library by about 18.2% in early 2025, the highest among major streamers.
- Despite large libraries, Netflix’s viewing share per country often remains under 10%, indicating room for growth.
- The share of Netflix Originals in the U.S. reached around 59.36% of the total library by late 2024.
South Korea Subscription Video Market Share
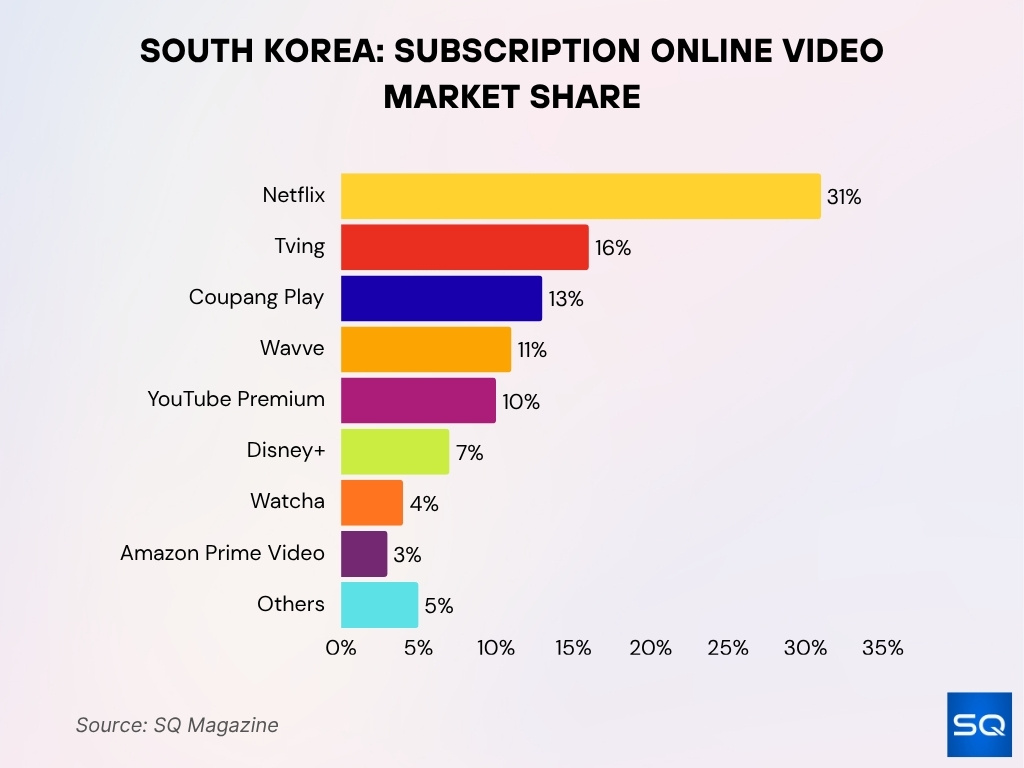
- Netflix holds 31% of the subscription market in South Korea. It remains the dominant SVOD platform in the country.
- Tving captures 16%, making it the second-largest local player. It benefits from strong domestic content and partnerships.
- Coupang Play has 13% of the market share. Its integration with e-commerce has boosted subscriber growth.
- Wavve holds 11%, offering a mix of live TV and on-demand content. It appeals to Korean drama and variety show fans.
- YouTube Premium accounts for 10% of subscriptions. Many users pay for ad-free and background play features.
- Disney+ takes 7% of the market. It’s Marvel, Star Wars, and Pixar libraries that attract younger demographics.
- Watcha holds 4%, supported by Korean indie and niche content. It maintains a loyal but smaller user base.
- Amazon Prime Video has 3% of subscriptions. Its global content draws a limited but growing segment.
- Other platforms make up 5% of the market. This includes niche services and regional offerings with small subscriber bases.
Netflix Original Content Statistics
- As of Q2 2024, Netflix accounted for about 25% of the world’s streaming original series supply, positioning it far ahead of competitors.
- Netflix releases more than 700 titles per year across films, documentaries, animation, reality TV, and stand-up.
- In the U.S. catalogue, over 3,700 Original/Exclusive titles were identified, based on tracking data for early 2022; this number is higher globally today.
- Netflix’s original content investment in 2025 was planned at around $18 billion, signalling heavy spending on content creation.
- The emphasis on originals supports Netflix’s goal to reduce dependency on licensed content and improve retention metrics.
- Original content spans multiple languages and regions, and Netflix’s global originals catalogue contributes to subscriber growth in non-U.S. markets.
Device Usage and Streaming Preferences
- Smart-TV or TV-linked devices accounted for ~60% of viewing during peak hours (8 pm-10 pm) per a device-specific usage breakdown.
- In early morning hours, viewing via smartphones accounted for ~30% whereas TV usage fell to around 40%.
- In households globally, smart TVs lead as the top streaming device, used in about 74.5% of streaming households.
- Streaming sticks and dedicated media players followed smart TVs, with usage rates around 64% in surveyed markets.
- Mobile devices in certain Asia-Pacific markets surpassed desktops for streaming usage, mobile ~45%, TV ~43%, desktops ~7%.
- The shift toward ad-supported tiers and device flexibility suggests younger viewers favour multi-device access (TV + mobile).
- According to usage data, average Netflix subscribers spent around 63 minutes per day on the service in 2025.
- A sizable portion of Netflix viewing happens outside typical prime time via mobile or tablet, especially among younger adults and Gen Z.
Most Popular Netflix Shows and Movies
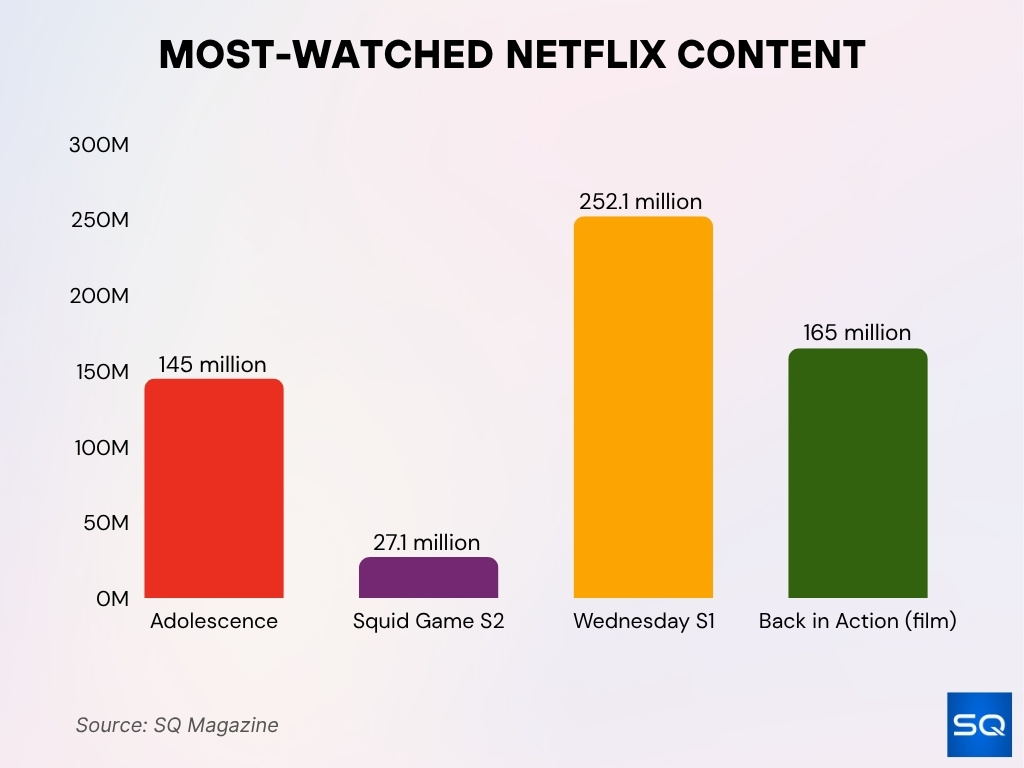
- The limited series Adolescence hit ≈ 145 million views worldwide in early 2025.
- Squid Game Season 2 led global charts with around 27.1 million viewers according to a major ranking covering 2024-25.
- The show, Wednesday Season 1, remains the all-time leader for the platform with 252.1 million views in its first 91 days.
- Among films, Back in Action (2025) ranked as the most-watched movie in the first half of 2025 on Netflix with 165 million views.
- Platform-wide, Netflix reported more than 95 billion hours of content streamed in the first half of 2025.
- Non-English and international titles continue to rise; roughly 10 of the top 25 series were non-English language in the first half of 2025.
- Do not underestimate older titles; shows like Ozark and Money Heist still generate significant viewership despite their age.
User Engagement Statistics
- As noted, Netflix users streamed over 95 billion hours globally in just the first half of 2025.
- Viewership diversity, thousands of titles accounted for nearly 99% of streaming hours in that period.
- The average Netflix user watched approximately 63 minutes per day on the platform in 2025.
- Originals remain key, major hits like Adolescence recorded tens of millions of views in their first weeks.
- Viewing patterns reflect strong global engagement; non-English language series are 40%+ of top lists in many regions.
- For desktop and mobile usage combined, beyond TV screens, “on-the-go” viewing still forms a meaningful share of total time.
- Engagement metrics are now a primary focus for Netflix’s leadership rather than just subscriber counts.
- The increase in ad-supported membership and interactive formats signals evolving behaviour and monetisation.
Account Sharing Habits
- Surveys found that around 25.6% of Americans share their Netflix account with relatives outside their immediate household.
- Another 17.7% share with friends, and ~9.2% with someone in a different household.
- As of May 2025, Netflix’s ad-supported tier had over 94 million users, underscoring the value of converting shared users to paid.
- Analysts noted that the growth in paid accounts since Netflix’s crackdown on password sharing (starting ~mid-2023) largely reflects monetisation of existing viewers rather than new-market penetration.
- Netflix estimates non-paying use (via shared credentials) still accounts for a significant portion of “viewers not contributing revenue” globally.
- The shift to ad-supported tiers and “extra-member” plans is designed to capture revenue from users who previously shared accounts without paying.
Penetration Rate by Country
- Brazil was estimated at over 15 million users, making it the second-largest market by user count.
- The United Kingdom accounted for ~14 million users in that ranking.
- Germany had around 13 million users, and France had over 10 million in the same dataset.
- In the Philippines, Netflix held about 34% market share of streaming services, with ~2.71 million subscribers.
- Netflix is available in over 190 countries, but penetration (users as % of the population) still varies widely between advanced and emerging markets.
- Latin America and Asia-Pacific show faster growth in subscriber count, but ARPU (average revenue per user) remains lower than U.S./Canada.
- Market share data, streaming (all platforms), overtook traditional TV usage in the U.S. with ~44.8% share of total TV usage.
Trends and Future Projections
- Ad-supported tier revenue is expected to double in 2025 compared to 2024.
- Device usage diversifies with mobile, tablet, and game console streaming increasing share, especially among younger viewers.
- Revenue growth in Asia-Pacific and Latin America was 23% FX-neutral in Q2 2025, outpacing the U.S. growth of 15%.
- Netflix aims for a 2025 operating margin of 28%-30% while balancing investment and margin growth.
- Live events and interactive formats are expected to grow, with Netflix launching real-time voting for live shows in 2025.
- Password-sharing enforcement includes fees of around $8.99 per month for extra account members outside a household.
- Global expansion focuses on tailoring local content and pricing to emerging markets with lower ARPU but high growth potential.
- By August 2025, 45% of U.S. Netflix household viewing hours were on the ad-supported tier.
Frequently Asked Questions (FAQs)
Roughly $17 billion, representing the largest regional share
Ad-tier users reached around 94 million globally.
Forecasted between $44.8 billion-$45.2 billion for 2025.
Conclusion
Netflix remains the dominant global streaming service, but the nature of its growth is evolving. We’re seeing a stronger focus on engagement, monetisation, and global reach rather than simply adding more subscribers. From tens of millions of views for top shows to billions of hours streamed and major shifts in device usage and account-sharing behaviour, the platform is adapting to a mature, competitive landscape. For industry watchers and marketers alike, these statistics tell a story of scale and sophistication. Explore the full article to see how these trends interplay and what they mean for the future of streaming.


