It started with a tap. Somewhere between downloading that meditation app and doomscrolling through social media, the world became mobile-first. Whether you’re a commuter catching up on news or a parent relying on educational games to keep kids engaged, apps are now embedded into our daily routines.
In 2025, mobile apps are no longer just convenient; they’re essential. The ecosystem has exploded in usage, revenue, and innovation. Let’s explore the latest trends and numbers that define the mobile app landscape in this transformative year.
Editor’s Choice
- Over 255 billion mobile app downloads are projected globally in 2025.
- $190 billion in global app revenue is expected in 2025, reflecting a 14% YoY growth.
- Social media apps continue to dominate, with TikTok projected to surpass 1.9 billion monthly active users in 2025.
- The average smartphone user in the US now uses 39 different apps monthly.
- iOS App Store revenue is set to reach $125 billion, still leading over Google Play.
- The average app session duration has dropped slightly to 4.2 minutes, indicating sharper, more focused user behavior.
- Mobile gaming retains the crown for in-app purchase dominance, making up 52% of total app revenue in 2025.
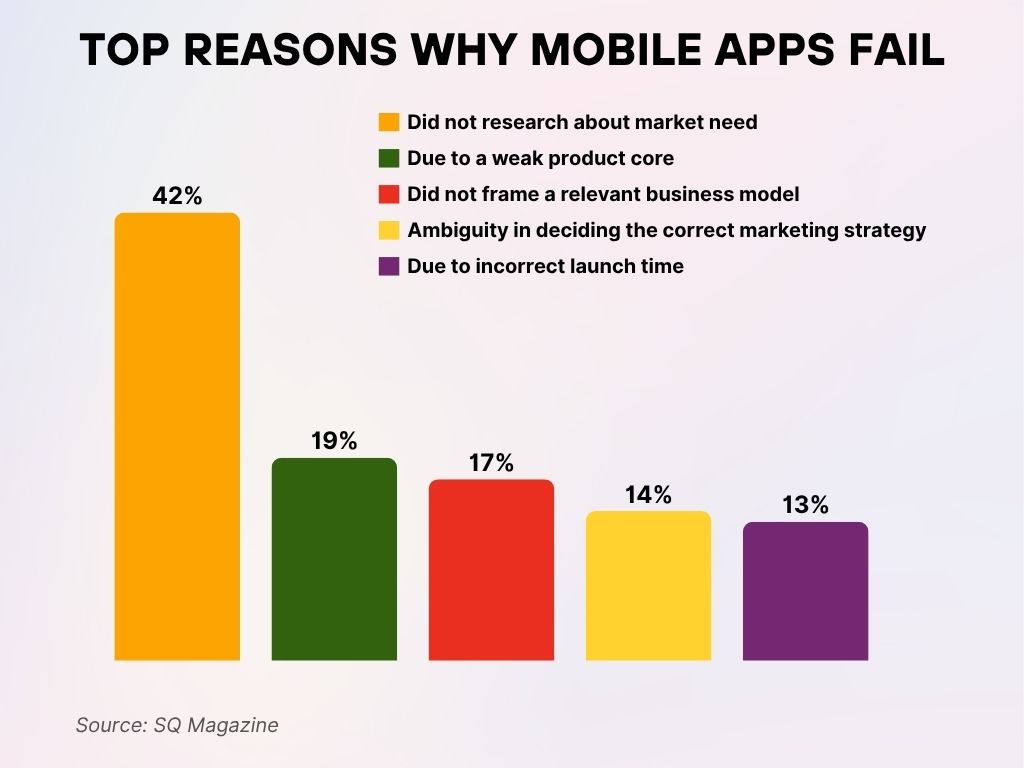
Top Reasons Why Mobile Apps Fail
- 42% of app failures happen because developers did not research the market need before building the app.
- 19% of apps fail due to a weak product core, showing the importance of a solid foundation.
- 17% of failures are caused by not framing a relevant business model, making monetization unsustainable.
- 14% of app projects struggle due to ambiguity in selecting the correct marketing strategy.
- 13% of failures are linked to incorrect launch timing, highlighting poor go-to-market planning.
Global Mobile App Usage Trends
- There are now 6.3 billion smartphone users globally in 2025, meaning over 78% of the world’s population has access to mobile apps.
- The average user spends 5.1 hours daily on mobile devices, with over 88% of that time inside apps.
- India, Brazil, and Indonesia have seen the highest YoY growth in mobile app usage, each exceeding 15% growth in 2025.
- Cross-platform app development frameworks now support over 60% of global app builds, driven by efficiency and reduced time-to-market.
- Entertainment and streaming apps account for 18% of total screen time globally.
- Mobile-first markets like Nigeria and the Philippines are experiencing a surge in fintech app adoption, with usage growing by over 20% YoY.
- On average, a new app is downloaded every 11 seconds globally.
- The top 10% of users generate over 70% of total app engagement metrics across industries.
- China leads the world in average apps used per person per day, at 13.2 apps, closely followed by South Korea at 12.5.
- Globally, 68% of app users prefer apps with dark mode enabled, showing a continued preference for customizable UI.
Most Downloaded Mobile Apps Worldwide
- TikTok, Instagram, and WhatsApp remain the top three most downloaded apps globally in 2025.
- CapCut and Temu have broken into the global top 10 list, thanks to strong marketing and viral content creation tools.
- Threads by Meta has grown quickly, reaching 450 million downloads in less than a year.
- The top downloaded category is social networking, accounting for 31% of downloads globally.
- Shopping apps like Amazon, SHEIN, and Flipkart collectively saw over 2 billion downloads in 2025.
- Duolingo continues to dominate the edtech app space with 180 million downloads, up 25% YoY.
- Zoom and Microsoft Teams downloads have declined by over 30% from their pandemic peaks, stabilizing as hybrid work norms shift.
- Newcomers like Lemon8 and Artifact gained significant traction, especially among Gen Z.
- Despite growing competition, YouTube’s mobile app remains in the top 5 for total downloads across both iOS and Android.
- 80% of the top 100 apps are available on both iOS and Android platforms.
Most Downloaded Mobile Apps Worldwide
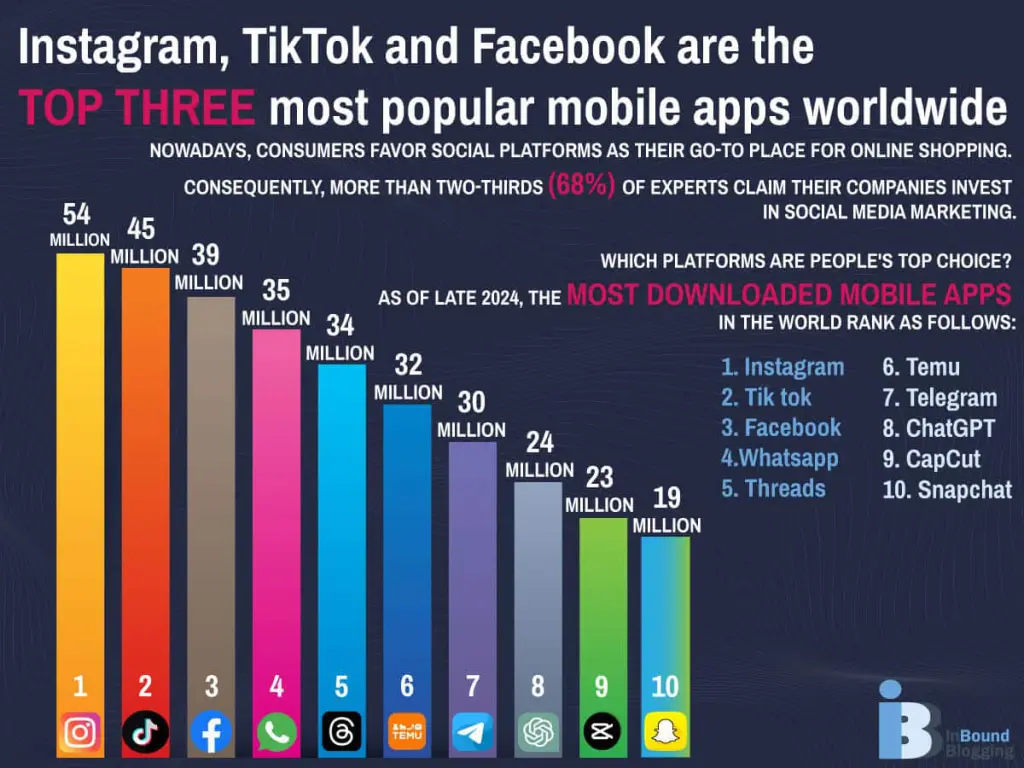
- Instagram ranks #1 with 54 million downloads, leading global mobile app popularity.
- TikTok follows with 45 million downloads, holding the #2 spot.
- Facebook comes in third with 39 million downloads, maintaining strong user acquisition.
- WhatsApp secures the #4 position with 35 million downloads.
- Threads, Meta’s newer app, ranks #5 with 34 million downloads.
- Temu is at #6 with 32 million downloads, showing growing e-commerce interest.
- Telegram ranks #7 with 30 million downloads, reflecting its secure messaging appeal.
- ChatGPT holds the #8 spot with 24 million downloads, signaling rising AI usage.
- CapCut ranks #9 with 23 million downloads, driven by content creation demand.
- Snapchat rounds out the top 10 with 19 million downloads.
Mobile App Revenue Statistics and Projections
- Total app revenue in 2025 is projected to reach $190 billion.
- iOS accounts for 65.8% of total global app revenue, reaffirming Apple’s high-spending user base.
- Google Play Store revenue is expected to surpass $60 billion in 2025.
- Mobile gaming apps are estimated to generate $98 billion in revenue this year alone.
- Subscription-based apps now make up 48% of all revenue-generating apps on the App Store.
- The average annual spending per user in the US has reached $140 on mobile apps.
- Freemium models remain the dominant revenue strategy, used by 92% of top-grossing apps.
- Health and fitness apps saw the highest revenue growth among non-gaming apps, rising by 31% YoY.
- In-app advertising revenue is projected to hit $65 billion, driven by personalization and programmatic bidding.
- Live streaming apps, particularly in Asia, are expected to cross $9 billion in user spending by 2025.
User Engagement and Retention Metrics
- The average app retention rate on Day 1 is now 24%, dropping to 5.8% by Day 30, signaling the importance of early user experience.
- Push notifications increase app engagement by 40% when personalized based on behavioral data.
- Apps with onboarding tutorials see 12% higher retention compared to those without.
- Gamified apps (fitness, education, language learning) boast retention rates 22% higher than standard formats.
- The average number of sessions per user per day has remained stable at 3.6 sessions, with peak hours between 7 p.m. and 10 p.m.
- Apps that integrate social sharing features experience 27% higher average session durations.
- User feedback integration leads to a 15% improvement in retention metrics over 6 months.
- Mobile apps with a rating above 4.5 stars retain twice as many users as those rated below 3.5.
- A/B testing adoption among top-performing apps increased by 32%, underscoring the importance of iterative UX improvements.
- Chat support functionality contributes to a 19% increase in weekly active user counts.
Top Reasons People Uninstall Mobile Apps
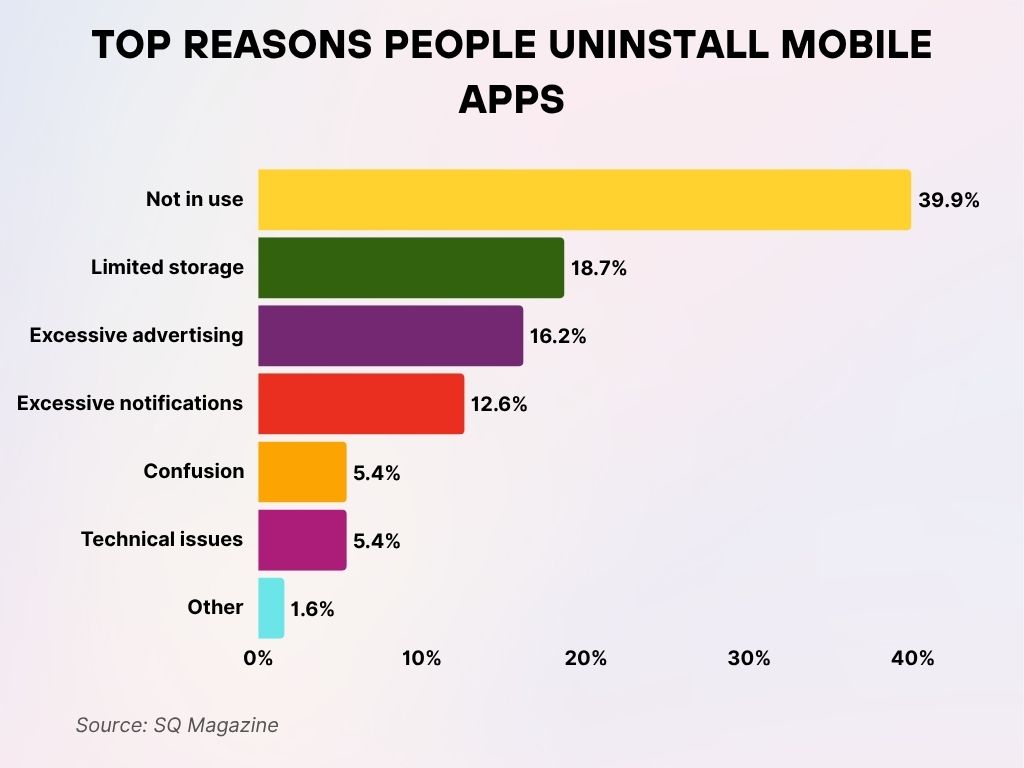
- The leading reason users uninstall apps is that they are not in use, accounting for 39.9% of uninstalls.
- 18.7% of users delete apps due to limited storage space on their devices.
- 16.2% uninstall apps because of excessive advertising, which disrupts the user experience.
- 12.6% of users cite excessive notifications as their reason for uninstalling.
- 5.4% of users uninstall apps due to confusion over the interface or functionality.
- Another 5.4% remove apps because of technical issues like crashes or bugs.
- Only 1.6% fall into the “Other” category, showing most uninstall reasons are app-related.
Regional Breakdown of Mobile App Usage
- The United States leads in per-user app spending at $140 annually, while Japan ranks second with $118.
- India continues to dominate in download volume, contributing over 35 billion installs in 2025.
- In Europe, Germany and France saw 8% YoY growth in time spent on mobile apps.
- Brazil and Mexico are now the top 10 markets for mobile gaming, with $4.6 billion in combined revenue.
- Sub-Saharan Africa has shown a 35% growth in mobile banking and fintech app adoption.
- China’s app ecosystem continues to operate independently, with 90% of top apps being China-exclusive platforms.
- Australia ranks highest in average daily app time in the APAC region, logging 4.9 hours/day.
- Indonesia and Vietnam are emerging as hotspots for short-form video apps, with usage surging 40% YoY.
- In MENA, utility and lifestyle apps have seen 19% YoY growth, led by the UAE and Saudi Arabia.
- Russian app stores show rising popularity of local alternatives due to sanctions, with domestic app use up 27% in 2025.
Mobile App Store Market Share: iOS vs Android
- Android holds 69.6% of the global OS market share, with iOS at 29.9%.
- Despite a smaller user base, iOS generates 2.5x more revenue per user than Android.
- Google Play hosts over 3.7 million apps, compared to 1.9 million on the iOS App Store.
- App rejection rates are twice as high on iOS, mainly due to stricter privacy and design compliance.
- Android One and Android Go devices account for 28% of Android app traffic in emerging markets.
- In the US, iOS leads with a 56% mobile OS market share, reflecting strong premium segment loyalty.
- App size limits differ: iOS apps can be up to 4 GB, while Play Store apps support split APKs exceeding 150 MB for base packages.
- Apple’s App Tracking Transparency (ATT) feature, introduced in 2021, still affects 38% of iOS apps, leading many to adapt ad monetization models.
- Play Store downloads make up nearly 80% of all global app installs, due to Android’s presence in high-population countries.
- Cross-platform tools like Flutter and React Native dominate both stores, with over 60% of newly published apps using one.
Top Apps 18–34-Year-Olds Say They Can’t Live Without
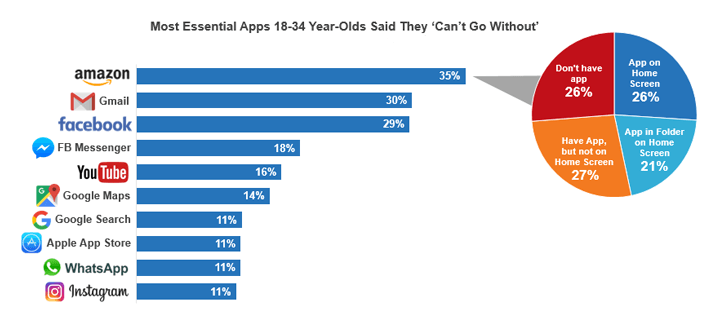
- 35% of young adults say they can’t go without Amazon, making it the most essential app.
- 30% of users list Gmail as a must-have app in their daily lives.
- 29% rely heavily on Facebook, placing it just behind Gmail in essential use.
- 18% say Facebook Messenger is indispensable for communication.
- 16% of users rate YouTube as essential for entertainment and information.
- 14% can’t do without Google Maps for navigation needs.
- 11% each claim Google Search, Apple App Store, WhatsApp, and Instagram as essential.
App Placement Habits
- 27% have the app installed but not on their home screen.
- 26% don’t have the app at all.
- 26% keep the app on the home screen.
- 21% store the app in a folder on the home screen.
Industry-Specific App Statistics (Gaming, Finance, Health, etc.)
- Mobile games make up 52% of global app revenue, reaching $98 billion in 2025.
- Finance apps see over 34% YoY growth in user sessions, driven by digital banking and crypto trading.
- Health and wellness apps crossed $14 billion in revenue.
- Edtech apps like Duolingo and BYJU’S show a 25% growth in active user bases.
- Food delivery apps (DoorDash, Uber Eats, Grubhub) account for $16 billion in consumer spending in the US alone.
- Retail and e-commerce apps see 46% of all purchases made through mobile apps, surpassing desktop for the first time.
- Telehealth app usage has stabilized, now used by 28% of US adults monthly, a post-pandemic retention trend.
- Streaming apps like Netflix and Disney+ command 17% of app session time across global users.
- AI-enhanced apps, especially in fitness and writing, are growing fast, over 18% of health apps now use some form of machine learning.
- B2B SaaS mobile apps (e.g., Slack, Asana, Salesforce) are adopted by 74% of remote-first companies.
Average Time Spent on Mobile Apps per Day
- The global average time spent on mobile apps is 5.1 hours/day.
- In the US, users spend an average of 5.7 hours/day on mobile.
- Social media takes the largest share of this time at 32%, followed by entertainment and messaging.
- Gen Z users average 6.8 hours/day in mobile app usage, the highest of any demographic group.
- Adults aged 55+ have increased their app usage by 12%, driven by health, finance, and news apps.
- Short-form video apps (e.g., TikTok, YouTube Shorts) account for 1.4 hours/day on average for heavy users.
- Productivity apps see peak usage during work hours, particularly from 10 a.m. to 1 p.m.
- Gaming apps average 1.1 hours/day per user, with the most engaged segment being casual mobile gamers aged 25–34.
- In urban US regions, public transit users contribute to 24% of daily mobile app traffic, driven by navigation, news, and video streaming.
- App fatigue is real, 22% of users report feeling overwhelmed by the number of apps on their device and are seeking more integrated tools.
Retail App Usage Habits Among US Smartphone Users
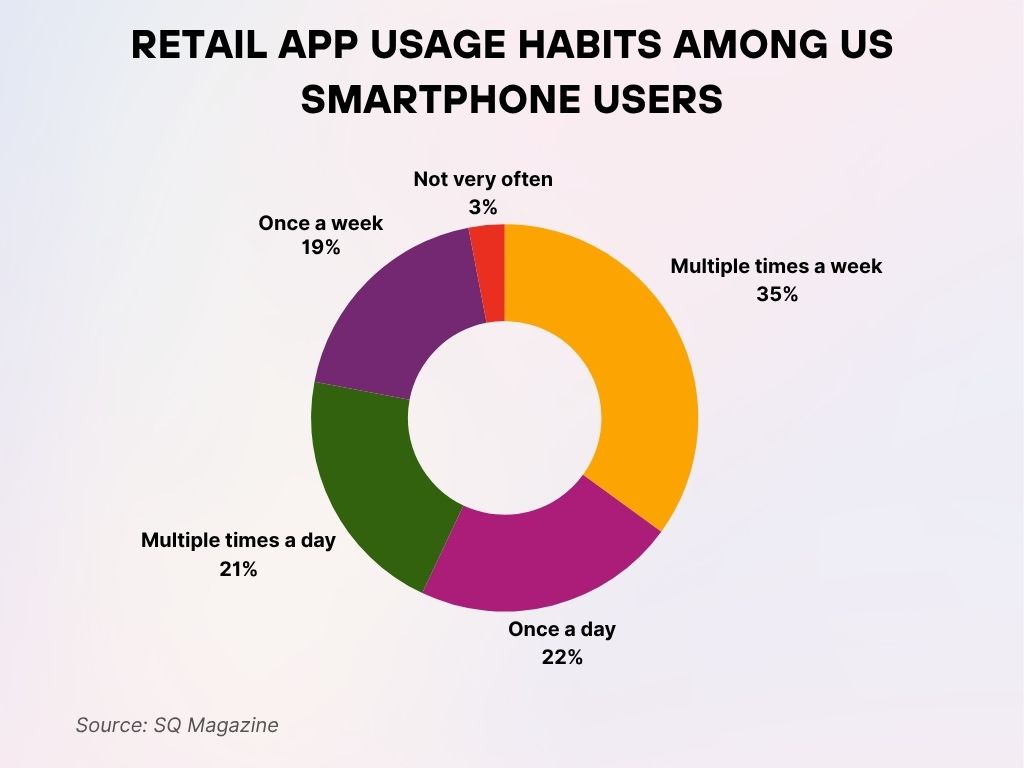
- 35% of US smartphone users open retail apps multiple times a week, making this the most common usage frequency.
- 22% use retail apps once a day, showing strong daily engagement with shopping platforms.
- 21% access these apps multiple times a day, indicating high-frequency shoppers.
- 19% open retail apps once a week, reflecting moderate usage.
- Only 3% of users report using retail apps “not very often,” suggesting low disengagement overall.
Mobile App Advertising and Monetization
- In-app advertising revenue is projected to hit $65 billion in 2025.
- Rewarded video ads show the highest engagement, with a 91% completion rate and 43% higher click-through than static banners.
- Interstitial ads remain common in gaming apps, making up 33% of mobile ad formats in use today.
- Cost Per Install (CPI) averages at $1.80 globally, with iOS CPIs at $2.52 and Android at $1.29.
- Apps using subscription models have a 4.6x higher ARPU (average revenue per user) compared to ad-only monetized apps.
- eCPM rates vary by region: US ($11.80), UK ($9.20), Southeast Asia ($3.40).
- Hybrid monetization strategies (ads + IAP + subscriptions) are used by over 60% of top-grossing apps.
- App install campaigns on social platforms now account for 48% of total mobile marketing spend.
- Programmatic ad spending in mobile apps grew 22% YoY, with more brands prioritizing real-time bidding.
- Privacy regulations continue to impact ad tracking, 41% of apps on iOS now offer ATT-compliant ad flows.
Enterprise and Business App Usage
- Over 83% of US enterprises now deploy mobile apps for internal operations.
- B2B mobile apps see an average session duration of 6.2 minutes, significantly higher than B2C apps.
- Apps supporting workflow automation (like Monday.com, ClickUp) are used by 66% of remote-first businesses.
- Mobile CRM app usage (Salesforce, Zoho) grew 18% YoY, driven by mobile salesforce enablement.
- BYOD (Bring Your Own Device) policies are supported by 72% of companies using mobile enterprise apps.
- Mobile VPN and cybersecurity apps saw a 32% increase in enterprise downloads amid rising remote work.
- Businesses report 19% higher productivity after integrating mobile-first communication platforms.
- Cross-device compatibility remains a top priority for IT leaders, with 62% requiring seamless sync across web and mobile.
- Apps with SSO (Single Sign-On) features are 3x more likely to be adopted in regulated industries.
- Analytics dashboards are the most requested mobile feature among C-suite users in internal apps.
Push Notification Preferences by Age Group
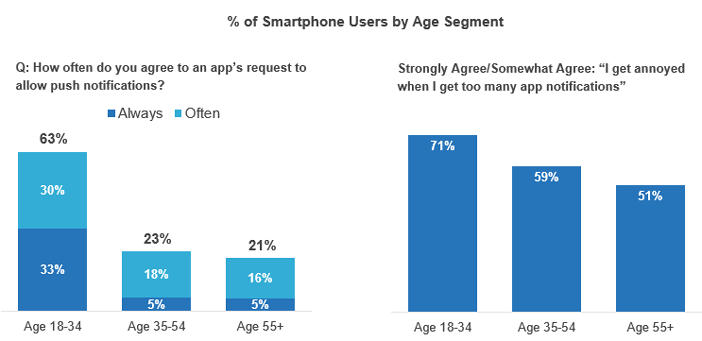
- 63% of users aged 18–34 agree to app push notifications either always (33%) or often (30%).
- Only 23% of users aged 35–54 allow notifications frequently (5% always, 18% often).
- Among those aged 55+, 21% often or always agree to push notifications (5% always, 16% often).
Notification Fatigue Across Age Groups
- 71% of users aged 18–34 say they get annoyed by too many app notifications.
- 59% of users in the 35–54 age group feel the same.
- 51% of users aged 55+ also report irritation from excessive notifications.
Most Popular App Categories
- Social and Communication apps lead in time spent, accounting for 32% of mobile usage.
- Gaming remains the most downloaded category, with over 93 billion installs globally.
- Health & Fitness apps saw a 21% increase in downloads, bolstered by AI-based personal coaching.
- Finance apps hold the highest retention rates at 32% on Day 7, indicating high utility.
- Shopping and e-commerce apps now account for 23% of user sessions in the US.
- Photo and video editing apps like CapCut and Adobe Express show a 17% YoY growth among Gen Z.
- Educational apps continue to rise post-pandemic, with 7 out of 10 students using at least one learning app weekly.
- Travel apps rebounded in 2025, reaching 85% of pre-pandemic usage levels, driven by revenge travel trends.
- Utilities (battery savers, storage optimizers) saw declining installs but retain niche relevance in emerging markets.
- Spirituality and wellness apps (meditation, astrology) show 15% YoY growth, mostly in North America and Europe.
Impact of AI and Emerging Tech on Mobile Apps
- Over 28% of all new apps launched in 2025 feature AI-based functionality.
- Generative AI tools are integrated into note-taking, fitness, and writing apps, enhancing personalization.
- AI-powered chatbots are now present in 41% of customer service apps, improving resolution times by 22%.
- Predictive analytics is widely used in finance and retail apps, with a 31% increase in retention observed.
- AR features are used in 10% of e-commerce apps, especially for try-before-you-buy experiences.
- Voice search optimization is included in 18% of newly published apps, primarily in productivity and lifestyle categories.
- Edge computing in mobile apps is reducing latency, now adopted by 12% of real-time gaming and streaming apps.
- Blockchain integration appears in 7% of finance-related apps, mainly for wallet and authentication functions.
- Neural input control, such as eye tracking and gestures, is being piloted in accessibility-focused apps.
- The rise of AI agents and copilots across productivity suites is reshaping how users interact with mobile UIs.
Recent Developments
- Apple Vision Pro SDK sparked interest in spatial app development, with 1,500+ compatible apps already in the ecosystem.
- Google Play’s new ad transparency policy mandates detailed disclosure on data usage for advertisers, live since Q1 2025.
- Meta launched a cross-platform super app combining messaging, social networking, and e-commerce into a single interface.
- OpenAI’s ChatGPT app integration APIs have led to a wave of GPT-powered microtools across industries.
- Samsung announced app cloning support at the OS level, enabling multi-instance app use without third-party tools.
- Apple introduced dynamic widgets in iOS 18, allowing real-time app interaction from the home screen.
- Startups focusing on AI-first mobile tools raised over $8 billion in funding globally in the first half of 2025.
- China’s Huawei AppGallery has surpassed 850 million global monthly active users, driven by regional loyalty.
- Developers are rapidly adopting passkey authentication, replacing traditional passwords in over 40% of new app signups.
- Low-code/no-code platforms now support mobile app development for non-technical teams, seeing a 42% usage growth.
Conclusion
The mobile app ecosystem in 2025 is a fusion of AI-driven personalization, cross-platform versatility, and consumer-first design. While revenue and user base continue to climb, success now hinges on delivering real, sustainable value through smarter tech and better experiences.
Developers, marketers, and businesses must adapt to a rapidly evolving environment where user engagement, privacy, and utility outweigh novelty. With new innovations surfacing at a record pace, the next era of mobile apps will likely be defined not by how many we use, but how meaningfully we use them.


