Microsoft remains one of the world’s most influential technology companies, and today, its workforce size offers a useful lens into its shifting priorities. From cloud and AI divisions to gaming and services, Microsoft’s employee base reflects evolving strategic focus. In sectors such as cloud infrastructure and consumer hardware, staffing shifts at Microsoft ripple across adjacent industries. Keep reading to explore how its headcount evolved, where growth is happening, and what that means going forward.
How Many People Work At Microsoft?
- 228,000, Microsoft’s global employee count in 2025 (unchanged from 2024).
- 3.17% growth, Employee growth from 2023 to 2024, when Microsoft went from 221,000 to 228,000.
- ~4% layoffs: In 2025, Microsoft announced cuts affecting about 9,000 jobs (~4% of workforce).
- 31.6%: Share of women in Microsoft’s core workforce as of the latest D&I report.
- 27.2%: Share of women in technical roles.
- 53.9%: Share of racial or ethnic people in Microsoft’s broader workforce.
Recent Developments
- In mid-2025, Microsoft announced workforce reductions totaling about 9,000 positions across departments as part of cost and structural adjustments.
- Earlier that same year, ~6,000 positions (≈3% of the workforce) were laid off.
- Microsoft signaled a move toward learner management layers, reducing middle‑manager roles to accelerate agility.
- The firm has doubled down on AI and cloud infrastructure investments, expecting automation and AI tools to capture more scale with fewer direct human roles.
- Its 2025 Work Trend Index introduces the concept of the “Frontier Firm”, hybrid human‑agent teams combining human roles with AI assistance.
- Microsoft continues to publish its global Diversity & Inclusion data publicly, reflecting ongoing emphasis on transparency.
- Amid layoffs, certain segments like hardware (Surface) and gaming reportedly saw sharper cuts.
Top Job Locations at Microsoft
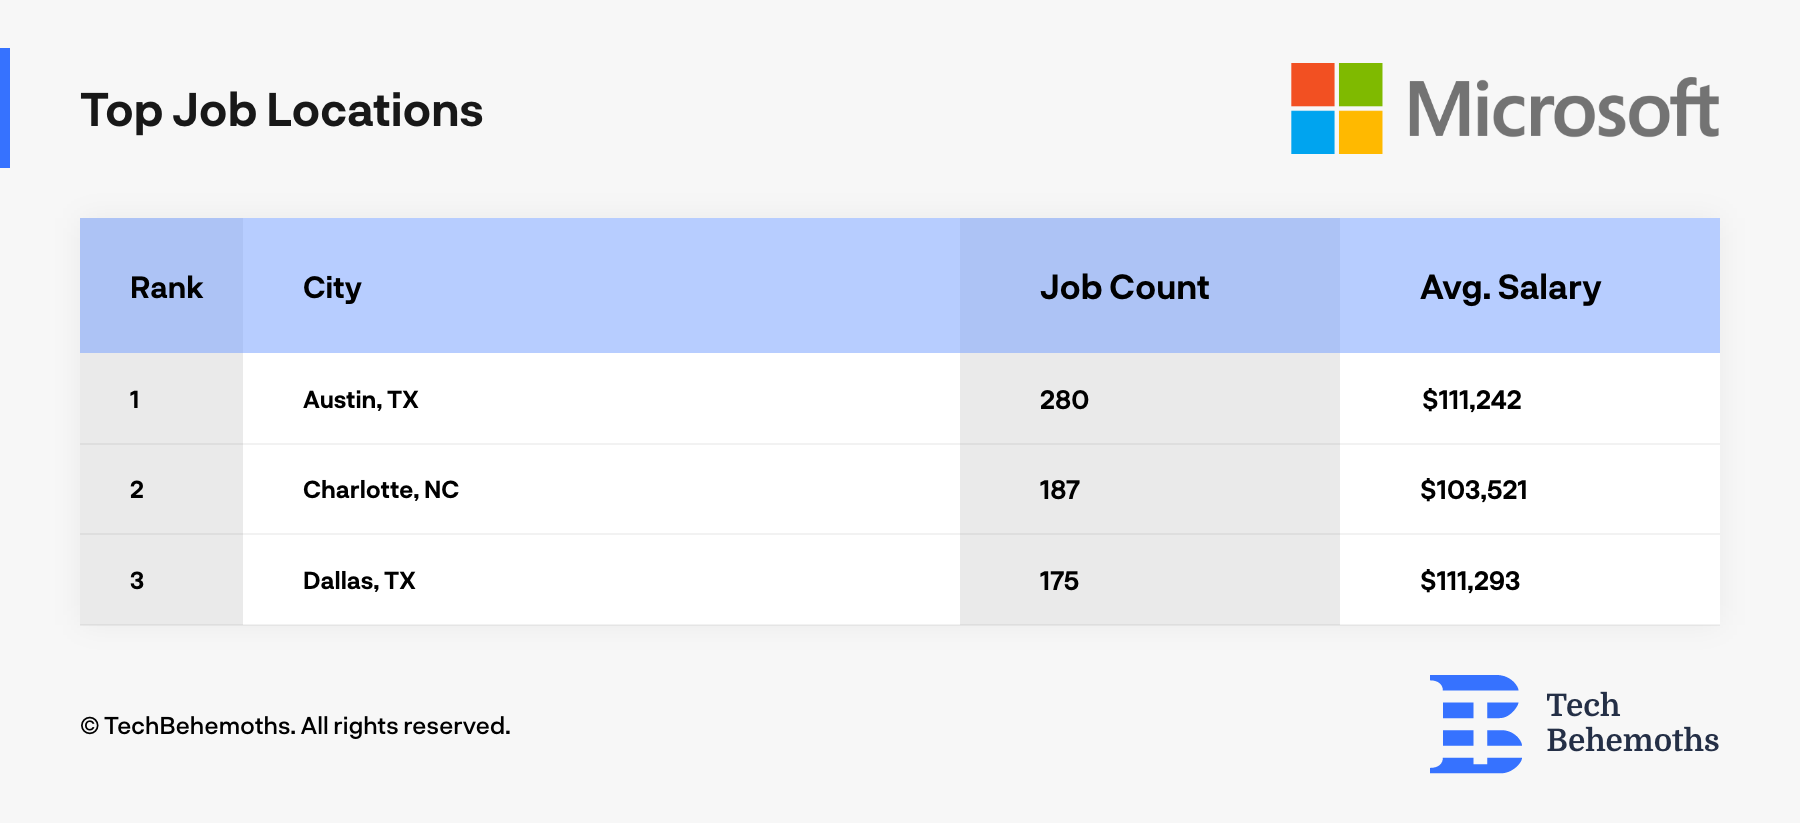
- Austin, TX, holds the highest number of Microsoft jobs (280), offering an average salary of $111,242, highlighting its strong tech workforce and growing hub status.
- Charlotte, NC, ranks second with 187 roles, featuring an average pay of $103,521, reflecting the city’s rise as a regional tech operations center.
- Dallas, TX, comes third with 175 positions, boasting the highest average salary at $111,293, showing the premium attached to tech expertise in Texas.
Microsoft’s Current Team (Key People)
- Satya Nadella has served as Microsoft’s CEO since 2014, credited with transforming the company through cloud-first, AI-focused strategies.
- Brad Smith, Vice Chair and President, oversees Microsoft’s legal, public affairs, and responsible AI efforts, playing a key role in global policy and ethics.
- Amy Hood continues as Chief Financial Officer (CFO), guiding Microsoft’s long-term financial planning and strategic investments.
- Scott Guthrie, Executive Vice President of Cloud + AI, leads Microsoft Azure and its enterprise AI integration roadmap.
- Kevin Scott, Chief Technology Officer (CTO), steers Microsoft’s technology vision, particularly in AI, quantum, and innovation frameworks.
- Jared Spataro heads Microsoft’s Modern Work division, focusing on productivity tools, Teams, and hybrid work solutions.
- Rajesh Jha, EVP of Experiences and Devices, manages the development of Office, Windows, and Surface.
- Phil Spencer, CEO of Microsoft Gaming, leads Xbox and related gaming properties, including Activision Blizzard, following the 2023 acquisition.
- Charlie Bell, EVP of Security, manages Microsoft’s security products and strategies across cloud and enterprise platforms.
- Kathleen Hogan, Chief Human Resources Officer, leads Microsoft’s global HR strategy, including talent development, culture, and inclusion.
- Christopher Young, EVP of Business Development, is instrumental in strategic partnerships and acquisitions, including AI integrations.
Latest Headcount Figures
- 228,000: Microsoft’s total global employees in 2025, matching 2024 figures.
- In 2024, Microsoft also recorded 228,000, up from 221,000 in 2023.
- No change from 2022 to 2023, with Microsoft holding 221,000 employees in both years.
- From 2021 to 2022, Microsoft expanded from 181,000 to 221,000 employees, a jump of ~22.1%.
- In 2020, Microsoft had 163,000 employees.
- Comparing output per employee in 2025, Microsoft’s revenue per employee is estimated at ~ $1.24 million.
- The stagnation in headcount from 2024 to 2025 suggests that hiring broadly offset the losses from layoffs.
- Analysts estimate that the net workforce as of late 2025 could lie in the 220,000–230,000 range.
Most Spoken Languages at Microsoft
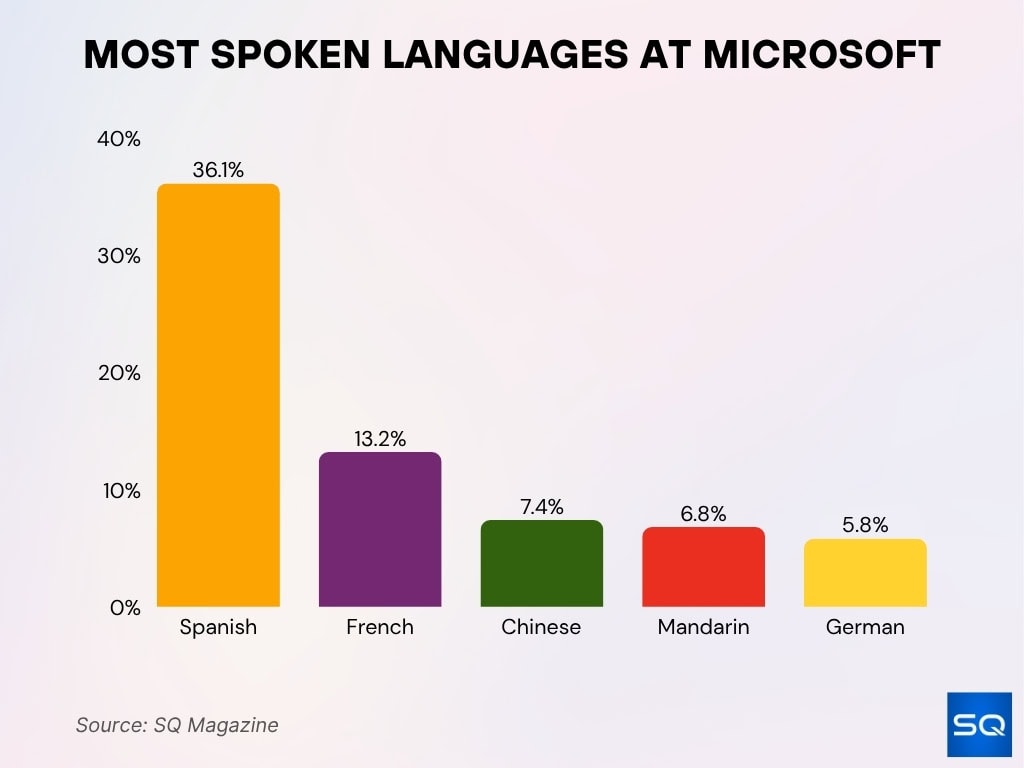
- Spanish is the most common language among Microsoft employees, representing 36.1% of total speakers.
- French ranks second at 13.2%, reflecting Microsoft’s strong presence across Europe and Africa.
- Chinese accounts for 7.4%, driven by the company’s large operations and partnerships in Asia.
- Mandarin follows closely with 6.8%, underscoring Microsoft’s deep R&D engagement in China and other Mandarin-speaking regions.
- German makes up 5.8%, highlighting the company’s Central European influence and local workforce diversity.
Historical Employee Growth
- 2010: ~ 89,000 employees.
- 2015: ~ 118,000 employees.
- 2018: ~ 131,000 employees.
- 2021: ~ 181,000 employees.
- 2022: ~ 221,000 employees.
- 2023: ~ 221,000 employees (flat).
- 2024: ~ 228,000 employees (growth).
- 2025: ~ 228,000 (flat).
- Over the decade from 2015 to 2025, Microsoft nearly doubled its workforce scale.
Workforce Growth Trends
- The biggest growth spike occurred in 2022, when Microsoft jumped ~22.1% in a single year.
- From 2023 to 2024, growth moderated to ~3.17%.
- But from 2024 to 2025, growth flattened entirely (0%).
- This flattening aligns with Microsoft’s recent layoffs aimed at rebalancing cost structures.
- Growth strategy is shifting, from pure headcount scale to efficiency + AI augmentation.
- Headcount growth is now concentrated in cloud, AI, and productivity software teams rather than legacy divisions.
- Microsoft’s introduction of human‑AI hybrid models (Frontier Firms) signals fewer pure headcount roles to come.
- Growth volatility is likely to increase as macro pressures and technology disruptions accelerate structural rework.
Employee Distribution by Department
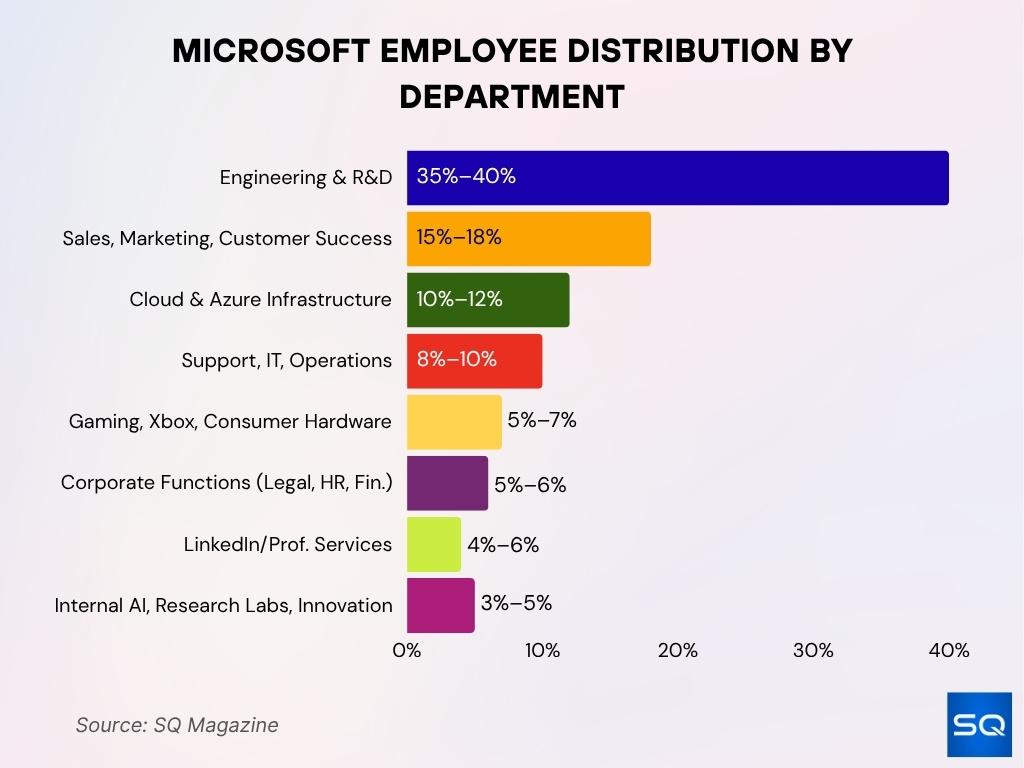
- Microsoft’s Engineering & R&D divisions represent roughly 35–40% of total headcount as of 2025 (industry estimates).
- Sales, Marketing & Customer Success make up about 15–18% of employees globally.
- Cloud & Azure infrastructure teams typically account for 10–12% of total staffing.
- Support, IT & Operations functions represent 8–10% of the workforce.
- Gaming, Xbox, and Consumer Hardware divisions employ 5–7% of employees.
- Corporate functions (Legal, HR, Finance, PR) occupy around 5–6%.
- Microsoft’s LinkedIn / Professional Services units host 4–6% of the staff.
- Internal AI, Research Labs & Innovation groups (e.g., Microsoft Research) make up 3–5%, often drawing from core engineering headcount.
Workforce Compared to Other Tech Companies
- Microsoft’s ~ 228,000 employees in 2025 exceed Apple’s ~ 154,000 and Alphabet’s ~ 190,000.
- Amazon, by contrast, employs over 1.5 million globally, far beyond Microsoft’s scale.
- Meta (Facebook & family) employs ~ 95,000–110,000 in the 2025 range.
- Tesla’s workforce (~ 130,000) is also smaller despite a high-profile ranking.
- In headcount, Microsoft ranks among the top 3 U.S. tech firms (by people) outside Amazon.
- Many tech peers use subcontractors, contractors, and Microsoft’s internal FTE ratio is higher.
- Microsoft’s staffing density (employees per $B revenue) is lower than legacy software firms, reflecting automation and capital intensity.
Diversity and Inclusion Statistics
- 31.6% of Microsoft’s core workforce are women.
- 27.2% of technical roles are held by women.
- 6.6% U.S. Black/African American representation in core workforce.
- 8.0% U.S. Hispanic/Latinx representation, increasing year over year.
- 9.0% of U.S. employees self-identified as having a disability.
- 81.2% of Microsoft employees agree or strongly agree that the company is diverse and inclusive.
- 83.5% report witnessing allyship actions (inclusion practices) in the workplace.
- The U.S. data center employee population grew 23.9% year over year, the most rapidly expanding group.
Salary and Compensation Ranges
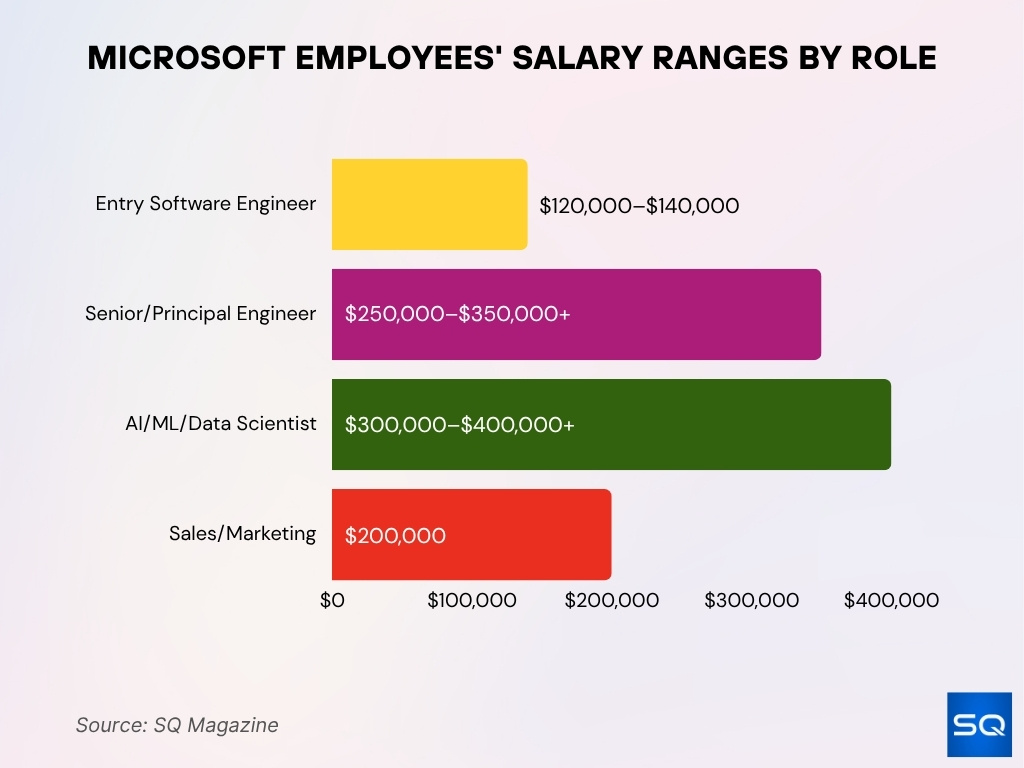
- Entry-level software engineers may see base salaries in the $120,000–$140,000 range.
- Senior or principal engineers can command $250,000–$350,000+ in total compensation.
- AI/ML specialists and data scientists may exceed $300,000–$400,000+ in top roles.
- Variable compensation in Sales/marketing can drive annual earnings beyond $200,000, but with notable job volatility year to year.
- Executive, leadership, and director tiers often receive 7‑figure total packages when equity is included.
- Microsoft’s pay equity rate across gender and race reportedly stands near 99.8%.
- Compensation in lower-cost geographies is significantly lower but offset by local market adjustments.
- Benefits and stock grants (RSUs) form a substantial share of many employees’ total compensation package.
Hiring and Recruitment Trends
- Over 3,500 new AI-focused roles were posted by Microsoft in Q2 2025, representing a 40% increase year-over-year.
- 62% of Microsoft’s global tech hires in 2025 are for AI, machine learning, and data science positions.
- Management-layer hiring dropped by 28% in 2025 compared to 2024, coinciding with company-wide restructuring initiatives.
- Despite restructuring, Microsoft listed over 8,000 open jobs globally as of October 2025, with the largest share in cloud infrastructure and cybersecurity.
- Internal job transfers among Microsoft employees increased by 19%, highlighting a stronger focus on internal mobility.
- India and Southeast Asia accounted for 36% of new hires in 2025, up from 22% two years prior, driven by efficiency and cost goals.
- 68% of AI and data roles filled at Microsoft in 2025 were sourced from university recruiting and research labs.
- Recruiting priority for AI engineers and ML ops roles rose by 32% in 2025, making them Microsoft’s top hiring targets.
- Standard software engineering roles now comprise only 24% of new tech hires, down from 43% in 2023 due to AI augmentation.
- Microsoft’s average time-to-hire for critical AI roles was reduced to 22 days, compared to the previous average of 35 days.
Remote and Hybrid Work Statistics
- Microsoft’s policy currently allows employees to work remotely up to half the time without approval.
- Reports suggest a potential policy shift requiring 3 days per week in the office in 2026.
- Approximately 74% of Microsoft’s workforce reportedly operates under hybrid or remote arrangements.
- Some teams may require 4 or 5 in-office days, depending on function and proximity to headquarters.
- Return‑to‑office (RTO) changes may drive attrition, as some employees leave rather than comply.
- Remote work is more common in software, cloud, and AI divisions, less so in hardware, datacenter, and field roles.
- Microsoft’s hybrid stance aligns with trends at Google and Meta (3 days/week in office norms).
- Flexible work is a key recruiting incentive amid tight tech labor markets.
Recent Layoffs and Organizational Changes
- In May 2025, Microsoft laid off over 6,000 employees (~3% of the workforce).
- In July 2025, an additional ~9,000 jobs (~4%) were cut.
- The combined total is often cited as ~15,000 or more jobs eliminated in 2025.
- Cuts focused on management layers, non-core product lines, and roles redundant under AI tools.
- Xbox, sales, marketing, and global field roles reportedly incurred higher impacts.
- ~830 positions at Redmond headquarters were affected in that round.
- Organizational streams are being realigned toward fewer layers, increased span per leader, and enhanced speed.
- Some news reports suggest cuts of up to 7,000 jobs (3%) planned earlier as part of AI rebalancing.
Employee Tenure and Average Length of Employment
- Microsoft’s average employee tenure is reported at 6.8 years (2025 estimate).
- In earlier years, the typical tenure hovered between 5–7 years.
- Senior technical and research staff often exceed 10+ years of average tenure.
- Mid‑career hires (5–10 years of experience) tend to stay ~4–6 years on average.
- High turnover is seen in sales, marketing, and field roles relative to core technical divisions.
- Layoff waves in 2025 will likely lower average tenure metrics temporarily.
- Tenure metrics are important indicators of institutional memory and retention health.
- Microsoft’s internal promotion and mobility programs aim to boost retention across tenures.
Employee Benefits
- Health, dental, and vision insurance is available to 100% of full-time Microsoft employees with competitive plan options.
- 401(k) employer match is 50% of employee contributions, up to a maximum of $11,750 per year in 2025.
- Parental leave for birth mothers is up to 20 weeks paid, while non-birth parents receive 12 weeks paid leave.
- Stock grants (RSUs) typically vest over 4 years, aligning incentives for long-term company growth.
- Annual education and training budgets average $2,500 per employee for job-related upskilling.
- Unlimited vacation or time-off policies are available to most U.S.-based full-time employees.
- Wellness programs, on-campus clinics, and free mental health resources are widely used by over 85% of employees.
- Flexible work options, remote work allowances, and commuter benefits are offered to all full-time staff.
- Employee Resource Groups (ERGs) number over 40, supporting communities like GLEAM, women, disability, and veterans.
- Charitable giving matches up to $15,000 annually per employee, with an additional $25/hr volunteer match benefits.
Comparison by Job Category (Engineering, Sales, Operations, etc.)
- Engineering/R&D is the largest category with 104,000+ employees, accounting for just over 40% of Microsoft’s total headcount in 2025.
- Engineering roles command the highest median base salary, with ranges for senior engineers exceeding $240,000–$285,000.
- AI/Data Engineering teams are a subset of R&D, showing compensation packages up to $264,000–$274,500 median for 2025 hires.
- Sales & Support comprises 12% the workforce and reports the highest turnover rate, particularly among field sales roles.
- Operations and IT have 10,000+ employees each, with base pay below tech averages but high role stability.
- Research Labs and specialty AI units have small teams, high compensation, and tenure exceeding 6 years on average.
- Hardware & device divisions are regionally smaller, face more than double the average attrition versus software-focused teams.
- Corporate functions (HR, Finance, Legal) comprise 8–12% of staff, stable and mid-range in pay but strong on benefits.
- Customer Success & Support are globally dispersed, with large junior cohorts, the highest seasonal hiring, and turnover at 15%+.
Engineering and R&D Teams
- Microsoft Research is one of the largest industrial research groups, with over 1,000 staff and $10–14 billion in annual R&D spend.
- Product R&D roles reached 81,000 in June 2025, up 12.5% from last year, reflecting priority investment in AI and foundational tech.
- MSR researchers filed 20% of global AI patents between 2010–2018, the largest share of any tech firm.
- AI/ML, natural language, vision, and RL teams accounted for more than 22% of new R&D headcount in the past 18 months.
- 10–15% of all technical staff work in R&D teams across Microsoft’s engineering divisions.
- Over 40% of Microsoft R&D staff have published peer‑reviewed papers or collaborate with academic partners yearly.
- Job security in R&D roles exceeds other technical divisions, with average tenure surpassing 6 years.
- AI augmentation tools and agents are now embedded in over 35% of engineering team workflows throughout Microsoft.
- R&D teams were shielded from workforce cuts, with less than 2% affected in recent company-wide layoffs.
- Cross‑disciplinary projects grew 13% year‑over‑year, expanding into quantum, systems, and foundational AI domains.
Frequently Asked Questions (FAQs)
Microsoft had 228,000 employees worldwide in 2025 (no change from 2024).
Microsoft laid off roughly 4% of its workforce in 2025, about 9,000 jobs.
Microsoft’s revenue per employee is estimated at around $1,235,632.
Experts estimate the 2025 workforce lies between 220,000 and 230,000 employees.
Conclusion
Microsoft’s workforce reflects a company in transformation, stable headcount overall, but heavy internal rebalancing toward AI, cloud, and efficiency. The distribution of employees leans heavily toward engineering, with diversity, inclusion, and hybrid work all becoming central to employee experience and recruiting. While compensation and benefits remain competitive, the shift to hybrid/remote policies, stringent return‑to‑office norms, and flattening hierarchies signal a fresh chapter for Microsoft’s talent strategy.


