Apple’s grip on customer loyalty remains one of its most valuable competitive advantages. In 2025, signs point to sustained emotional connection, ecosystem lock-in, and high repurchase intent among users. Whether in smartphones, wearables, or services, Apple’s retention performance directly influences its revenue stability and market strength. In sectors such as financial services (e.g., Apple Pay adoption) and digital subscriptions (Apple Music, iCloud), loyalty drives cross-sell and recurring revenue. Below, you’ll find a data-rich look at how Apple maintains that bond, and what’s shifting.
Editor’s Choice
- Apple’s iPhone customer retention rate hovers near 92%, well above most rivals.
- In 2025, Apple’s Net Promoter Score (NPS) is estimated at 61, surpassing tech industry averages.
- Apple’s loyalty rate among smartphone users remains around 89%, despite slight declines.
- Over 2.2 billion active Apple devices are in use globally by 2024.
- The App Store facilitated nearly $1.3 trillion in billings and sales globally in 2024.
- Apple maintains over 90% customer retention consistently among its core user base.
- Roughly 79% of iOS users stay within the Apple ecosystem (i.e., do not switch to Android).
Recent Developments
- Apple has been forced by the EU’s Digital Markets Act to open up App Store policies, which could ease platform switching.
- Despite those pressures, reports show Apple still dominates smartphone loyalty, with an 89% loyalty rate in 2025.
- Some reports suggest a modest drop in loyalty compared to peak levels, though the decline is marginal.
- Apple’s services segment reached a record, with $85.8 billion in revenue in Q3 2024.
- Apple continues to expand its ecosystem, device count, services, and third-party integrations increase year over year.
- The App Store’s economic activity more than doubled in five years, indicating deeper engagement across digital platforms.
- In 2024, the App Store had over 813 million weekly visitors worldwide.
Customer Retention Rate
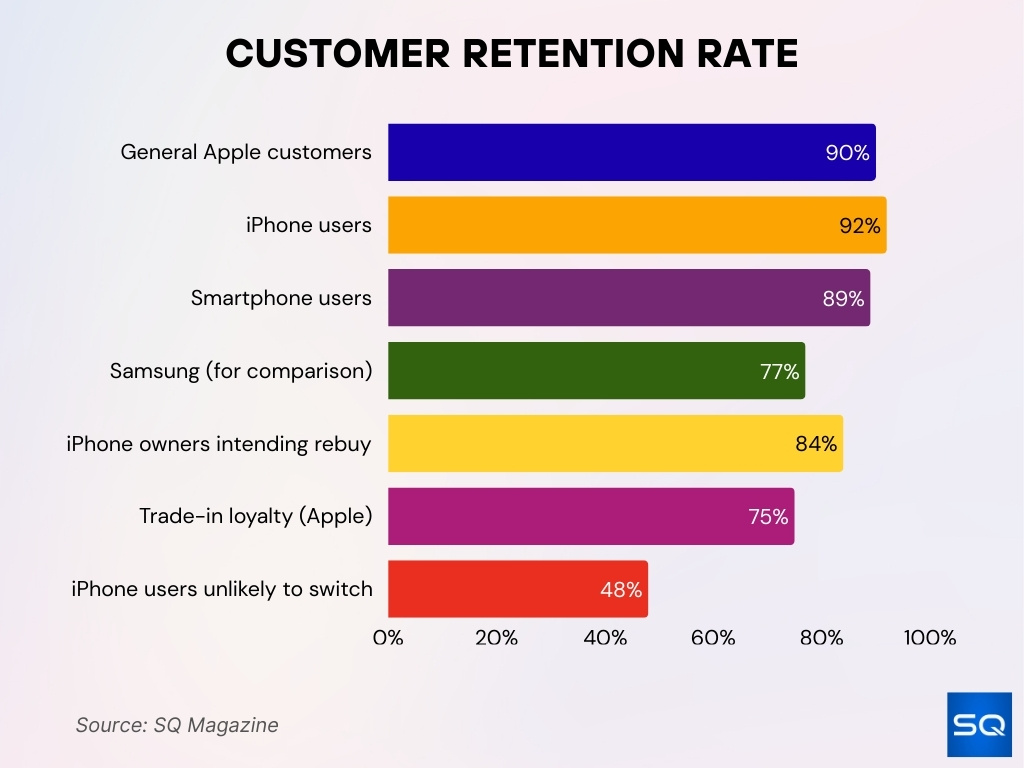
- Apple has maintained a customer retention rate of over 90% for several years.
- Specifically, among iPhone users, retention is often reported at 92%.
- In 2025, loyalty (retention) for smartphone users is estimated at 89%, a slight dip but still dominant.
- Apple’s retention rate outpaces its biggest rival, Samsung (around 77%).
- Surveys show 84% of iPhone owners intend to buy another Apple device next time.
- Brand trade-in loyalty is also high, 74.6% trade-in users stay within Apple.
- Almost 48% of iPhone users say they are unlikely to switch brands.
Apple Ecosystem and Device Integration
- By 2024, Apple had over 2.2 billion active devices globally.
- The App Store generated $1.3 trillion in billings and sales worldwide in 2024.
- Digital goods and services in the App Store grew 109% over five years, and physical goods and services grew 162%.
- In 2024, weekly App Store visitation exceeded 813 million users.
- Apple doesn’t collect a commission on over 90% of App Store ecosystem sales.
- The App Store’s growth from 2019 to 2024 was over 152% worldwide.
- Core integration, iCloud syncing, Universal Clipboard, Handoff, ties data and workflows across iPhone, iPad, Mac, and Watch.
- Apple’s “walled garden” approach makes third-party replacement harder, reinforcing the ecosystem.
Emotional Connection and Brand Advocacy
- Around 73% of iPhone users describe themselves as “highly or somewhat loyal” to Apple.
- Among Millennial iPhone owners, 96.4% plan to repurchase with Apple.
- Emotionally invested customers tend to refer brands at 71%, versus average users at 45%.
- Apple’s branding emphasizes identity to forge a personal connection.
- Many users say switching brands would feel like losing a part of their workflow or “digital self.”
- In surveys, more than half of Apple users say part of their loyalty stems from pride in using Apple products.
- Repeat buyers sometimes cite community or ownership identity, Apple users as part of a “creative class.”
- Emotional brand ties help buffer negative incidents; some users forgive Apple glitches more readily than they would for other brands.
Net Promoter Score (NPS) Statistics
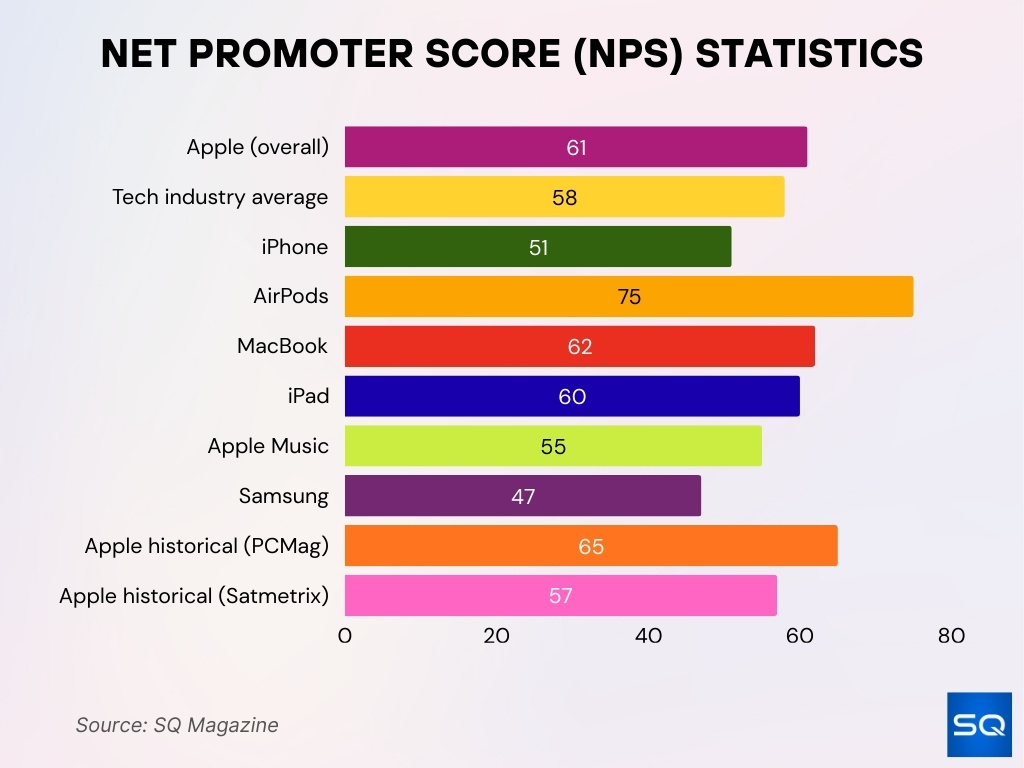
- Apple’s NPS is commonly cited as 61 in 2025.
- This score positions Apple above the tech industry average, which is around 58.
- CustomerGauge reports Apple’s average across product lines (earphones, laptops, etc.) is 61.
- Within Apple’s products, NPS scores vary: iPhone ~51, AirPods ~75, MacBook ~62, iPad ~60, Apple Music ~55.
- Some sources historic, PCMag found Apple’s NPS = 65, Satmetrix found ~57.
- A score above 50 is considered excellent; Apple’s 61 falls into that bracket.
- In the ecosystem of tech brands, Apple’s NPS strongly outpaces direct competitors like Samsung (~47).
Customer Satisfaction Scores
- In many surveys, Apple leads in smartphone satisfaction, scoring in the top percentile among brands.
- Among Mac users, satisfaction often reaches 90%+ levels in independent reports.
- Apple’s service and support are commonly rated as among the best in consumer electronics.
- Users regularly praise the seamless integration (e.g., iCloud, continuity) as reducing friction and increasing joy.
- In trade-in and upgrade surveys, many users report satisfaction with the resale/trade-in process.
- Apple’s updates and software maintenance often receive favorable reviews in satisfaction ratings.
- When issues arise, Apple’s support responsiveness is a key satisfaction driver.
- Customer satisfaction tends to decline only marginally when new models lag expectations, but loyalty often cushions that drop.
Repeat Purchase and Repurchase Rates
- 84% of iPhone owners say they plan to buy another Apple device next time.
- Apple’s trade-in loyalty is high; 74.6% of trade-in users stay within the brand.
- In surveys, a 70% repeat purchase rate is cited among iPhone users wanting another Apple device.
- 48% of iPhone users say they’re unlikely to switch brands in future purchases.
- Among millennials, repurchase intent is especially strong, nearing 96% in certain demographics.
- Some consumer panels show that over 90% of Apple users plan to stay within the ecosystem when upgrading.
- The high retention in Apple’s installed base ensures a strong base of repeat purchases year-on-year.
- Even when switching within Apple’s categories (e.g., from iPhone to iPad, or Mac to MacBook upgrade), purchase overlap remains high.
Apple Ecosystem Usage by iPhone vs Non-iPhone Users
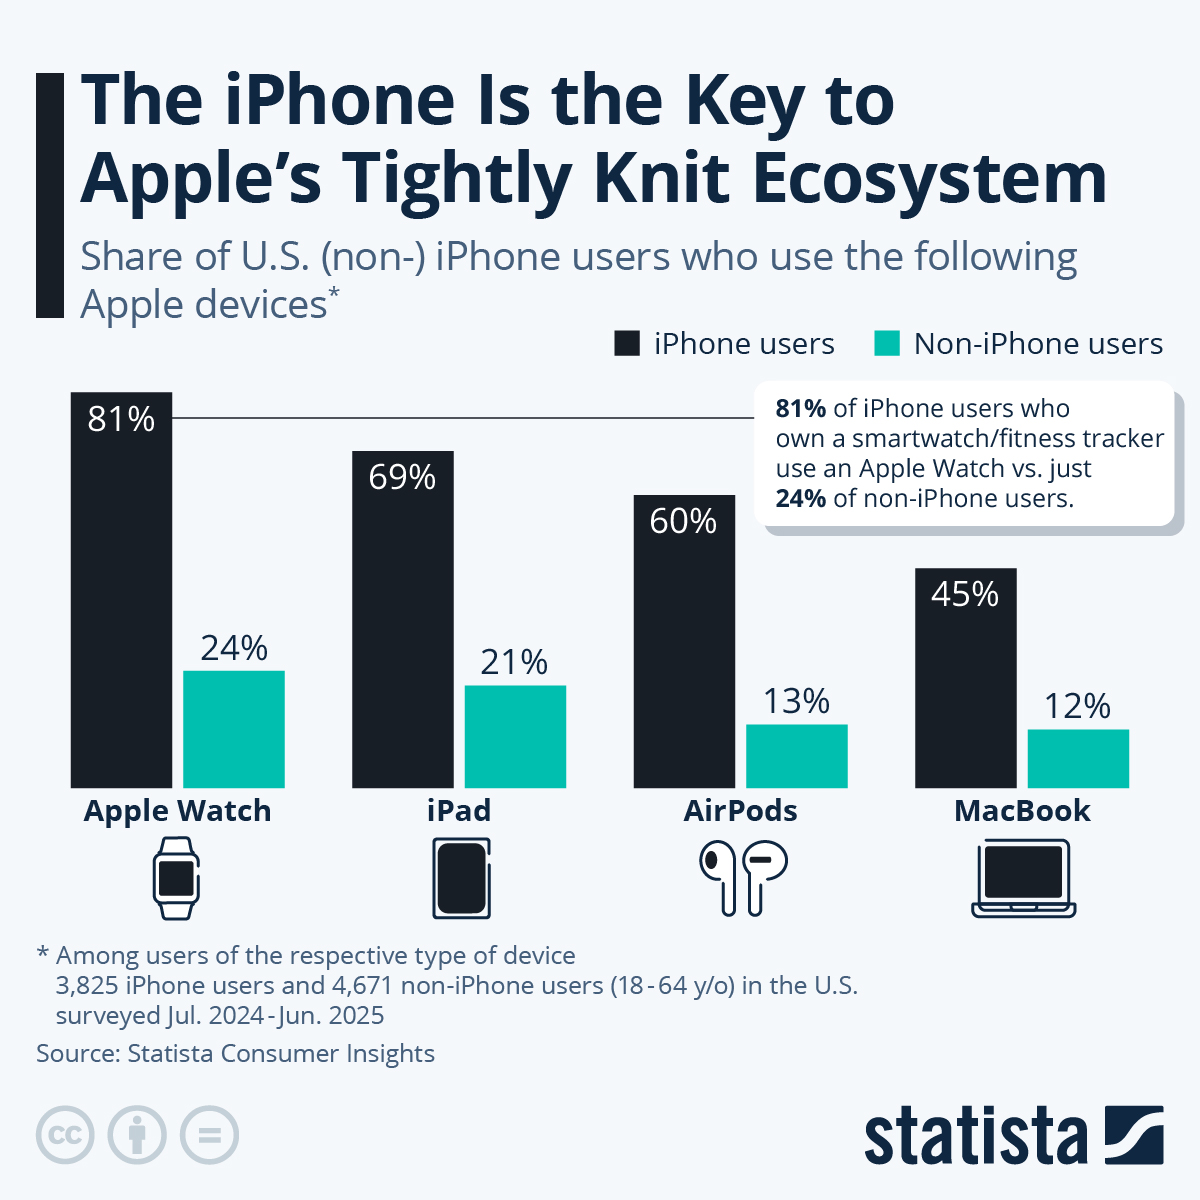
- 81% of iPhone users with a smartwatch or fitness tracker own an Apple Watch, compared to just 24% of non-iPhone users.
- 69% of iPhone users own an iPad, while only 21% of non-iPhone users do.
- 60% of iPhone users use AirPods, versus 13% of non-iPhone users.
- 45% of iPhone users have a MacBook, compared to 12% of non-iPhone users.
Apple’s Dominance in Smartphone Loyalty
- iPhone users exhibit a 92% retention rate, versus Samsung’s ~77%.
- Apple has maintained > 90% retention in recent years.
- iPhone users are more loyal than Android users by ~18% margin in some studies.
- In the U.S., Apple has continued to dominate premium smartphone loyalty.
- Among smartphone brands, Apple often leads in satisfaction, repurchase intent, and recommendation metrics.
- Despite regulatory and competitive pressure, Apple’s smartphone loyalty percentage remains remarkably stable.
- In 2025 surveys, Apple is still the top tech brand by loyalty among consumers.
- The strong smartphone loyalty buttresses Apple’s ability to cross-sell services and expand ecosystem usage.
Demographic Insights on Brand Loyalty
- 79% of iOS users reportedly stay in the Apple ecosystem.
- 73% of iPhone users see themselves as at least somewhat loyal.
- Within millennials who use iPhones, 96.4% intend to repurchase Apple devices.
- Younger users (Gen Z) appear more fluid in brand loyalty post-pandemic, with 57% reporting less loyalty to brands overall.
- Apple is the top tech brand in U.S. loyalty, capturing loyalty in ~55.2% of consumers.
- Older cohorts (55 +) tend to show more inertia in switching, which benefits Apple’s installed base.
- Geographically, Apple’s loyalty is stronger in Western markets than in some emerging markets.
- Among upgrade users, those with higher incomes or premium buyers show stronger loyalty patterns.
How Many Purchases Build Brand Loyalty
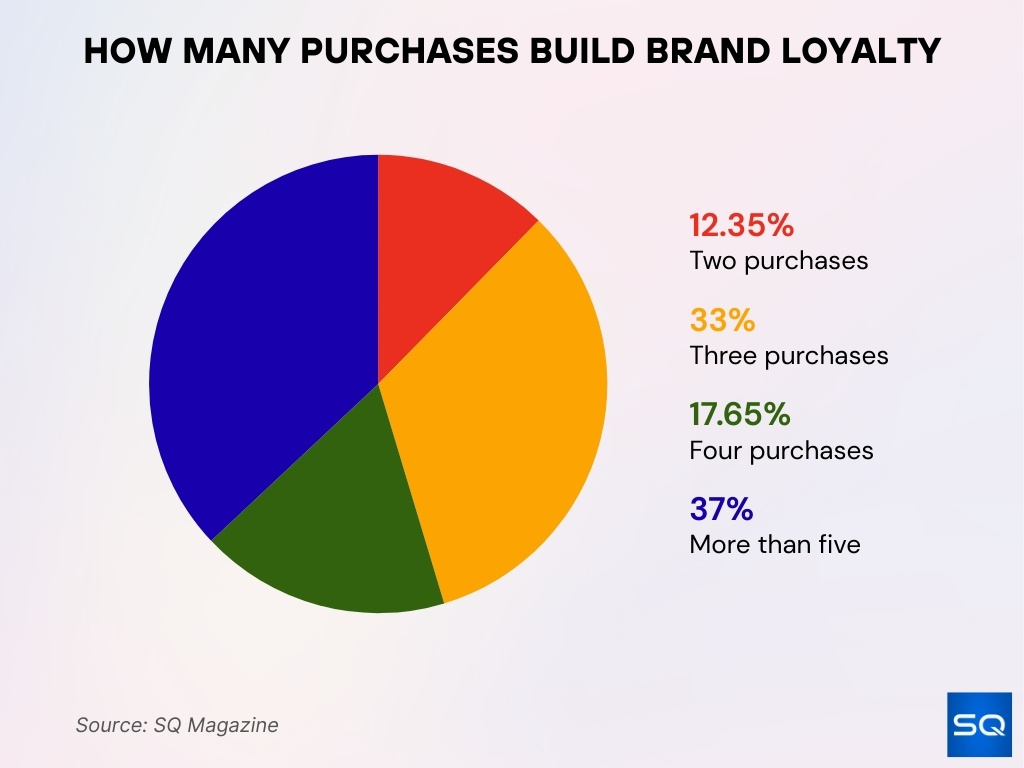
- 37% of consumers need more than five purchases before committing to brand loyalty.
- 33% of shoppers form loyalty after just three purchases.
- 17.65% of buyers become loyal after making four purchases.
- Only 12.35% of customers develop loyalty after just two purchases.
Apple Service and Support Satisfaction
- A survey among ~16,000 consumers showed Apple scored 81% customer satisfaction, higher than any other smartphone brand.
- In a CIRP study for the year ending June 2025, iPhone loyalty in the U.S. was 89% overall, but when users kept the same carrier, loyalty climbed to 92%; if they switched carriers, loyalty dropped to 79%.
- Apple’s Genius Bar and walk-in service are often cited by users as a key reason to stay with Apple.
- When users give feedback on Apple’s in-store or support encounters, the internal NPS/TMS systems factor into staff evaluation, encouraging care.
- Apple solicits surveys after purchases and service interactions, often tying responses to Net Promoter Score metrics.
- Quick issue resolution and transparent updates tend to buffer churn even when hardware problems arise.
- Because Apple controls both hardware and software, support is often more effective than for multi-vendor ecosystems.
- Users repeatedly mention support trust as a switching deterrent; they fear losing service reliability if they defect.
Loyalty Statistics by Product Category
- iPhone/smartphone: retention ~92% (in best conditions) and loyalty ~89% reported in CIRP data.
- Mac/computers: Mac users historically show high satisfaction and upgrade retention.
- iPad/tablet: iPad users often maintain cross-device usage within the ecosystem.
- Apple Watch & wearables: loyal users stick because health/fitness data continuity matters.
- AirPods/audio: these are often impulse or accessory purchases, but users who own them often stick due to seamless switching and ease.
- Services/subscriptions: products like iCloud, Apple Arcade, and Apple TV+ strengthen cross-category loyalty.
- Apple’s services as a product class report NPSs in similar or higher ranges than hardware.
- Upgrading across product categories (e.g., switching from iPhone to iPad or Mac) is common among loyal users.
Apple Music and Service Retention Rates
- Apple Music reportedly maintains a 62% subscriber retention rate.
- Over 60% of users who sign up for Apple Music stay active beyond the free trial.
- The deeper the service integration (e.g., seamless playback across devices), the higher the retention tends to be.
- Services like iCloud, Apple TV+, and Arcade also benefit from ecosystem pull.
- Because hardware and service subscriptions are bundled incentives, users see value in staying.
- Apple sometimes offers discounted or trial service bundles to hardware buyers, which improves adoption and retention.
- Service retention is lower in markets with lower income or higher competition, but Apple’s brand strength helps offset that.
- Some reports suggest service retention is more volatile than hardware loyalty, but still robust among core users.
Global Loyalty Insights for Apple
- Apple has over 2.2 billion active devices globally.
- In emerging markets, loyalty is moderated by price sensitivity, carrier subsidies, and availability.
- In China, studies suggest over 90% of iPhone users intend to stay with Apple.
- In Western markets (U.S., Europe), loyalty remains strongest where consumers value privacy, brand, and ecosystem.
- Where subsidies and carrier deals dominate, Apple leverages those channels to sustain loyalty.
- The Digital Markets Act in Europe may weaken some of Apple’s control over App Store conditions, impacting future loyalty.
- Local competitive brands (especially strong in Asia) exert pressure, but Apple often retains top-tier loyal users.
- Cross-region comparisons show that Apple’s loyalty edge is largest in mature, high-income markets and more challenged in value-conscious regions.
Apple Store Experience and Loyalty
- Apple has 535 retail stores globally (272 in the U.S., 263 overseas).
- Every store includes a Genius Bar for repairs and support, which helps strengthen service loyalty.
- The Apple Store layout, design, and staff training are all aligned with the brand image, reinforcing consistency and trust.
- In-store experiences like “Today at Apple” sessions help deepen user familiarity and community engagement.
- Apple invites in-store feedback and surveys immediately after visits, linking responses to NPS metrics.
- High store density in key markets gives Apple more direct control over the retail experience.
- Because users often physically handle devices and talk with staff, stores can convert skeptics into loyalists.
- Store experience consistency across markets helps reinforce the global brand promise.
Loyalty Trends and Future Outlook
- Average iPhone age is rising; the U.S. average is now ~35 months (~2.9 years).
- Slower upgrade cycles may force Apple to lean more on service retention and cross-sell rather than sheer hardware churn.
- Regulatory changes (e.g., App Store openness mandates) may weaken some ecosystem lock-in mechanisms.
- Consumers increasingly expect loyalty programs to be customizable and transparent. 81.2% of consumers favor reward customization.
- AI and predictive personalization strategies may become central to loyalty programs.
- Emotional loyalty (identity, values, trust) may gain weight relative to feature differentiation as features converge.
- Apple may face pressure to incentivize upgrades more aggressively (e.g, trade-in deals, financing) to maintain hardware loyalty.
- In high inflation or economic downturns, necessity and cost sensitivity may challenge loyalty among marginal buyers.
- Apple’s challenge, maintain its value proposition without alienating users who keep devices longer.
Frequently Asked Questions (FAQs)
~89 % of iPhone users stick with Apple when upgrading (2025 data).
Apple maintains a retention rate of 92% among iPhone users.
Apple’s NPS is 61 in 2025.
55.2% of U.S. consumers say they are loyal to Apple (top tech brand).
Apple Music’s subscriber retention is approximately 62%.
Conclusion
Apple’s customer loyalty remains exceptionally strong, anchored by high retention, robust NPS, innovation, integrated services, and emotional branding. Yet, cracks are appearing, slower upgrade cycles, regulatory shifts, and intensifying competition threaten parts of the moat. The companies that will challenge Apple best are those that can replicate not only its product quality, but its ecosystem coherence, service reliability, and emotional rapport. Read the full article to explore how each loyalty lever works, and what the numbers suggest for Apple’s next decade.


