Cybersecurity remains a frontline concern, and antivirus software still plays a central role in digital defense. We now see AV solutions evolve beyond simple virus scanning to real-time threat detection, endpoint protection, and integration with artificial intelligence. In industries like banking (protecting customer data) and healthcare (securing patient records), antivirus suites are woven into larger security stacks to prevent breaches. This article will unpack the hard numbers shaping antivirus adoption, performance, and market dynamics. Let’s start with the top stats!
Editor’s Choice
- The global antivirus software market is valued at about $4.23 billion in 2025.
- The expected compound annual growth rate (CAGR) is ~6.9% through 2029.
- 84% of users report having an antivirus installed on their computer in 2025.
- 68% of users have antivirus software installed on their smartphones.
- In real-world testing (Feb–Mar 2025), AV products face 212 test cases.
- Every day, 560,000 new pieces of malware are detected globally.
- In June 2025 tests, Microsoft Defender and Norton achieved perfect protection scores (100%) across protection, performance, and usability.
Recent Developments
- Microsoft is redesigning Windows to move antivirus and EDR (Endpoint Detection and Response) apps out of the kernel, reducing the risk of system-wide crashes or exploits.
- A faulty update from CrowdStrike in 2024 rendered 8.5 million Windows machines nonfunctional, accelerating Microsoft’s push for architectural changes.
- In 2024, the U.S. banned sales of Kaspersky antivirus software within the country over national security concerns.
- Avast’s parent company, Gen Digital, forecasts $4.70–$4.80 billion in revenue for 2026, citing strong demand for cybersecurity products.
- Integration of AI into malware and attack frameworks is pushing AV vendors to adopt ML-driven threat detection models.
- Researchers have shown that combining adversarial malware generators can increase evasion rates by 15.9% against top antivirus tools.
- A new threat surfaced in SVG phishing campaigns: over 523 SVG files linked to malware, 44 went undetected by any AV at the time.
Trends in Antivirus Software Costs and Coverage
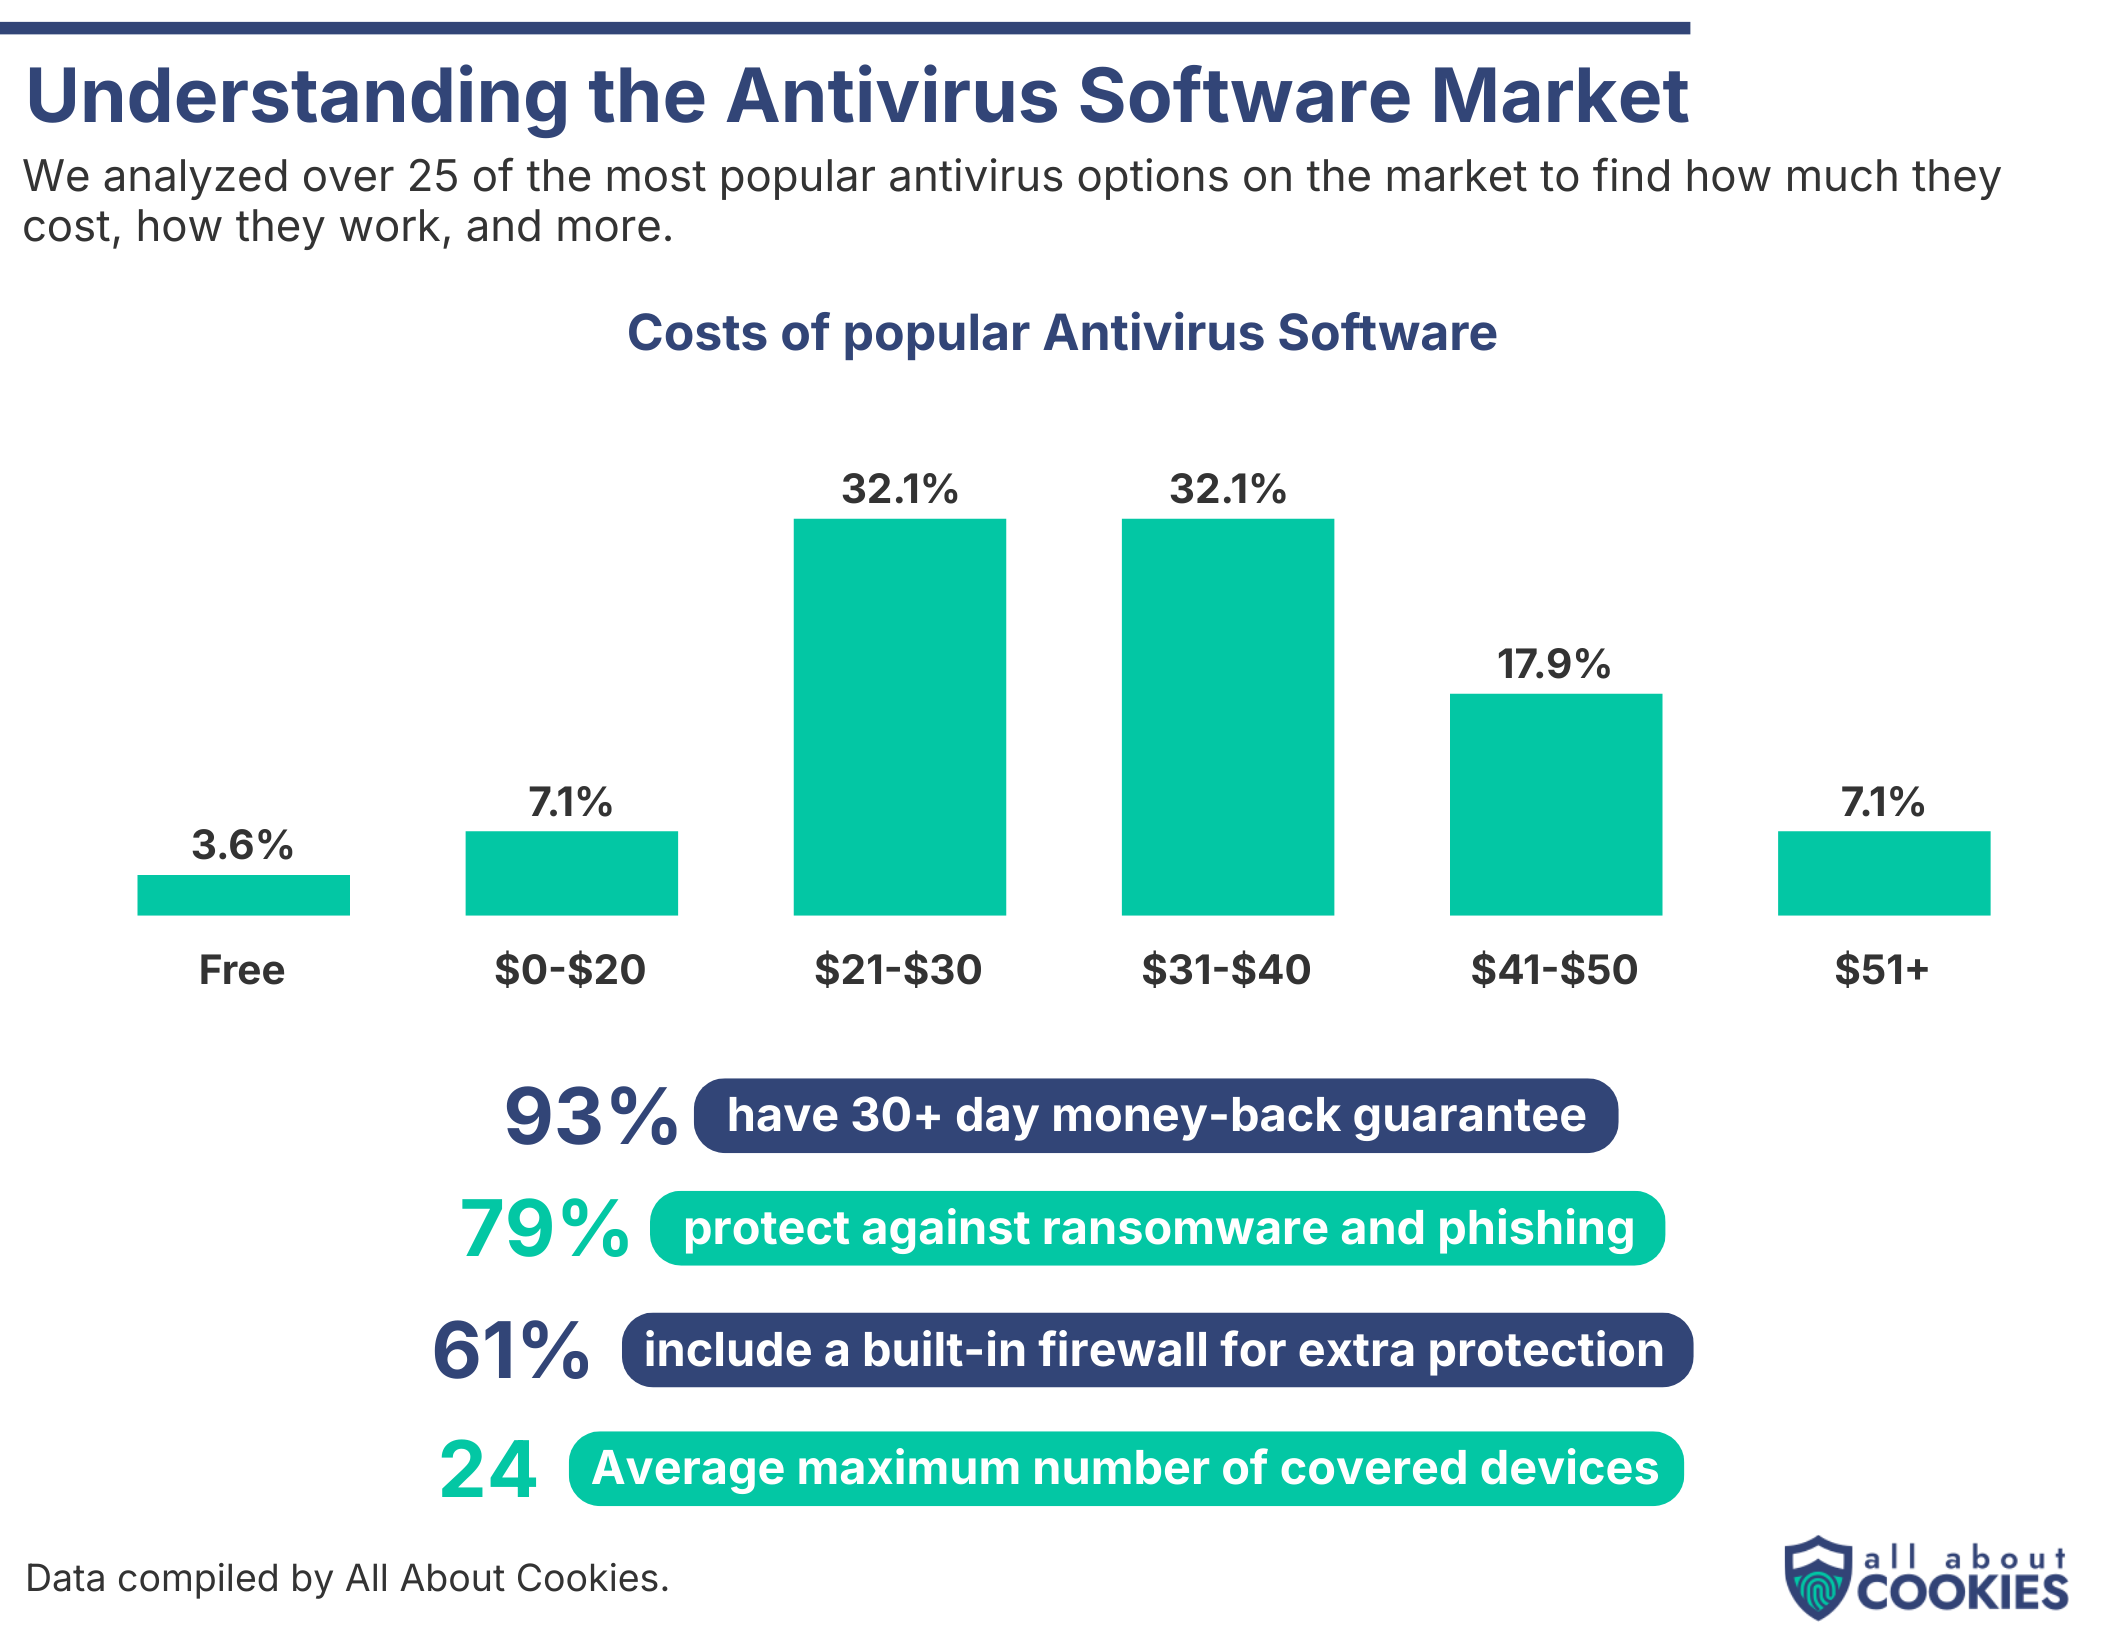
- 32.1% of antivirus plans cost between $21–$30, making it the most common price range.
- Another 32.1% fall in the $31–$40 range, showing mid-tier pricing dominance.
- Only 3.6% of antivirus options are free, highlighting the shift toward paid protection.
- 17.9% of antivirus software is priced at $41–$50, while 7.1% go above $51.
- 93% of antivirus products offer a 30+ day money-back guarantee.
- 79% include defenses against ransomware and phishing attacks.
- 61% come with a built-in firewall for additional protection.
- The average maximum coverage per antivirus subscription is 24 devices.
General Antivirus Statistics
- 84% of desktop/laptop users report having an antivirus installed.
- 68% of smartphone users have antivirus protection.
- 60% of tablet users also use antivirus.
- Roughly 16% of users feel antivirus software is ineffective.
- In 2024, 121 million Americans used third-party antivirus software.
- 17 million U.S. adults expressed intent to adopt antivirus software in the next 6 months (2024).
- In real-world protection testing (Feb–Mar 2025), AV products were tested against 212 threat scenarios.
- Daily, 560,000 new malware variants are discovered.
- Over 1 billion malware programs are believed to exist globally.
Demographics
- Americans 65+ are twice as likely to pay for antivirus than those under 45.
- 17% of U.S. adults use antivirus software on mobile devices.
- More than half of Americans rely on built-in antivirus software (or none) instead of third-party tools.
- 90% of antivirus subscribers list general security as a key motivation.
- 60%+ of users cite privacy as a driver for antivirus usage.
- Among those impacted by malware in the past year: 8.9% used free AV, 7.4% used paid AV.
- In consumer AV tests, some products record zero false positives while others show dozens.
By Device
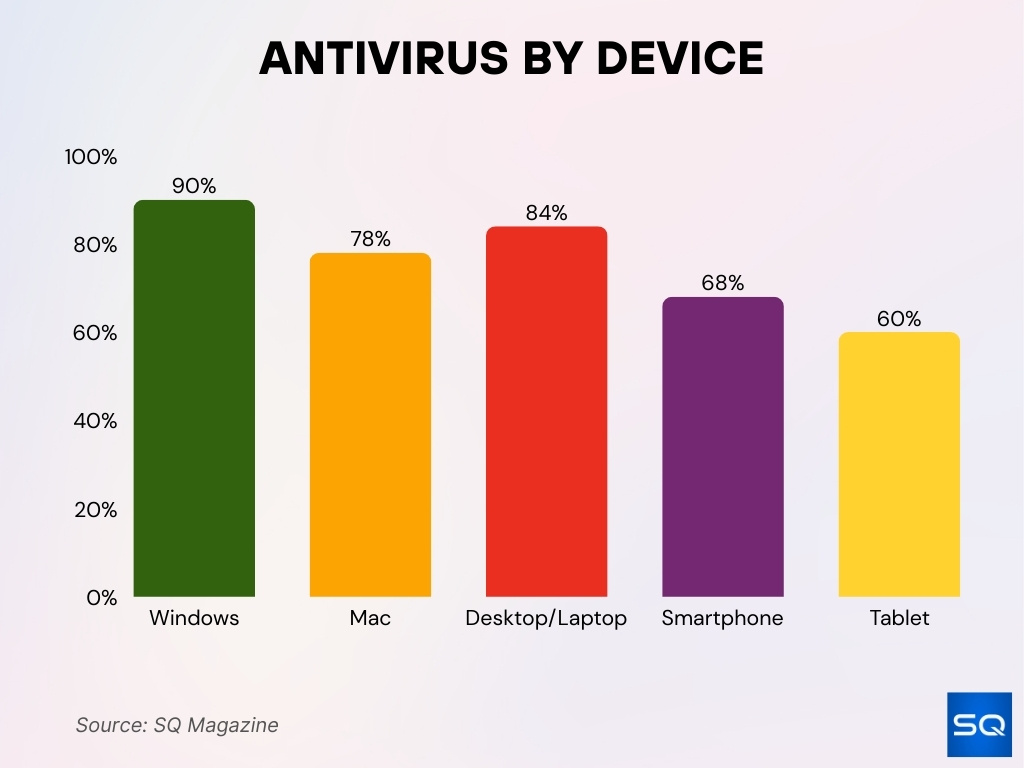
- 90% of Windows users have antivirus software installed, whereas about 78% of Mac users do.
- 84% of desktop or laptop users report having antivirus protection.
- 68% of smartphone users have some form of antivirus.
- 60% of tablet owners use antivirus software on their devices.
- Among desktop users with antivirus software, 42% actively sought out a third-party solution (versus sticking with built-in protection).
- Only 32% of Mac users with antivirus software choose a third-party solution; the rest rely on built-in macOS protection.
- In mobile security tests (July 2025), 14 Android security apps were evaluated for detection and usability.
- The shift to ARM-based Windows devices (Surface, Thin PCs) is pushing AV vendors to optimize for low-power architectures.
- Some antivirus products now segment offerings by device category (PC, mobile, IoT), charging per-device or bundling cross-device protection.
Antivirus Market Financial Insights
- The global antivirus software market is valued at $4.23 billion in 2025.
- It is projected to grow to $5.52 billion by 2029.
- Some forecasts show the broader antivirus/secure software market at $4.72 billion in 2025.
- The market is expected to expand at ~6% CAGR from 2026 to 2035.
- DataIntelo forecasts growth from $3.93 billion (2023) to ~$6.35 billion by 2032.
- Gen Digital, owner of Avast/Norton, projects 2026 revenue between $4.70 and $4.80 billion.
- North America holds a dominant share (~48.3%) of the antivirus market.
- The enterprise antivirus services market is separately tracked, though many forecasts remain proprietary.
Detection and Effectiveness Rates
- In AV tests for Android devices (July 2025), multiple security apps achieved high detection with minimal false positives.
- In independent real-world protection tests (Feb–Mar 2025 via AV-Comparatives), AV products faced 212 threat cases.
- In some lab tests, Microsoft Defender and Norton achieved perfect scores (100%) across protection, performance, and usability.
- Detection effectiveness in malware tests often exceeds 99% for top antivirus products.
- False positive rates vary widely: some AVs generate zero false alarms, others dozens per month.
- In certain comparative tests, an AV caught > 99.95% of threats and flagged less than 0.01% of benign files.
- Across platforms, detection rates tend to drop slightly on mobile and IoT compared to desktops, due to obfuscation and new attack vectors.
- Some adversarial malware techniques can increase evasion success by ~15.9% against top AVs.
- In cross-platform recall tests (Windows + macOS + mobile), combined AV suites maintain > 99.5% detection in most lab results.
Antivirus Market Share for Windows
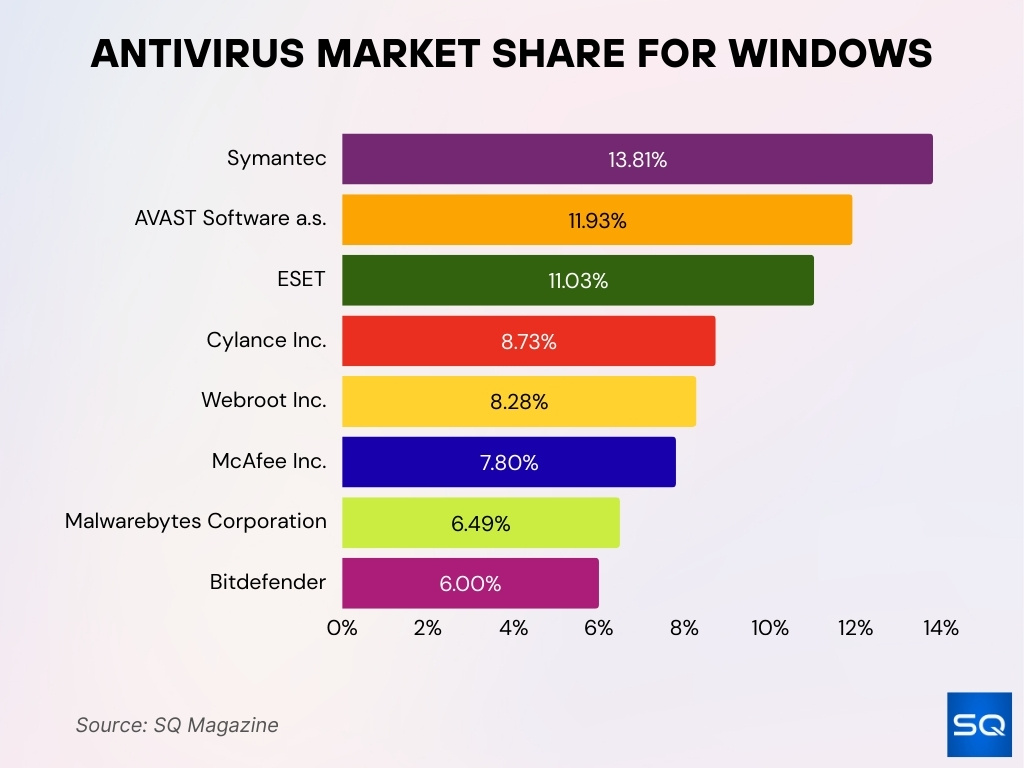
- Symantec holds 13.81%, making it the top individual brand in the Windows antivirus space.
- AVAST Software a.s. captures 11.93%, showing strong adoption.
- ESET follows closely with 11.03% market share.
- Cylance Inc. accounts for 8.73%, reflecting its growing presence.
- Webroot Inc. holds 8.28% of the market.
- McAfee Inc. maintains 7.8%, once a leader but now behind competitors.
- Malwarebytes Corporation has a 6.49% share.
- Bitdefender rounds out the list with 6% market share.
Malware and Ransomware Trends
- Daily, around 560,000 new malware variants are detected globally.
- Over 1 billion malware samples exist in various databases and archives.
- Ransomware attacks targeting Windows account for ~93% of all enterprise ransomware cases.
- Supply chain attacks are rising fast; 45% of organizations are expected to have experienced one by 2025, a 300% increase since 2021.
- Malware that bypasses AV detection is increasingly using fileless techniques, memory-resident code, and steganography.
- The average ransom demanded in 2024 – 2025 ranges widely, but many fall between $50,000 and $200,000 per incident.
- Mobile malware (banking trojans, spyware) grows notably in regions with high mobile adoption.
- Multi-stage malware (dropper + payload) is more common, meaning AV must detect both stages to block attacks.
- Malware families evolve faster, and many AV vendors receive new threat samples within minutes of discovery via cloud-sharing networks.
Mobile Antivirus Statistics
- In 2024, 17% of U.S. adults reported running antivirus software on their mobile phones.
- In the same survey, free vs paid split for AV usage maintained ~27% using free and ~73% using paid third-party AVs (across platforms).
- In AV-Comparatives’ Mobile Security Review 2025, both built-in and third-party apps were tested for malware protection, battery usage, and usability.
- The mobile AV apps that rank high often add features like anti-phishing, Web filters, SMS scan, and app privacy protections.
- In July 2025, 14 Android security apps were tested for default settings protection.
- Differences in detection, some mobile AVs caught > 99% of known malware in tests, others lagged in zero-day threats.
- False positives in mobile AV tests are typically lower in number than desktop AV false positives, but misclassification of normal apps still occurs.
- Users often disable AV features due to battery drain or performance slowdown complaints.
- Some mobile antivirus suites bundle VPN, safe browsing, or identity protection to increase perceived value.
Antivirus Feature Adoption
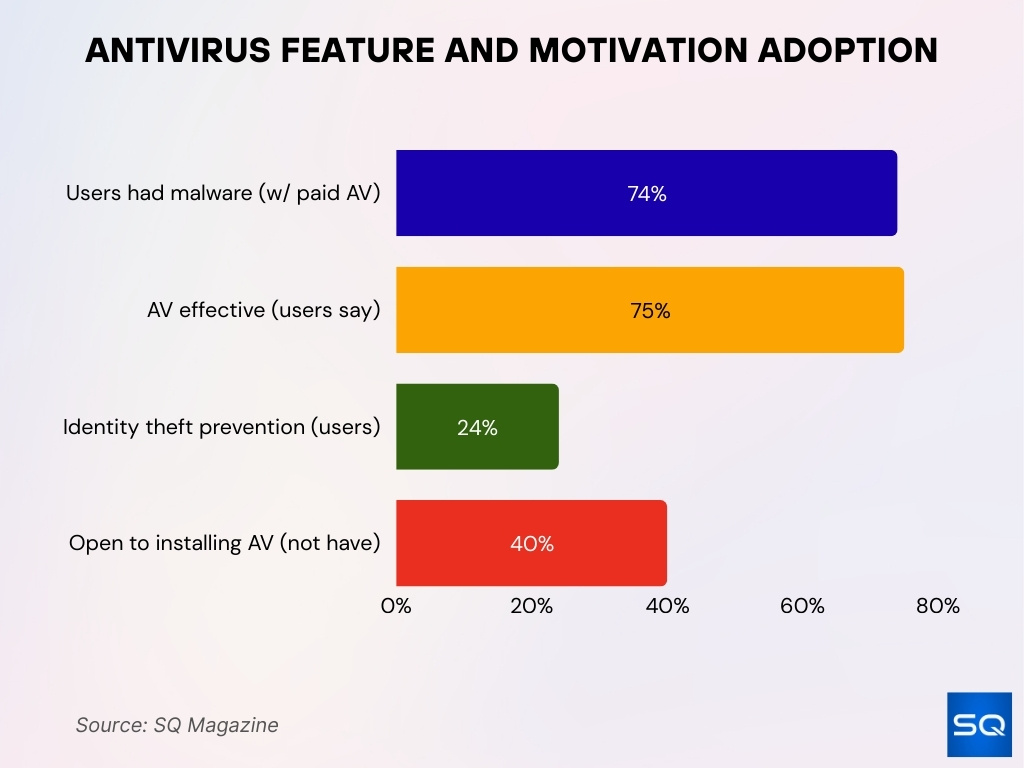
- Among users of commercial antivirus software, 74% reported experiencing malware or a virus in the past year.
- 75% of users say their antivirus is effective in keeping them safe.
- Identity theft prevention is cited by ~24% of users as a key motivator for AV usage.
- ~40% of users without antivirus software say they are open to installing it.
- Features beyond core scanning (e.g., phishing protection, behavioral analysis) are increasingly expected in AV suites.
- Adoption of cloud-based threat intelligence and crowd-sourced detection is rising among modern AVs.
- More users expect real-time and heuristic detection rather than purely signature-based.
- Use of sandboxing, rollback, and system isolation features is growing in premium offerings.
- VPN, breach monitoring, password manager, firewall, and parental controls are now standard add-ons in many AV products.
Free vs Paid Antivirus Programs
- Among third-party AV users, about 27% rely on free products, and the remaining 73% choose paid versions.
- Free AVs often provide baseline features (signature scanning, basic firewall) but omit advanced modules (behavioral protection, sandboxing, zero-day shields).
- Paid AV users are more likely to access support, frequent updates, and cloud-based detection layers.
- Free AV adoption is higher in price-sensitive markets or among casual users.
- Paid AV suites report higher retention rates, often > 60%, because of bundling (VPN, password manager, backup).
- Some vendors adopt “freemium” models, free core protection plus paid modules for extra features.
- In enterprise trials, many migrate from free to paid after the initial evaluation period.
- Free AVs tend to lag slightly behind in detecting very new threats compared to paid, due to delayed updates or reduced cloud access.
- The cost difference, paid AV licenses typically run $30 to $60 per year for home users (depending on devices).
- Because free AVs sometimes monetize via data, users weigh privacy tradeoffs when choosing free vs paid.
Enterprise Antivirus Adoption Trends
- The enterprise antivirus, endpoint protection market is projected to expand significantly in the coming years.
- One source values enterprise AV services revenue at $5.0 billion in 2024, growing toward $9.0 billion by 2033.
- Many organizations adopt zero-trust frameworks, integrating endpoint protection (AV) as a key control. The zero-trust market itself is estimated at $38.37 billion in 2025.
- In 2025, ~45% of organizations expect to have been impacted by a software supply chain attack, a factor pushing enterprise AV adoption.
- Enterprises increasingly prefer AV solutions with built-in EDR, XDR, or SIEM integration rather than standalone antivirus.
- Cloud-native endpoint protection is gaining preference, enabling centralized policy and instant updates across distributed sites.
- Some AV vendors now license per “endpoint instance” (agent + microservice) rather than by physical device count.
- Large enterprises often negotiate multi-year contracts to lock in pricing and support.
- In sectors like finance, healthcare, and critical infrastructure, AV adoption is virtually universal due to compliance mandates (e.g., HIPAA, PCI DSS).
- Some large organizations now consider rolling their own detection tools (threat hunting, internal ML) but still rely on commercial AV as backbone protection.
Regional Antivirus Statistics
- In China, nearly 47% of PCs are estimated to be infected at any time, signaling widespread vulnerabilities.
- Iran leads in mobile malware infection with ~30.3% of smartphones compromised.
- In Q1 2025, Kaspersky products blocked 629 million+ online attacks globally.
- In Q1 2025, Kaspersky’s Web Anti-Virus module detected 88 million+ unique malicious URLs.
- North America is projected to command ~48.3% of the global antivirus market share.
- Europe’s market is buoyed by regulation (GDPR, NIS2), with solid growth in antivirus adoption.
- Asia Pacific is a fast-growing region thanks to digitalization, IoT growth, and increasing cyber awareness.
- Latin America, the Middle East & Africa regions are gradually increasing uptake, driven by rising awareness and lower per-device pricing.
IoT and New Threat Trends
- In Q1 2025, IoT devices were a growing target, and attacks against embedded and networked devices increased significantly.
- Unpatched firmware causes ~60% of IoT breaches.
- Attacks on medical IoT devices rose 123% year over year in recent statistics.
- Botnets built from compromised IoT devices drive ~35% of all DDoS attacks.
- Many IoT devices still ship with default passwords, ~20% or more remain unchanged by users.
- Average cost per IoT security failure incident, $330,000.
- On average, each IoT breach causes ~6.5 hours of downtime.
- Attackers increasingly exploit IPv6 expansion, as IPv6 adoption grows, device discovery via IPv6 is an emerging vector.
- New malware uses side-channel and sensor manipulation to evade traditional AV models on IoT.
Antivirus Subscription and Pricing Data
- Typical antivirus subscriptions cost between $30 and $100 per year, depending on device coverage and features.
- Entry-level AV with standard features often falls under $50.
- Premium AV suites with added modules (VPN, identity protection) can exceed $100/year.
- Many vendors offer multi-device bundles (3, 5, 10 devices) to increase value per user.
- Renewal prices often increase 20–50% over first-year pricing.
- Some antivirus services adopt tiered or modular pricing (core + add-ons).
- Freemium models regularly upsell to paid tiers after trial periods.
- In developed markets, uptake of paid AV is higher; in price-sensitive regions, users lean toward free or lighter editions.
- Bundling with other security tools (e.g., VPN, firewall) often helps vendors justify higher-tier pricing.
Recommendations and Insights
- For home users, prioritize AV products that combine real-time detection, lightweight performance, and regular updates.
- Mobile users should choose solutions with anti-phishing, app scan, SMS scan, and minimal battery impact.
- Enterprises should prefer AV solutions integrated with EDR, SIEM, and zero-trust frameworks.
- In regions with price sensitivity, offer modular upgrade paths over all-in bundles.
- For IoT-heavy environments, segment devices and apply lightweight agent or network-based AV protections.
- Include fallback/rollback mechanisms to recover from false alarms or update failures.
- Monitor renewals carefully; vendors frequently hike pricing after the first year.
- For product teams, measure feature adoption (usage rates, retention, drop-off) to refine priority upgrades.
- Educate users on firmware and software patching; unpatched systems remain large attack vectors.
Frequently Asked Questions (FAQs)
It reached about $4.72 billion.
Approximately 6.0% annually.
Around 121 million U.S. adults.
75% of respondents report that it keeps them safe.
Forecasted at around 10.1% CAGR.
Conclusion
Antivirus remains a vital pillar of digital defense, evolving from signature scanners to multi-layered protection platforms. The data shows broad adoption across devices and regions, rising expectations around features, and strong market growth despite pressure from built-in OS security. IoT threats and new malware vectors are forcing constant innovation in detection and pricing strategies. As you navigate your antivirus choices or design upgrade roadmaps, these insights should guide you to solutions that balance security, cost, and performance.


