Digital peer-to-peer payment platforms such as Venmo and Cash App are reshaping how U.S. consumers send, receive, and manage funds. In one scenario, a college student uses Venmo to split rent and utilities, while in another, a gig-economy worker takes advantage of Cash App’s direct deposit feature to access earnings early. This article delves into current statistics for both platforms, covering growth, user behaviour, and competitive dynamics, to help you understand their evolving role and impact.
Editor’s Choice
- Venmo’s total payment volume was estimated to be over $300 billion in 2025, according to industry analysts and PayPal earnings commentary, though exact figures vary.
- Cash App recorded ≈57 million monthly active users as of Q1 2025.
- Over 50% of Cash App’s revenue is Bitcoin-related as of 2025; exact shares vary by quarter.
- Cash App’s Cash Card processed $2.4 billion in transactions in Q1 2025.
- Venmo’s average user balance (for users who keep funds in the app) was $211 per month in 2023.
Recent Developments
- In 2025, Venmo’s monetized monthly active users reportedly rose by 24% in 2024.
- Cash App expanded its short-term lending product, with annualised lending volumes more than doubling in Q3 2025.
- Block Inc. reported about 57 million monthly active users in early 2025.
- Venmo launched an expanded merchant integration effort, projecting its debit-card payment volume to grow at a CAGR above 20%.
- Venmo gained traction in high-density urban states, California, New York, and Texas, with market penetration around 37% in 2025.
- Cash App announced over 5 million monthly active sponsored teen accounts by 2025.
- Venmo’s parent company, PayPal Holdings Inc., raised full-year guidance in mid-2025, citing Venmo revenue growth of 20%.
- Cash App increased its focus on everyday spending via its Cash Card. By Q1 2025, 82 % of cardholders used it for groceries, transit, and dining.
- Venmo strengthened its college-campus presence through features aimed at student splitting and social payments.
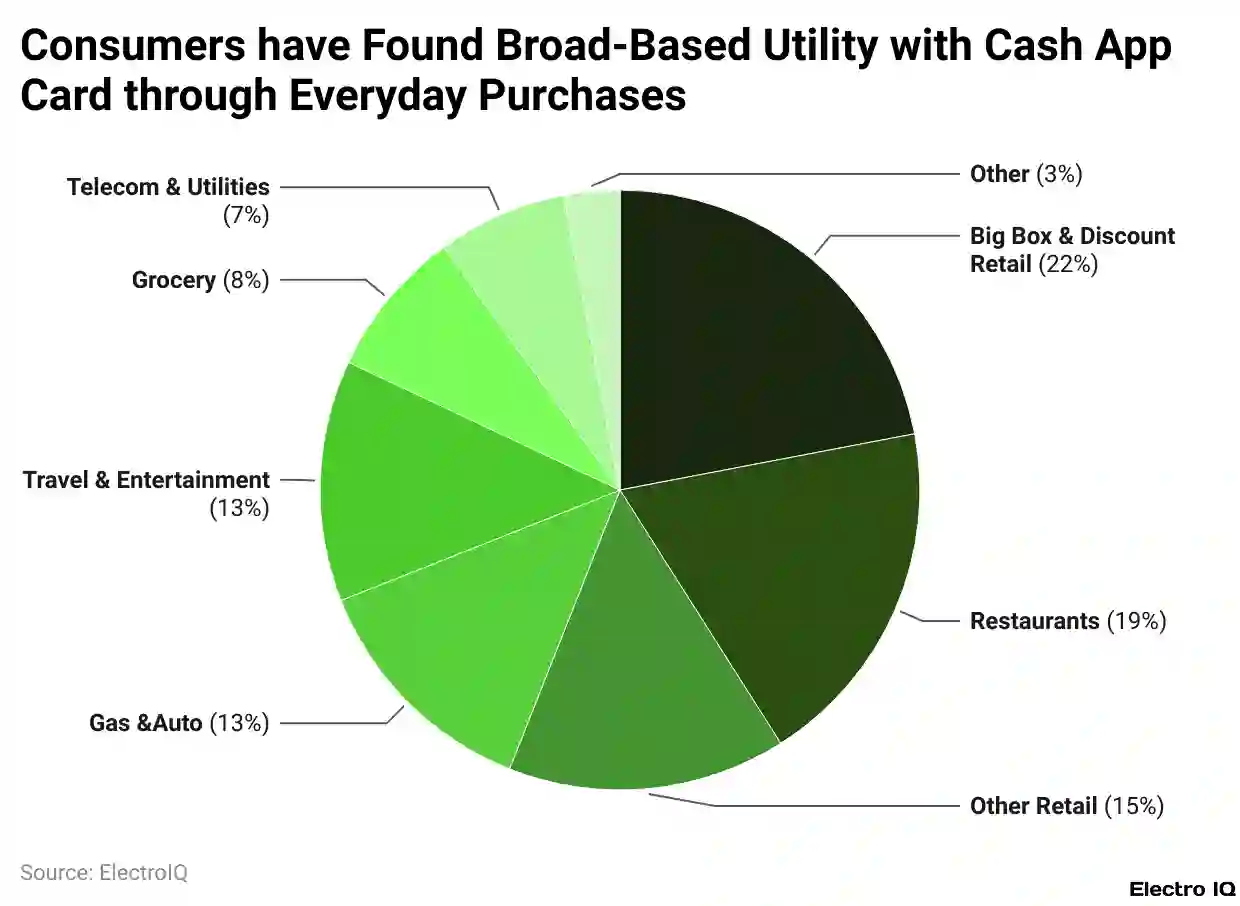
How Consumers Spend with the Cash App Card
- 22% goes to Big Box & Discount Retail, the top spending category.
- 19% is spent at Restaurants, showing strong demand for food purchases.
- 15% goes to Other Retail, indicating broad shopping behavior.
- 13% each is spent on Travel & Entertainment and Gas & Auto, tied in usage.
- 8% is allocated to Grocery spending, covering essential goods.
- 7% goes to Telecom & Utilities, reflecting bill payments.
- 3% is spent on Other Categories, covering miscellaneous expenses.
Revenue And Profit Figures
- Cash App’s estimated full-year revenue for 2025 is $18.5 billion, up ~14 % YoY.
- In Q1 2025, Cash App posted revenue of $3.88 billion, a 6.95 % decline from the prior year period.
- Cash App’s annual revenue in 2024 was $16.25 billion.
- Venmo’s revenue grew ~20% in Q2 2025 per PayPal commentary.
- Venmo contributes about 16% of PayPal’s total revenue.
- As of Q2 2025, Block Inc. reported Cash App gross profit at approximately $2.7 billion, indicating a projected YTD total nearing $5.24 billion if the trend continued.
- Venmo users who keep money in their Venmo balance averaged $211/month in 2023, helping with revenue via spending.
Peer-to-Peer (P2P) Transaction Volume
- Cash App processed annual inflows of approximately $282.9 billion in 2024.
- For Cash App, active users average monthly transactions of around five transfers per month.
- Venmo’s average monthly transactions per user were estimated at five in earlier years.
- Venmo’s monetised monthly active users grew 24% in 2024, driving increased transaction volume.
- Cash App’s Cash Card alone processed $2.4 billion in Q1 2025 transactions.
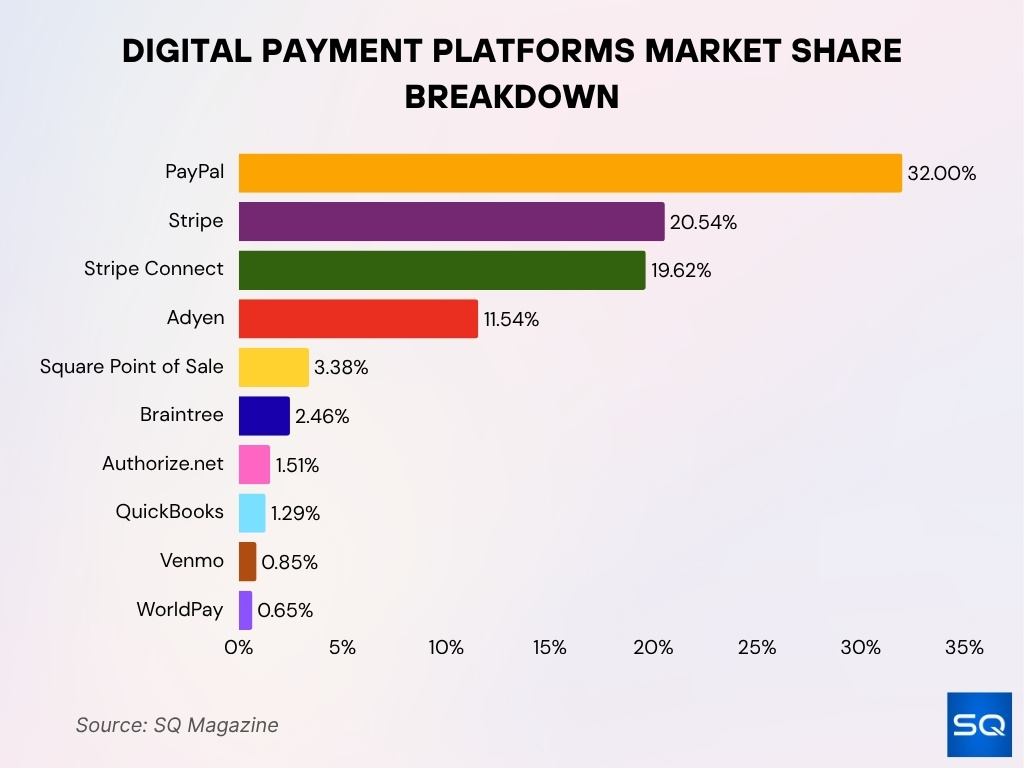
Digital Payment Platforms by Market Share
- PayPal leads with 32%, dominating the digital payments ecosystem.
- Stripe holds 20.54%, favored by online merchants and developers.
- Stripe Connect captures 19.62%, widely used by marketplaces and platforms.
- Adyen commands 11.54%, strong in global omnichannel payments.
- Square POS has 3.38%, focused on in-person small business payments.
- Braintree holds 2.46%, serving mobile and web transactions.
- Authorize.net accounts for 1.51%, popular among small e-commerce sites.
- QuickBooks takes 1.29%, blending accounting with payment tools.
- Venmo has 0.85%, with a limited share in this segment.
- WorldPay rounds out at 0.65%, showing minimal digital payment usage.
User Demographics And Age Groups
- For Cash App, 67% of Cash Card users in 2025 are aged 18‑29.
- Cash App’s direct-deposit service adoption reached ~72% of its users in 2025.
- Venmo’s user base includes ~54% millennials (aged ~25‑40) in 2025.
- Cash App draws lower-income users, ~39% earning under $50,000/year.
- Venmo’s student segment (college-campus) accounts for over 14% of its total users.
- Venmo’s gender split is roughly 51% female / 49% male in 2025.
- Cash App’s user base had ~57 million monthly active users in 2025 (+16% YoY).
- Venmo’s urban-coastal dominance, high in coastal cities like San Francisco, New York, and Boston.
Payment Limits
- On Venmo, unverified users may send up to $299.99 in total until identity verification is completed.
- Once verified, Venmo users can typically send up to $4,999 per rolling seven-day period.
- For business transactions, Venmo sets a limit of $2,999.99 per single payment for goods and services.
- On Cash App, individual peer-to-peer transfers are capped at roughly $7,500 per rolling seven-day period for verified users.
- Cash App direct-deposit users may have higher limits for receiving funds, often up to $300,000 annually.
- Cash App’s debit card, the Cash Card, has daily ATM withdrawal limits often around $1,000 and spending limits around $2,000 per day.
- Venmo’s instant transfer to a bank account is subject to a fee and the sub-limit of a maximum $25 fee on transfers up to the allowed amount.
- Both apps allow increasing limits by completing identity verification and adding linked bank accounts.
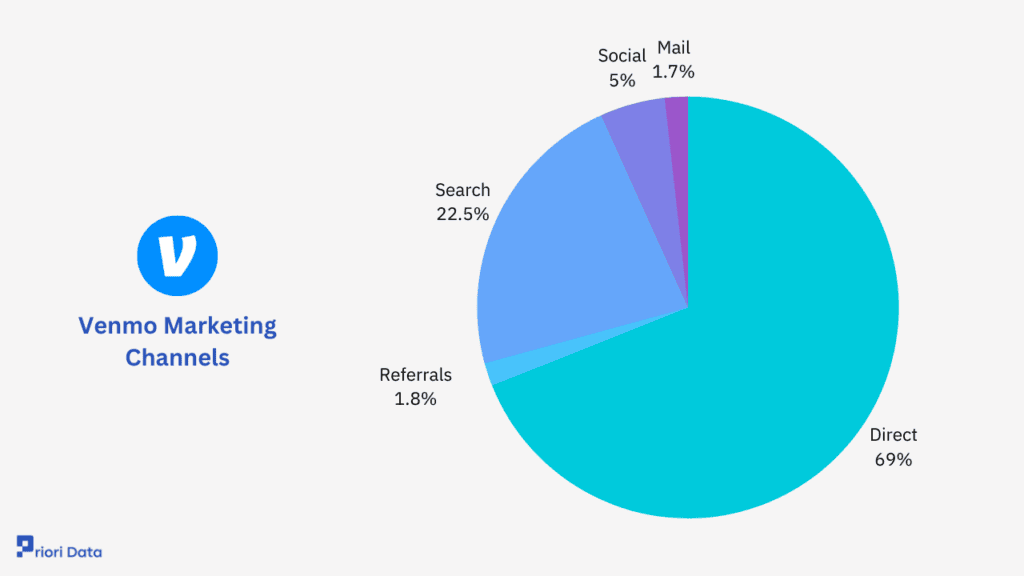
Venmo Traffic Sources by Marketing Channel
- Direct traffic leads at 69%, showing strong brand loyalty and recognition.
- Search traffic drives 22.5%, reflecting high visibility on search engines.
- Social media contributes 5%, indicating moderate platform engagement.
- Referrals make up 1.8%, showing low reliance on external links.
- Email traffic is just 1.7%, revealing minimal focus on email campaigns.
Fees And Cost Structure
- For Venmo, standard peer-to-peer transfers using a bank account or Venmo balance are free.
- Venmo charges a 3% fee when sending money funded by a credit card.
- Venmo’s instant transfer to a bank or debit card costs 1.75% (minimum $0.25, maximum $25).
- For Venmo business payments, the fee is 1.9% + $0.10 per transaction, and for tap-to-pay in-person, it is 2.29% + $0.10.
- For Cash App, the app is free to download and use for standard peer-to-peer; however, instant bank withdrawals cost about 1.5%–1.75%.
- Cash App business/merchant fees vary, but many cash-card and crypto transaction revenues support its model.
Security And Fraud Statistics
- Venmo users are cautioned that funds sent to the wrong person or in scams are rarely refundable.
- Cash App reported 57 million monthly active users in 2024, making the fraud risk scale significant.
- Studies show payment-app fraud increased notably during the pandemic.
- Venmo reports that its social-feed payments (≈20% of volume in 2025) may introduce additional exposure.
- Cash App’s user satisfaction rate is ~93% in 2025.
- Venmo’s app user ratings (4.6/5) reflect decent security and usability perceptions.
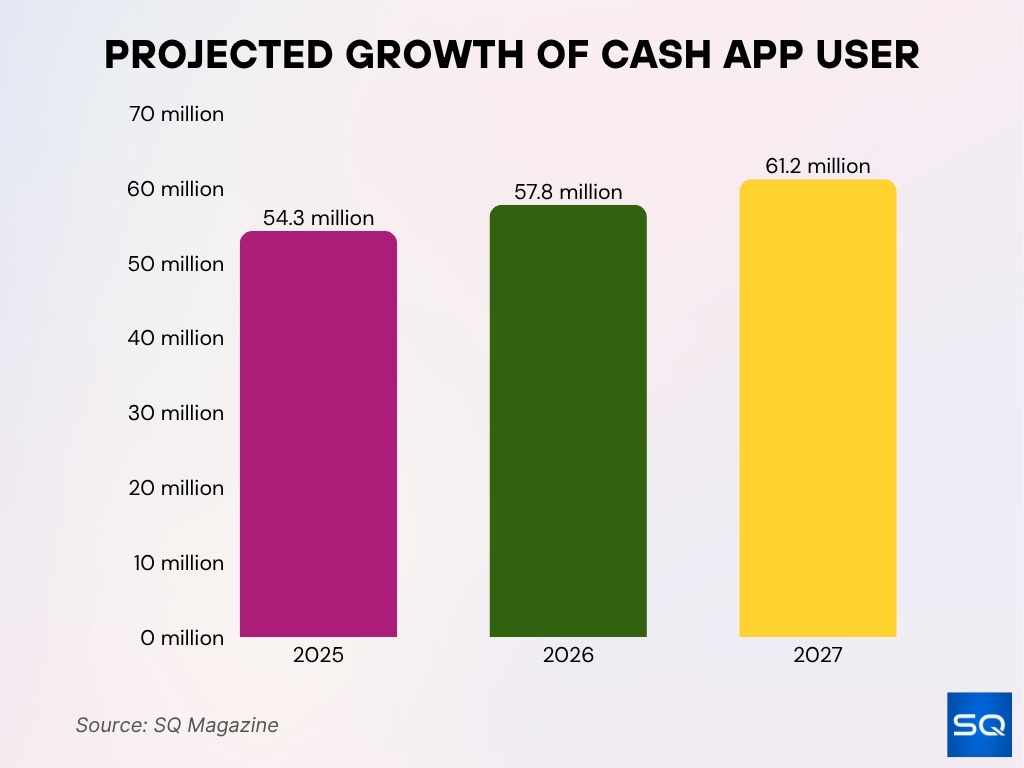
Cash App User Growth Forecast
- 54.3 million users in 2025, reflecting rising trust in peer-to-peer payments.
- 57.8 million users in 2026, fueled by deeper retail and banking integration.
- 61.2 million users in 2027, showing strong momentum in digital wallet adoption.
Mobile App Downloads And Engagement
- Cash App has been downloaded over 420 million times globally, with 14 million new installs in 2025 alone.
- Venmo has reached about 380 million lifetime downloads, with 11 million installs in the first half of 2025.
- In 2025, Cash App’s average session time is 6.7 minutes, compared with Venmo’s 4.9 minutes per session.
- Venmo’s 30-day retention rate stands at 62%, while Cash App’s is about 68%.
- Cash App’s Cash Card usage rose 34% YoY in 2025.
- Venmo reports ~65% of users engage weekly with the app in 2025.
- Mobile-app category data show overall global downloads projected at 299 billion in 2025.
- Cash App ranks in the top 10 free Finance apps on both iOS and Android in 2025.
Customer Satisfaction And Ratings
- Venmo scores app user satisfaction at 4.6 out of 5, based on 1.8 million reviews in 2025.
- Venmo’s debit-card user satisfaction increased to 87% in 2025.
- Cash App debit-card users report a satisfaction rate of 91%.
- Cash App resolves ~94% of customer issues within 72 hours.
- On Trustpilot, Cash App receives many 5-star reviews.
- Venmo for Business holds a composite user score of 7.7/10, with 92% of reviewers reporting a positive sentiment.
- Both platforms score highly for usability, but reviews flag slower customer support responses and fraud-related complaints.
- User surveys show that around 68% of Venmo users are comfortable with the security features.
Features And Functionalities Comparison
- Venmo’s social-linked payment transactions represent ~20% of its total payment volume in 2025.
- Cash App processed over 12 million Bitcoin transactions annually as of 2025.
- Venmo’s “Pay with Venmo” feature usage increased monthly active accounts by 30% in 2025.
- Cash App offers free tax filing for federal and state returns, with over 12 million returns filed through the platform.
- Venmo launched “Venmo for Teens” in 2025, with sign-ups surpassing 1.6 million users aged 13–17.
- Cash App’s Boost program offers discounts up to 15% on dining and retail purchases.
- Venmo merchants accepting payments number over 2 million as of 2025.
- Venmo’s merchant checkout completion rates improved by 17% after enabling Venmo payments in 2025.
- Cash App’s stock and Bitcoin trading features have been available since 2018 and 2019, respectively, supporting 1,800+ stocks and ETFs.
- Venmo’s average in-person tap-to-pay transaction value is about $47, while the average online payment value is $72 in 2025.
Business Account Adoption
- In 2025, the adoption rate of Venmo among SMBs is estimated at 44%‑47%.
- Over 3.8 million Venmo “Business Profiles” are active.
- Venmo reports that SMBs introducing its payment option saw an average 19% boost in transaction efficiency in 2025.
- The average point-of-sale transaction value via Venmo is $47, and online payments average around $72.
- For Cash App, business accounts generated approximately $900 million in revenue in 2025.
- Cash App for Business has surpassed 5.3 million active accounts.
- Among small-business sellers, 34% report using Cash App as a primary financial tool in 2025.
- Venmo’s business-to-consumer usage grew by 14% YoY in 2025.
Merchant Acceptance And Integration
- Venmo is accepted at over 1.1 million retail locations across the U.S.
- More than 608,000 websites list Venmo as a checkout payment option in 2025.
- Among top U.S. retailers, approximately 80% report they accept Venmo.
- Cash App integrations cover over 2.2 million SMB locations in 2025.
- Venmo’s standard business fee remains 1.9% + $0.10.
- Integration of Venmo’s “Pay with Venmo” button on platforms like Etsy produced a 15% YoY sales lift.
- Cash App’s subscriptions and crypto features contribute to merchant acceptance.
- Smaller merchants using Venmo report 22% shorter checkout processing times in 2025.
Social And Community Features
- On Venmo, the public social feed remains active, and about 65% of users engage weekly.
- Venmo launched Venmo Groups in 2025, used by over 5 million households.
- Emoji-based transaction notes occur in over 70% of Venmo payments.
- Cash App introduced “Cash App Fridays” with participation exceeding 1.4 million users weekly.
- Among Cash App users aged under 25, referral-code sharing is 3× higher than among users over 40.
- Venmo’s charity-donation feature enabled over $9.7 million in contributions in 2025.
- Social-payments model saw a 25% higher conversion rate.
- Cash App live-event tipping uptake rose 28% YoY in 2025.
Integration With Other Platforms
- Venmo is integrated with Uber, Airbnb, and DoorDash, enabling seamless in-app payments for millions of users in 2025.
- Venmo processes over $12 billion annually in recurring-billing transactions.
- Cash App integrates with Shopify and fintech APIs to support online retail payment solutions.
- Over 2.8 million users filed taxes through Cash App’s TurboTax link in 2025.
- Venmo and PayPal offer cross-platform fund management reaching over 425 million combined users globally.
- Cash App’s card supports Apple Pay and Google Wallet, allowing millions of users to make contactless payments.
- Venmo implemented real-time fraud alerts as a default feature starting Q1 2025, covering 100% of transactions.
- Cash App’s Square POS integration provides a unified experience for over 3 million merchants.
- Venmo’s partnerships with major lifestyle platforms drove a 24% increase in recurring transactions in 2025.
- Cash App Payments on Shopify increased merchant adoption by 40% year-over-year as of 2025.
Regional Usage Trends And State Distribution
- In the U.S., Cash App usage is highest in Texas and California, nearly 15% of total users.
- Florida accounts for just over 10%, and New York close to 9% in 2025.
- Georgia, Illinois, and New Jersey each account for 5%‑7%.
- Pennsylvania, Michigan, and Ohio represent around 3%‑4%.
- Venmo achieved roughly 37% market penetration in California, New York, and Texas.
- Less than 60% of small U.S. businesses accept digital wallets overall.
- Nearly 70% of U.S. adults had used mobile payments in the past three months in 2025.
Frequently Asked Questions (FAQs)
Over 50% of revenue.
Cash App: 6.7 minutes, Venmo: 4.9 minutes
Increased by 89% to US $363.5 million in expenses.
Over $300 billion annually.
Conclusion
This comparative review of Venmo and Cash App highlights how both platforms are breaking beyond peer-to-peer payments into commerce, business adoption, social features, and regional market dynamics. Venmo’s strength lies in social integration and large-scale merchant acceptance, while Cash App is leveraging investing, creator economy features, and a broad business-user base. For industry watchers, fintech strategists, or business leaders, understanding these distinct paths can clarify partnerships, integrations, and competitive positioning in mobile finance.


