Streaming has moved beyond niche entertainment; it now shapes how millions of Americans consume media every day. Today, streaming services dominate TV usage, pushing linear broadcast and cable into the margins. In education and live events, platforms like YouTube and Twitch empower interactive learning and real-time global audiences. In sports, streaming rights have become central to major leagues’ revenue strategies. Below are key statistics and trends that reveal where the industry stands now, and where it’s going.
Editor’s Choice
- Streaming usage in the U.S. overtook broadcast + cable TV combined, capturing 44.8% of total TV usage in May 2025.
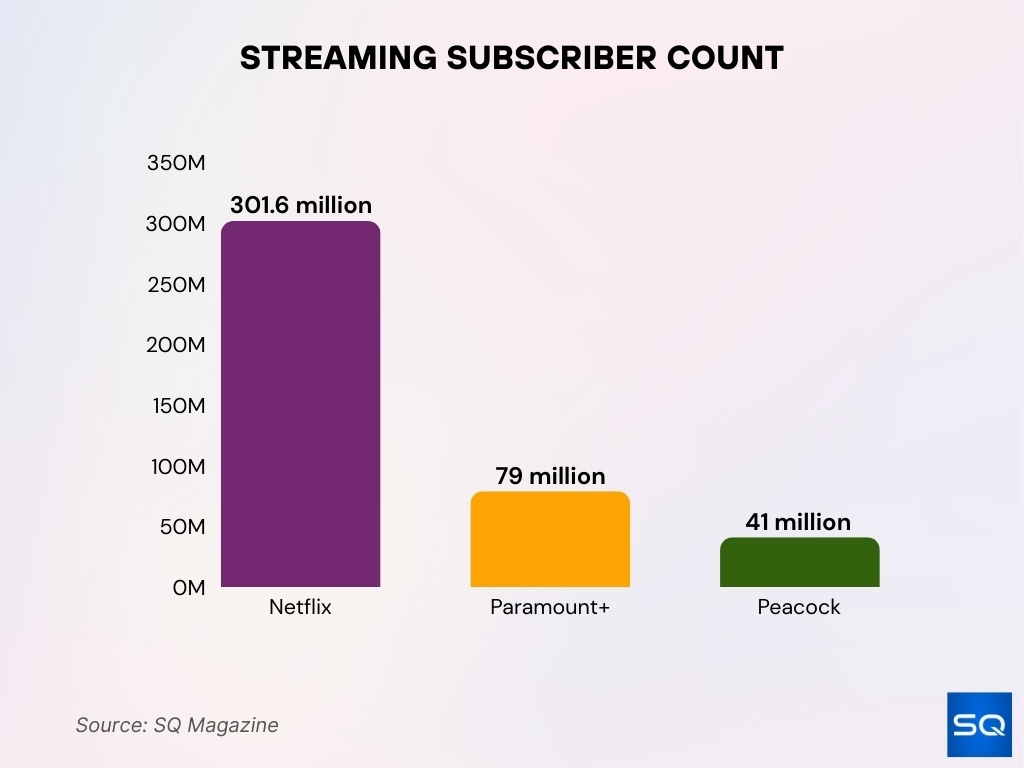
- Netflix holds about 301.6 million paid memberships globally as of early 2025.
- Peacock had 41 million paid subscribers in the U.S. by January 2025.
- In Q2 2025, streaming was in 96% of U.S. households (~124 million homes), showing a slight 1% drop from previous levels.
- Weekly FAST channel users accounted for 46% of total video consumers in the U.S. by late 2024.
- 39% of U.S. consumers cancelled at least one paid SVOD service in the previous six months; this churn rate rises above 50% among Gen Z and millennials.
- The number of FAST channels globally reached ~1,850 active channels by mid‑2025, a nearly 14% increase from Q1 2025 and about 76% since 2023.
Recent Developments
- U.S. streaming platforms (Netflix, Prime Video, Disney+) saw churn increase in Q1 2025; Hulu was the only major service with a 35% decrease in churn during that period.
- Streaming ad spend for connected TV (CTV) is expected to surpass traditional TV ad budgets in 2025.
- Platforms are expanding ad‑supported tiers (AVOD) or hybrid models to attract cost‑sensitive viewers.
- SVOD stacking (having multiple paid subscriptions) declined in the U.S. in 2024, average number of paid SVOD services per household fell from about 4.2 to 4.1.
- FAST services gained traction, weekly users rose, more exclusive channels launched, and content hours on FAST increased.
- Pricing continues to drive decisions, and many cancellations cite cost, with password sharing increasingly cited.
- Consumer willingness to pay increased by 12% year‑over‑year per Simon-Kucher’s 2025 study.
Video Streaming User Statistics
- Netflix, ~301.6 million paid global users by early 2025.
- Paramount+ reached 79 million subscribers globally by March 2025.
- Peacock had 41 million paid U.S. subscribers as of January 2025.
- Globally, video streaming service subscriptions increased from ~1.1 billion in 2020 to ~1.8 billion by 2025.
- In the U.S., 83% of households have at least one streaming service subscription in 2025.
- FAST weekly users comprised ~46% of total video consumers in the U.S. by late 2024.
- The average number of paid streaming services per U.S. household dropped slightly from 4.2 to 4.1 in Q2 2025.
- Typical daily time spent streaming online TV in the U.S./globally, ~1 hour 22 minutes per day for online streaming vs more for linear broadcast.
- 26% of global consumers said they paid for a streaming service in the last month (showing conversion from free/ad‑supported to paid).
Streaming Penetration by Region or Country
- U.S. household streaming penetration is about 96% (in Q2 2025), that is, almost all households have access to streaming.
- In Latin America and parts of Europe, AVOD and free platforms are growing fastest due to lower ARPU and higher cost sensitivity.
- Brazil saw FAST viewership increase ~4.5× since 2020.
- Global FAST channel count rose by ~76% since 2023 to ~1,850 active FAST channels by mid‑2025.
- Regions like Latin America and Asia‑Pacific are especially embracing ad‑supported/free streaming tiers.
- In North America, average daily streaming VOD viewing dropped to ~69 minutes per day in H1 2025 (down ~18% from a year earlier).
- Linear TV viewing fell to ~41 minutes per day over the same period in North America.
- Some countries are showing slower growth in SVOD due to regulation, content rights, or bandwidth constraints.
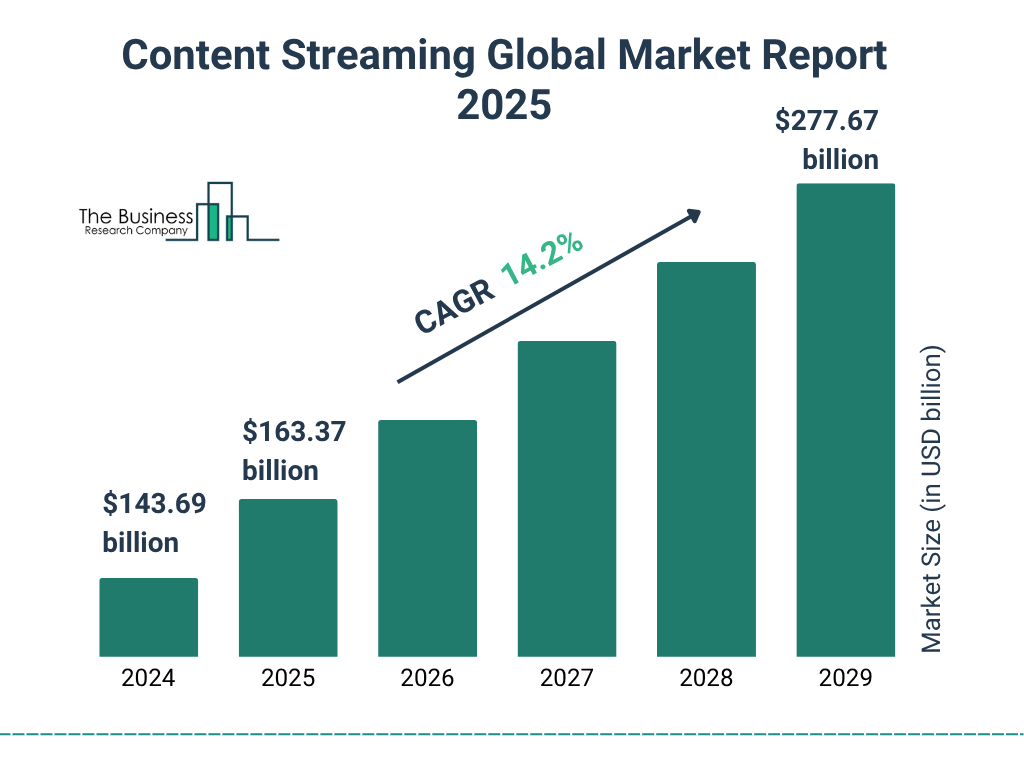
Global Content Streaming Market Size
- It is projected to grow to $163.37 billion in 2025, showing strong short-term momentum.
- By 2029, the market is expected to reach $277.67 billion, nearly doubling in five years.
- The industry is growing at a CAGR of 14.2%, reflecting surging global demand for digital entertainment.
Subscriber Growth and Churn
- Netflix added ~18.9 million new subscribers in Q4 2024, pushing its total to ~301.6 million globally.
- Paramount+ had ~79 million subscribers as of March 2025.
- Churn, 39% of U.S. consumers cancelled at least one paid SVOD service in the past six months.
- Among Gen Z and millennials, churn is above 50% over the same timeframe.
- In Q1 2025, most platforms (Netflix, Prime Video, Disney+) saw increased churn; Hulu was an exception.
- The average number of paid services per U.S. household declined from 4.2 to 4.1 in Q2 2025.
- SVoD and FAST services saw ~3% subscriber decline in the same Q2, while paid ad‑supported (AVoD) grew ~0.2%.
- Pricing and cost are among the top reasons cited for churn, as well as password sharing and dissatisfaction with ad load.
Average Viewing Time and User Engagement
- In North America, VOD engagement in H1 2025 averaged 69 minutes per day, down ~18% from the same period a year earlier.
- Linear TV daily engagement in North America dropped to 41 minutes per day, a ~21% drop year over year.
- Across the U.S., 1/3 of consumers now stream TV for 1‑2 hours per day. Under-30s tend to stream more, with many in that age group reaching 3‑4 hours per day.
- Daily time spent streaming video (TV shows + movies) in the U.S. is about 1 hour 22 minutes, which is ~10 minutes less than the 2022 peak.
- Among subscription OTT platforms, Netflix’s active users are expected to spend over an hour per day in 2025.
- Digital media time overall is ~13h11m per day among Americans, and streaming video accounts for about 3h6m of that.
- User engagement around ad load is increasing; more users report fatigue with ads, and platforms are experimenting with lighter ad loads or better ad relevance.
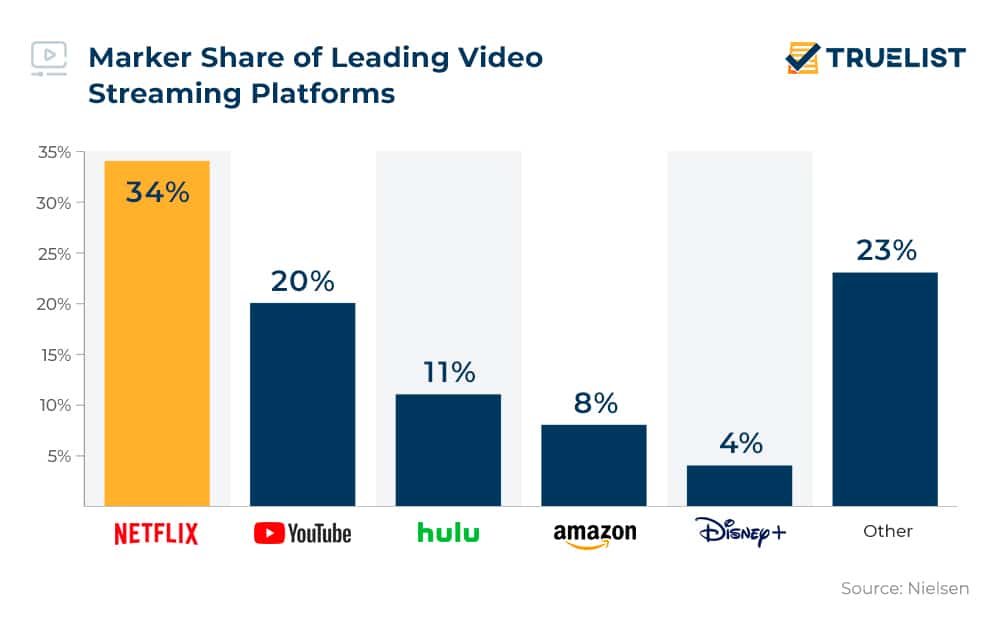
Market Share of Leading Video Streaming Platforms
- Netflix leads the market with a commanding 34% share of total video streaming.
- YouTube follows with a strong 20% share, reflecting its dominance in ad-supported content.
- Hulu captures 11% of the market, driven by its hybrid subscription and ad model.
- Amazon Prime Video holds 8%, boosted by its integration with Prime memberships.
- Disney+ trails with just 4%, despite a globally recognized content library.
- Other platforms combined make up a significant 23%, showing fragmentation beyond the top five.
FAST (Free Ad‑Supported Streaming TV) Services Statistics
- Use of FAST and AVOD services grew by 6 points year‑over‑year in the U.S., reaching about 47% of U.S. households by Q1 2025.
- The Roku Channel reached households with nearly 145 million people by the end of 2024. In May 2025, its streaming hours were up 84% y‑o‑y.
- FAST channels globally numbered ~1,850 by mid‑2025, up ~14% from Q1 and ~76% since 2023.
- Platforms are offering more live/free FAST content, especially news, sports highlights, and classic programming.
- Ad‑supported tiers and FAST are often becoming entry points for new users, especially cost‑sensitive consumers.
- Ad load concerns persist; users expect fewer interruptions than linear TV, more relevance in ads.
- FAST monetization is rising, but ARPU remains far below what SVOD achieves.
- Platform strategies, combining FAST offerings with premium tiers or SVOD to offer hybrid models.
SVOD (Subscription Video On Demand) Adoption
- SVOD accounted for about 58% of the OTT video streaming market in 2024.
- Global SVOD ARPU projected at $78.97 in 2025.
- Number of SVOD users globally estimated at 1.5 billion in 2025, up from ~1.4 billion in 2024.
- Penetration rates, the average number of paid SVOD services per U.S. household, are around 3‑4.
- Churn remains a challenge; a significant portion of users cancel at least one SVOD service in a six‑month period.
- SVOD platforms are adding ad‑supported tiers or hybrid options to retain or win back cost‑conscious users.
- Some services are slowing new original content launches or increasing licensing of library content to reduce cost pressures.
- SVOD growth forecasts to 2030 show steady CAGR but recognize risk from subscription fatigue and competition from AVOD / FAST.
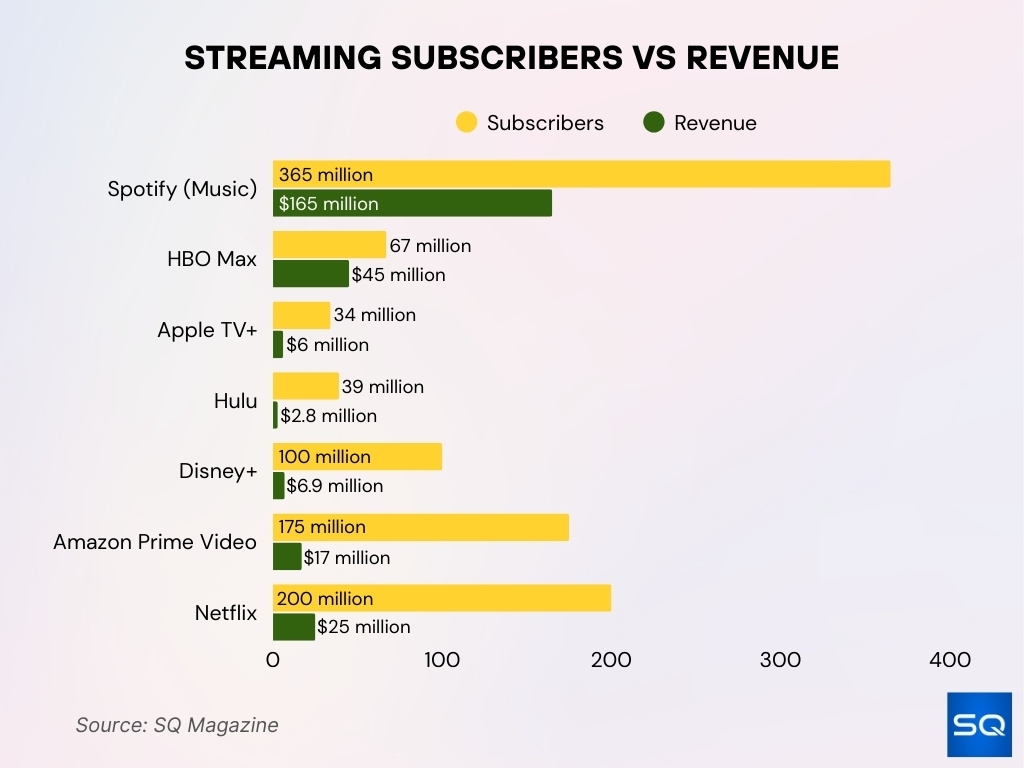
Streaming Subscribers vs Revenue
- Spotify leads with 365 million subscribers and $165 billion in revenue, dominating music streaming.
- Netflix has 200 million subscribers and earns about $25 billion, showing high scale but modest ARPU.
- Amazon Prime Video reports 175 million subscribers with $17 billion in revenue.
- Disney+ attracts 100 million users, generating around $6.9 billion in revenue.
- HBO Max brings in a strong $45 billion from just 67 million subscribers, indicating high ARPU.
- Apple TV+ reaches 34 million subscribers and makes about $6 billion.
- Hulu has 39 million subscribers but earns only $2.8 billion, among the lowest revenues in the group.
AVOD (Ad‑Supported Video On Demand) Usage
- Over half of U.S. viewers regularly watch ad‑supported streaming content.
- AVOD user penetration globally is projected to be 52.8% in 2025, climbing to ~61.0% by 2029.
- In the U.S., new subscribers at Paramount+ in Q1 2025, 60% chose the ad‑supported “Essential” tier.
- The ad‑supported tier on Max now represents nearly half of its domestic subscriber base.
- AVOD / FAST combined ad spend in the U.S. CTV is expected to continue rising.
- AVOD platforms are innovating, with dynamic ad insertion, shorter ad blocks, and better targeting.
- Growth of AVOD is strongest among younger demographics and in cost‑sensitive markets.
- The stability of AVOD revenue is higher than that of pure SVOD in recent quarters.
TVOD (Transactional Video On Demand) Trends
- TVOD is less dominant than SVOD or AVOD but remains relevant for special content.
- Global normal revenue per VOD user is projected at ~$114.60 in 2025.
- TVOD revenues are expected to grow at a modest rate relative to AVOD & FAST.
- Live sports and pay‑per‑view events are increasingly distributed via streaming.
- The convenience of digital delivery supports TVOD for niche or premium titles.
- Some platforms are offering bundles or promos to encourage TVOD usage.
- TVOD markets are more volatile, and demand spikes around blockbuster releases.
Streaming Device and Platform Preferences
- Dedicated streaming devices account for about 15% of streamers’ usage.
- Gaming consoles are used by ~10% of streaming users.
- Other connected devices represent ~5% of streaming device usage.
- Smart TVs and built‑in apps are increasingly the default.
- Mobile phones/tablets remain popular for streaming video on the go.
- Roku’s platform now serves 145 million people in the U.S. by the end of 2024.
- Roku OS powers ~90 million households globally by 2025.
- 57% of viewers begin viewing with an SVOD service over live TV.
Most Popular Content and Genres
- Spanish‑language content on streaming platforms has increased by 73% over five years.
- LATAM content hours consumed have surged ~300% since 2017.
- Anime and non‑English international genres are becoming mainstream among Gen Z.
- Local and regional content gains more view time when subtitled or dubbed effectively.
Live Streaming Growth
- The global live streaming market was valued at around $99.82 billion in 2024 and is projected to reach $345.13 billion by 2030.
- Market revenue may grow from ~$76.5 billion in 2024 to ~$517.65 billion by 2032.
- Live streaming accounts for 27.7% of global video content consumption weekly.
- Viewers spend, on average, 25.4 minutes per session on live stream content.
- ~33% of U.S. internet households now subscribe to at least one direct‑sports streaming service.
International and Multilingual Content Consumption
- Spanish‑language content streaming has increased 73% over the past 5 years.
- LATAM content consumption increased by ~300% in hours watched since 2017.
- Hispanic viewers now spend 55.8% of their total TV time on streaming platforms.
- ~72% of viewers say native‑language content increases their emotional engagement.
- More creators are localizing content with subtitles, dubbing, and metadata.
Price and Subscription Bundling Trends
- 42% of U.S. consumers say they are much more likely to retain bundled streaming services.
- On average, U.S. consumers spend $83/month on TV/streaming services.
- Bundling now represents over a third of all U.S. streaming subscriptions.
- Interest in bundles is especially high among Gen Z and millennials.
- Consumers cite lower cost, content quality, and ad‑free tiers among top motivators.
- Platforms increasingly partner with telecom providers to offer bundled deals.
Frequently Asked Questions (FAQs)
Streaming services captured 44.8% of total U.S. TV usage.
Peacock had 41 million paid subscribers.
The market is projected to reach $865.85 billion by 2034, growing at a CAGR of 20.90%.
It reached 145 million people, and its streaming hours increased by 84% year‑over‑year.
Conclusion
Devices and platforms are evolving, pushing smart TVs, FAST channels, and live streaming into greater dominance. Genre preferences and content language are expanding in diversity, and international content and multilingual offerings are no longer niche but expected. At the same time, cost pressures and subscription fatigue push consumers toward bundling and value deals.
For streaming providers to stay ahead, strategy must balance content richness, device/UX accessibility, and pricing value. For viewers, the path ahead promises more choice, but also more decisions about what’s truly worth paying for.


