Snapchat continues to shape how people across the U.S. and around the globe share moments. The app is a staple for everyone, from everyday users snapping quick updates to brands targeting Gen Z. Whether powering immersive AR-based campaigns or connecting friends through fleeting stories, Snapchat’s reach is unmistakable. The numbers tell the story. Now, let’s unpack the full landscape through stats that reveal its impact.
Editor’s Choice
- Monthly Active Users (MAU) reached an impressive 932 million in Q2 2025, a 7% year-over-year increase.
- Daily Active Users (DAU) climbed to 469 million, a 9% rise year-over-year.
- In Q1 2025, Spotlight drew 550 million MAUs on average, contributing over 40% of total time spent.
- Revenue in Q1 2025 was $1.363 billion, up 14% compared to 2024.
- In Q2, revenue hit $1.345 billion, a 9% increase year-over-year.
- Snapchat+ subscriptions approached 16 million, driving “other revenue” toward nearly $700 million annualized.
- Despite growth, net loss in Q2 2025 was $263 million, slightly wider than the prior year.
Recent Developments
- The company dropped its “Simple Snapchat” redesign after backlash, preserving the familiar five‑tab layout; even minor tweaks could cost user trust.
- Snapchat+ subscriptions soared 59% in Q1, hitting 15 million subscribers.
- Snap also decided to withhold its Q2 financial forecast, citing macroeconomic uncertainty and tariff-related pressures on ad budgets.
- In Q2, a technical glitch in its ad platform caused unusually low auction prices, slowing revenue growth. This marked the slowest increase in over a year.
- Regional trends diverged, while North American DAU slipped from 100 million to 99 million, growth in the rest of the world offset the loss.
Daily & Monthly Active Users
- Q2 2025 MAU stood at 932 million, up 7% YoY, and DAU at 469 million, up 9% YoY.
- Q1 2025 figures recorded MAU passing 900 million, DAU at 460 million.
- In Q1, DAU grew by 38 million compared to the prior year.
- DAU increased from 414 million at end‑2023 to 460 million in early 2025.
- Spotlight, Snapchat’s video feed, averaged 550 million MAUs in Q2 and accounted for 40%+ of content time.
Tab Usage Statistics
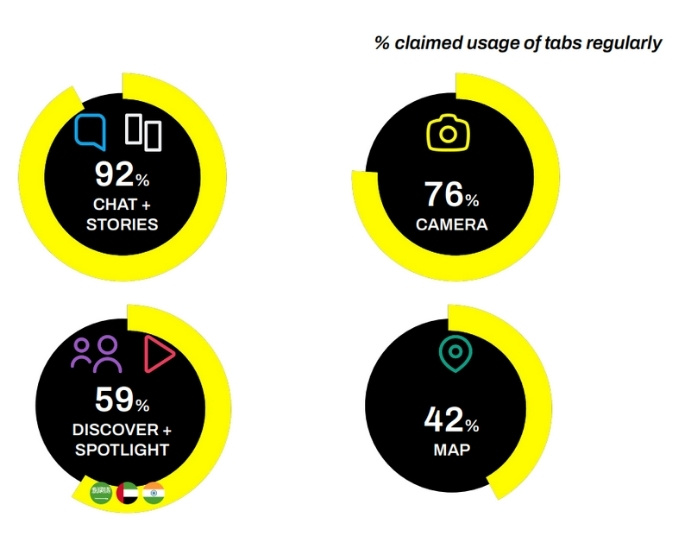
- 92% of users regularly engage with Chat + Stories, making it the most-used feature on Snapchat.
- The Camera tab follows closely, with 76% of users accessing it regularly.
- 59% of users use Discover + Spotlight, showing strong engagement with content discovery and creator videos.
- The Map feature is the least-used but still notable, with 42% of users accessing it regularly.
Global User Base
- India leads the pack with around 202 million users, followed by the U.S. at 106–107 million.
- By mid‑2025, MAU sits at 932 million globally, with DAU at 469 million.
- Growth in “Rest-of-World” users offset slight declines in North America.
- Snapchat ranks among the top social platforms with its global MAU of around 900 million, trailing giants like Facebook and TikTok.
Regional & Country Statistics
- India: 202 million users.
- United States: 106–107 million users.
- Other notable markets: Pakistan (32 million), France (27 million), UK (23 million).
- North American DAU fell to 99 million, from 100 million a year earlier.
- Significant growth observed in “rest‑of‑world” DAU, offsetting the regional dip.
Age & Gender Distribution
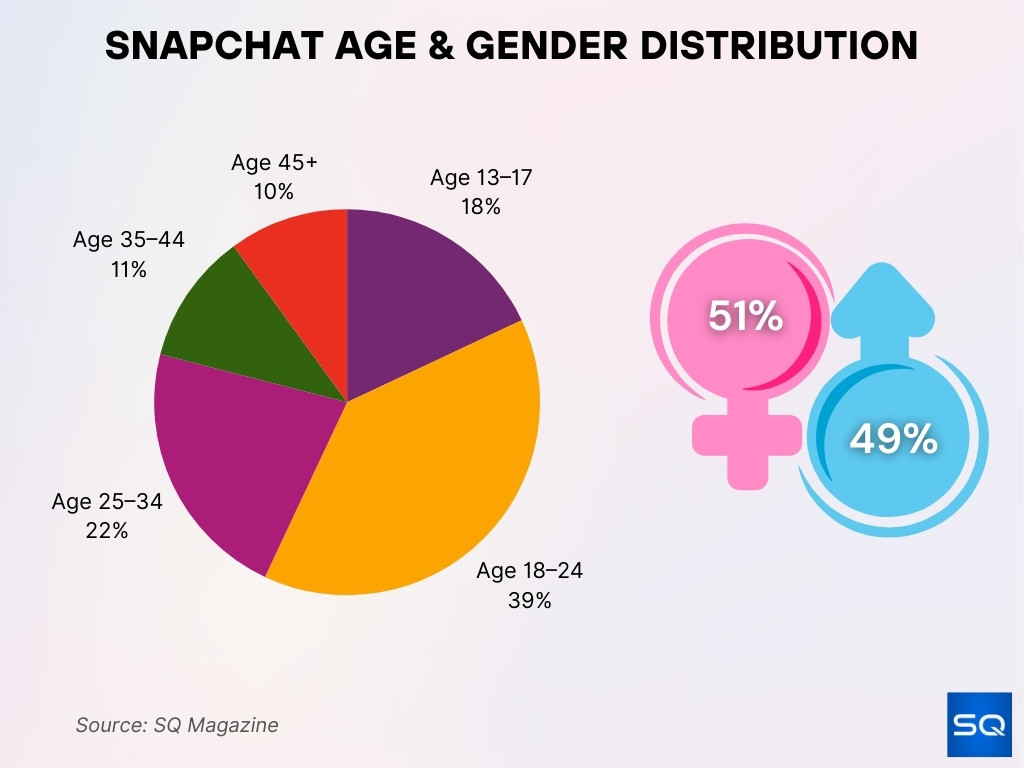
- Users aged 13–17 make up around 18% of the platform’s base.
- The 18–24 segment leads with roughly 39% of the global audience.
- Users aged 25–34 account for approximately 22%, while 35–44 year-olds make up 11%.
- Older age groups (45+) comprise 10% of Snapchat’s user base.
- Gender distribution remains close to even, with 51% female and 49% male users.
- In the U.S., female usage is slightly higher, especially in Gen Z and millennial groups.
- Male engagement on Spotlight and AR features tends to outpace female users in duration.
- Female users are more likely to engage with branded AR Lenses and fashion-focused content.
- Usage among teens is declining slightly in Western countries, offset by growth in developing regions.
Time Spent on App
- The average daily time spent on Snapchat is 32 minutes per user.
- Spotlight view time grew 175% year-over-year.
- Users under 24 spend up to 45 minutes daily on the app.
- Snapchat Stories drive over 40% of daily content consumption.
- U.S. teens check the app more than 30 times per day.
- Peak engagement occurs between 8 p.m. and 11 p.m., especially on weekends.
- Messaging remains the top feature, with over 4 billion snaps sent daily.
- AR Lenses engage users for an average of 10 seconds per interaction.
Engagement Metrics
- Snapchat has a 69% retention rate for new users after 30 days.
- Daily time spent per user is over 30 minutes, particularly high among Gen Z.
- Chat messages account for 60% of interactions on the platform.
- Snapchat sees over 4 billion messages exchanged per day.
- DAUs open the app 25–30 times a day on average.
- Engagement is higher on weekends, particularly between evening and late night.
- Lenses drive up to 10 seconds of average engagement per use, outperforming traditional mobile ads.
- Over 70% of daily users use the camera feature at least once a day.
- Stories receive less time spent, but maintain high completion rates among close friends.
Video & Snap Creation Stats
- Snapchat users create 5+ billion snaps daily.
- Spotlight generates over 400 million videos per day.
- Over 70% of snaps include AR Lenses or filters.
- Over 60% of videos are shot vertically and are under 60 seconds.
- More than 65% of U.S. teens share video stories daily.
- Videos in Spotlight have a 2x higher completion rate than other platforms.
- Engagement with video Lenses is 4.5× longer than with static filters.
- Snapchat stories are now predominantly video, making up 90% of content.
- Snaps with music tracks see 30% higher engagement than silent ones.
Contribution to Media Mix
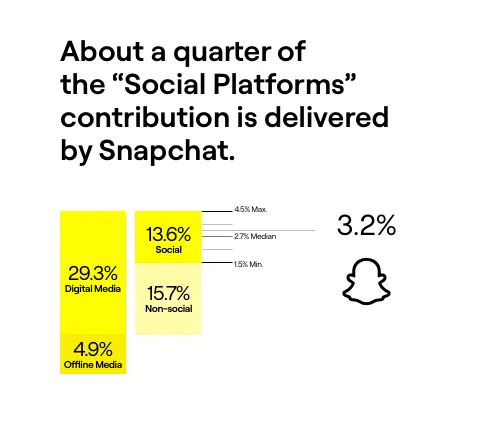
- Digital Media accounts for the largest share at 29.3%, highlighting its dominance in overall media contribution.
- Offline Media represents only 4.9%, showing its limited role compared to digital channels.
- Social Media platforms contribute 13.6%, with Snapchat responsible for about a quarter of that share.
- Non-social media channels make up 15.7% of the mix.
- Snapchat alone delivers 3.2% of the total media contribution, underscoring its strong position among social platforms.
Discovery & Stories Metrics
- Stories contribute to 40%+ of total content consumption on the app.
- Public Stories are viewed 2.3 billion times per day.
- The Discover tab reaches over 300 million users monthly.
- More than 60% of users consume content from creators they don’t follow.
- Stories under 15 seconds see 80%+ completion rates.
- Creator Stories lead to 3× longer user sessions.
- More than 35% of Snapchat users engage with News and Entertainment channels.
- The U.S. sees the highest Discover engagement among 18–24s.
- Stories are shared more on weekends and during national events.
Features Statistics
- Over 60% of users use Snapchat’s camera daily.
- Bitmoji avatars are used in over 70% of chats and stories.
- Snap Map is accessed by 250 million users monthly.
- Snap Originals draw over 100 million viewers per quarter.
- Cameos are used in 25% of chats among Gen Z users.
- AI features like Dreams (generative selfie filters) launched in late 2024 and gained 15 million users in 3 months.
- Voice filters and Scan (visual search) continue to grow among tech-savvy audiences.
- Snap Games were sunsetted in 2024, but users continue sharing game content via Stories.
- Over 200,000 public Lenses are live at any given time.
Augmented Reality (AR) Statistics
- Over 300 million daily active users engage with Snapchat’s AR every day, making it a routine for two-thirds of DAUs.
- Snapchat’s AR campaigns deliver up to 2.4× ad awareness lift, 1.8× brand awareness, and 1.4× brand association compared to non-AR formats.
- Lens AR achieves 6.4× higher swipe-to-purchase ratios than traditional commercials.
- Attention retention is powerful; 80% of users interact with Snap lenses for at least two seconds, while under 10% stay engaged with other ad formats beyond two seconds.
- By 2025, around 60% of the U.S. population, and virtually all social app users, will be frequent AR users.
- AR and VR markets, including Snapchat lenses, are projected to reach $46.6 billion globally in 2025.
- AR image try-on tools reduce product returns by 24%, with over 50 million fit recommendations delivered.
- Snapchat Lens+ tier (creator-focused AR tools) was introduced to expand creator capabilities.
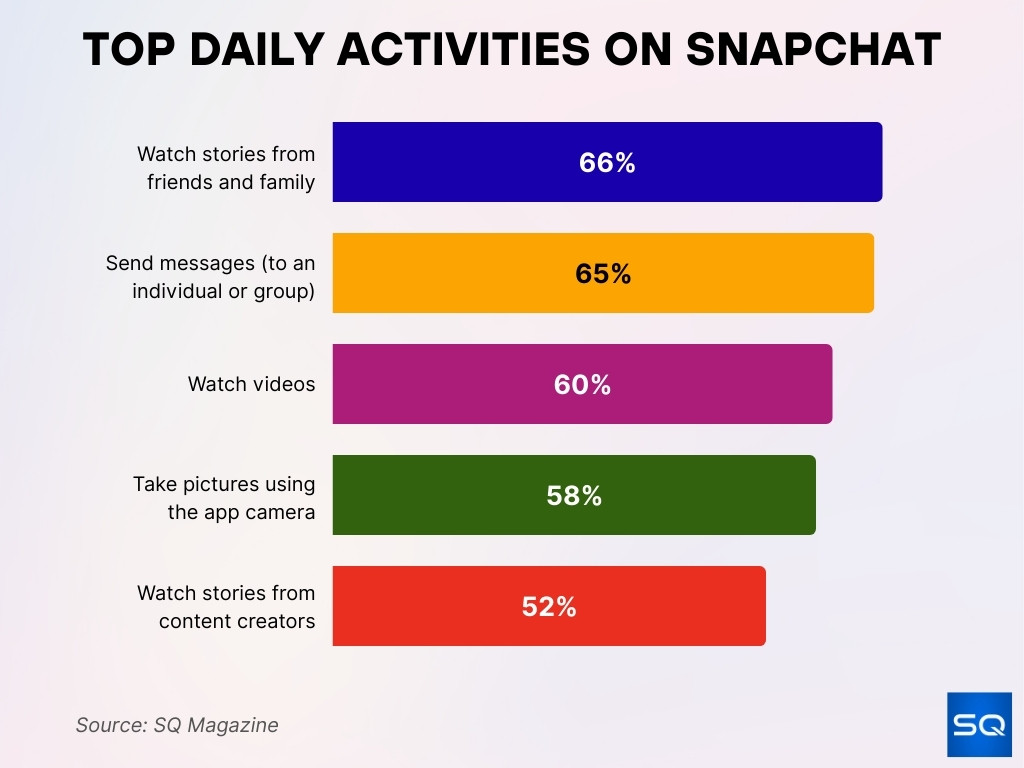
Top Daily Activities on Snapchat
- 66% of users watch stories from friends and family, making it the most common daily activity.
- 65% send messages to individuals or groups, showing Snapchat’s strong role in direct communication.
- 60% watch videos on the platform every day.
- 58% take pictures using the app camera, reinforcing Snapchat’s visual-first nature.
- 52% watch stories from content creators, highlighting engagement beyond personal connections.
Creator & Influencer Statistics
- Snapchat reports 15 billion creator–fan interactions daily, a massive engagement engine.
- The Lens ecosystem boasts over 250,000 creators who have designed 2.5 million Lenses cumulatively.
- Spotlight’s MAUs surpassed 500 million, with time spent up 175% year‑over‑year.
- Interaction-rich formats like AR Lenses drive ad awareness and user recall significantly higher than static ads.
- Snapchat rolled out Sponsored Snaps, a new video ad format in inboxes, designed to boost engagement for creators and advertisers.
Revenue & Financial Performance
- Q2 2025 revenue climbed to $1.345 billion, reflecting a 9% year-over-year increase.
- For the quarter ending March 31, revenue was $1.363 billion, a 14.1% YoY boost.
- Trailing twelve‑month revenue reached $5.53 billion, up 14.9% from the previous year.
- Q2 net loss widened to $263 million, up from $249 million the prior year.
- Adjusted EBITDA dropped to $41 million, down from $55 million year-over-year.
- Operating cash flow turned positive at $88 million, reversing a prior-year outflow of –$21 million.
- Free cash flow rose to $24 million, from –$73 million a year earlier.
- Q1 2025 revenue grew 14% YoY to $1.36 billion, beating expectations, driven by direct-response ads and Snapchat+ growth.
- Snap withheld Q2 guidance, citing economic uncertainty, and initiated cost-cutting, adjusted operating expenses forecast trimmed to $2.65–2.70 billion.
- Despite revenue gains, shares tumbled 16% after this guidance delay and cost strategy shift.
Advertising Statistics
- Snapchat maintains an ad audience of 709 million users, with swipe-up rates up to 5× higher than other platforms.
- Core advertising revenue grew only 4%, displaying a slowdown vs. overall revenue, influenced by macroeconomic and auction platform issues.
- A glitch in the ad platform (Q2) led to discounted ad delivery, slowing revenue growth to 8.7% and disappointing the market.
- Increasing competition, especially from AI-targeted offerings on TikTok and Meta, pressured ad adoption rates.
- Guggenheim downgraded Snap, saying rising investments may postpone profitability amid slack ad growth.
- Morgan Stanley stressed the need for Snap to prove ad effectiveness to regain advertiser confidence.
- Brands are leveraging AR Lenses, delivering significantly higher brand and purchase engagement than traditional formats.
- Sponsored Snaps, placed in inboxes, debuted globally to deepen ad engagement and attract advertiser interest.
Purchase & Shopping Statistics
- AR-based “Image Try-On” features created 50+ million fit recommendations, reducing return rates by 24%.
- Lens AR shows 6.4× better swipe-to-purchase conversion than traditional ads.
- While precise purchase numbers are limited, AR’s performance metrics underscore its value in e-commerce engagement and conversion.
Marketing Trends
- AR continues to elevate brand interaction, and AR campaigns outperform non-AR formats across awareness and brand lift metrics.
- Creator–audience interactions have surged, with 15 billion daily exchanges, a rich field for micro-influencer strategies.
- Spotlight’s growth (500M MAUs, +175% time spent) signals that discovery and UGC formats are central to user engagement.
- Subscription growth via Snapchat+ broadens revenue beyond ads, a key strategy for resiliency.
- AR wearables (Spectacles, Lens+) are being positioned as futuristic marketing channels, next-gen glasses to launch in 2026.
- As other platforms lean into AI, Snap needs to expand ad targeting and measurement to stay competitive.
- Market watchers expect ad performance insights and ROI clarity to be the next battleground in ad spend distribution.
Conclusion
Today’s Snapchat statistics reveal sustained user growth and a deepening immersion in AR experiences. With 932 million MAUs and 469 million DAUs, the platform keeps its global relevance. AR tools not only enhance user engagement with 300 million daily users but also deliver strong ad and purchase metrics, from 2.4× awareness lift to 6.4× swipe-to-purchase ratios. Financially, revenue is rising (Q2: $1.345 billion, LTM: $5.53 billion), but profitability remains elusive amid challenges in ad performance and competition. Still, innovations like Snapchat+, AR advancements, and creative formats like Spotlight and Sponsored Snaps position the platform to evolve beyond traditional advertising.
As Snapchat moves forward, brands and creators alike should keep watch on its AR-driven strategies, new monetization tools, and the ability to demonstrate ad ROI.


