In the evolving landscape of blockchain technology, the debate between Proof of Work (PoW) and Proof of Stake (PoS) remains central. These consensus mechanisms power the secure, decentralized validation of transactions in cryptocurrencies, and their differences shape everything from energy use to scalability. In industry scenarios, such as institutional asset tokenization, where sustainability matters, or mining‑dependent networks evaluating cost structures, the choice of mechanism has real financial and environmental implications. Explore further to understand how key statistics for these models compare.
Editor’s Choice
- In mid‑2025, PoS networks are projected to dominate the landscape, with over 60% of major blockchains expected to use PoS or variants by year’s end.
- The transition of Ethereum to PoS reduced its energy consumption by over 99% compared with its previous PoW model.
- A leading report notes the annual energy consumption of global PoW systems at roughly 97,100 GWh, while comparable PoS systems may use around 500 GWh.
- In Q2 2025, Ethereum validators achieved an average risk‑adjusted reward rate of about 3.15% APY, with no major slashing events reported in one operator’s set.
- Approximately 29% of Ethereum’s total supply was staked by Q2 2025, indicating strong participation in the PoS mechanism.
- Industry research finds that to attack a PoW network via 51% control, one needs to dominate computing power, whereas in PoS, one needs control of 51% of staked tokens, making the cost structures quite different.
Recent Developments
- The Ethereum Merge (2022) reduced energy consumption by over 99.95%, setting a new benchmark for PoS efficiency.
- In 2025, over 60% of blockchains are projected to adopt PoS or hybrid consensus models to improve sustainability.
- PoW energy consumption remains high, with Bitcoin mining using about 170 TWh annually, comparable to a medium-sized country.
- PoS networks consume about 500 GWh annually, less than 1% of typical PoW blockchain energy use.
- Hybrid consensus models combining PoW and PoS gain traction for balancing security and efficiency in 2025.
- Enterprise blockchain deployments favored PoS for cost and energy savings, with adoption rising by 15% year-over-year.
- Regulatory scrutiny of PoW mining has increased, with at least 10 countries imposing stricter energy reporting and carbon regulations in 2025.
- PoS blockchains lead innovation in DeFi and NFTs, supporting transaction speeds of around 12 seconds per block, up 7% from pre-Merge times.
- Approximately 29% of Ethereum’s total supply is staked as of 2025, indicating strong validator participation in PoS.
- PoW still offers stronger decentralization guarantees but trails PoS in scalability and environmental impact by a margin of over 99% in energy savings.
Adoption and Market Share Statistics
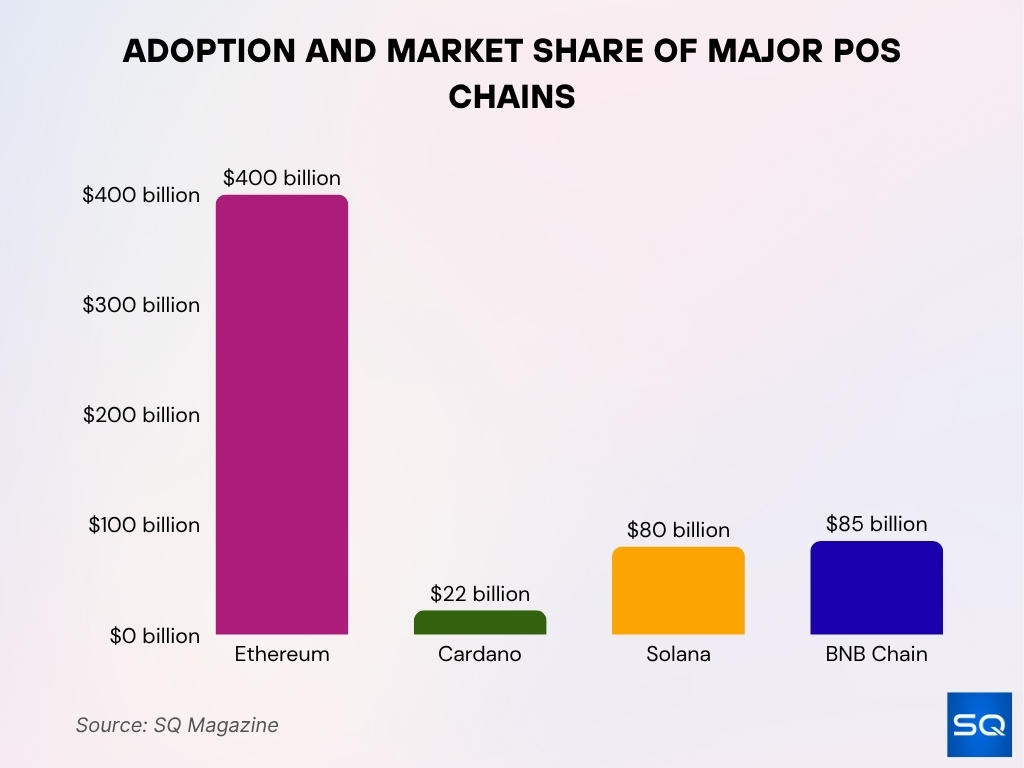
- Ethereum (PoS) holds a $400 billion market cap, leading the smart contract ecosystem.
- Cardano (PoS) has a $22 billion market cap with strong traction in emerging markets.
- Solana (PoS + PoH) records a $80 billion market cap, driven by NFTs, DeFi, and high TPS.
- BNB Chain (PoS‑based) maintains an $85 billion market cap fueled by the Binance ecosystem.

Proof of Work vs. Proof of Stake: Pros and Cons
- PoW networks consume about 170 TWh of energy annually, contributing to high operational costs.
- PoS blockchains reduce energy use by over 99% compared to PoW systems.
- PoW mining pools control up to 70% of Bitcoin’s network hash rate, raising centralization concerns.
- PoS staking participation reaches approximately 29% of Ethereum’s total supply in 2025.
- PoS validators achieve 99.9% uptime, reflecting strong network reliability.
- PoW transaction throughput is limited to around 7 transactions per second, whereas PoS networks can exceed 65 TPS.
- PoS systems offer staking yields averaging 3.15% APY on major platforms like Ethereum.
- PoW hardware investment costs have risen to over $10 billion annually globally.
- PoS risks include stake concentration, where the top 5% of validators control over 70% of staking power.
- PoW’s slower scaling is contrasted by PoS’s ability to reduce block times by up to 30%, improving speed and efficiency.
Energy Consumption Comparison
- PoW networks are estimated to consume about 97,100 GWh annually in total across major systems, versus roughly 500 GWh for comparable PoS systems.
- One study estimates that a PoW network like Bitcoin uses more than 99% more energy per transaction compared to leading PoS networks.
- Data for PoW, some estimates place Bitcoin’s annual consumption in the range of 97 TWh to 323 TWh as of 2024.
- PoW energy per transaction, for example, Bitcoin was estimated to use around 707.6 kWh per transaction in a recent report.
- PoS energy per transaction, some innovative models report usage as low as 0.000008 kWh, reflecting dramatic reductions.
- Ethereum’s shift to PoS resulted in an energy reduction of approximately 99.95% compared to its prior PoW model.
- The energy‑efficiency gain makes PoS appealing for jurisdictions and enterprises facing sustainability mandates.
- Reducing energy consumption via PoS supports broader adoption in enterprise contexts and helps mitigate regulatory risk tied to carbon footprints.
Ethereum Staking Landscape
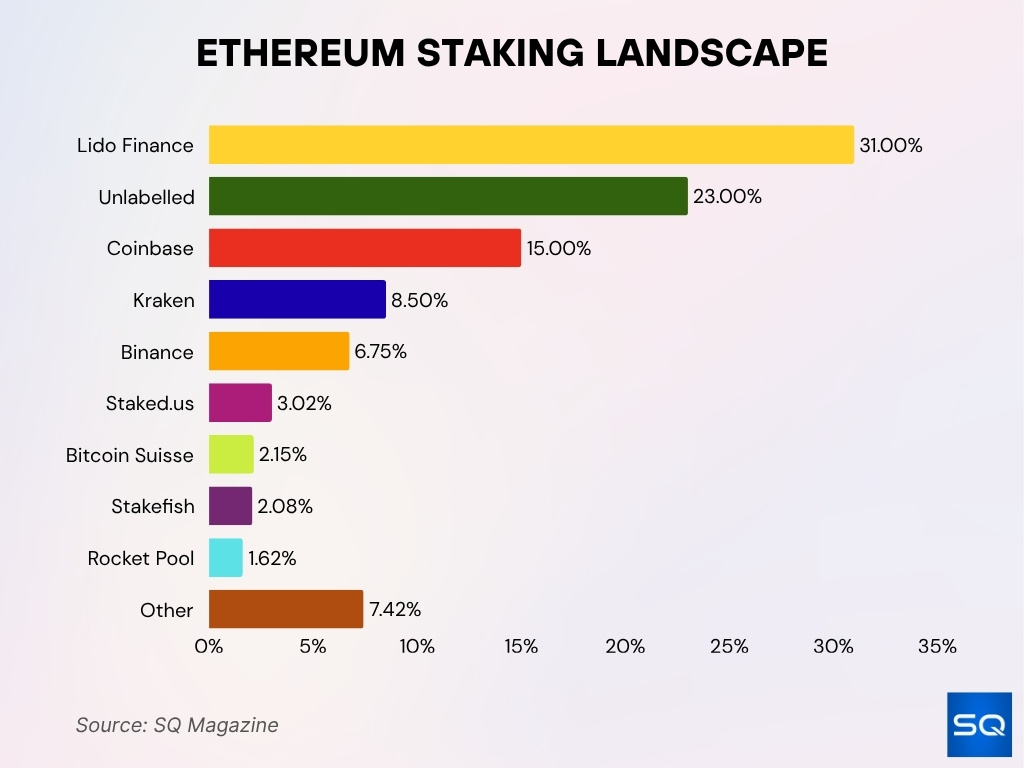
- A total of 13.4M ETH is currently staked in Ethereum’s Proof-of-Stake network.
- Lido Finance leads with 31% of all staked ETH, remaining the largest single staking provider.
- Unlabelled stakers make up 23%, pointing to a substantial amount of unidentified participation.
- Coinbase contributes 15%, placing it among the top centralized staking platforms.
- Kraken holds 8.5% of total staked ETH, maintaining a notable share.
- Binance accounts for 6.75%, supported by its global exchange footprint.
- Staked.us represents 3.02%, reflecting ongoing institutional involvement.
- Bitcoin Suisse manages 2.15%, showing participation from Swiss institutional players.
- Stakefish contributes 2.08% to the staking pool.
- Rocket Pool holds 1.62%, offering decentralized access to staking.
- Other validators collectively make up the remaining 7.42%, illustrating a long-tail distribution.

Transaction Speed and Scalability Statistics
- The network of Bitcoin processes roughly 5 transactions per second (TPS) under its PoW mechanism, illustrating significant throughput limitations.
- On Ethereum post‑Merge (PoS), the block time averages about 12 seconds, enabling higher transaction counts per day compared with its legacy PoW state.
- In a March 2025 estimate, Ethereum’s maximum theoretical throughput was around 142 TPS, although real‑world averages remain lower due to contract complexity and gas limits.
- Some PoS networks, such as Solana, claim throughputs in excess of 1,000 TPS, leveraging PoS mechanisms plus additional optimizations (e.g., Proof of History).
- An event study of Ethereum’s Merge found that transactions per day increased by around 7% post‑Merge, indicating modest gains in throughput with PoS.
Security Metrics
- The PoS model adopted by Ethereum after “The Merge” reports validator participation rates around 99.7%–99.9%, indicative of robust uptime and network health.
- In PoW systems like Bitcoin, security derives from the need to control over 51% of total hashrate to succeed in an attack, making the majority computational control extremely costly.
- In PoS, the analogous attack requires hypothetically controlling 51% of staked tokens, shifting the cost structure from compute‑hardware to capital ownership.
- Overall, while PoW emphasizes security through hardware cost, PoS emphasizes security through stake risk, reflecting distinct security trade‑offs.
Network Decentralization Statistics
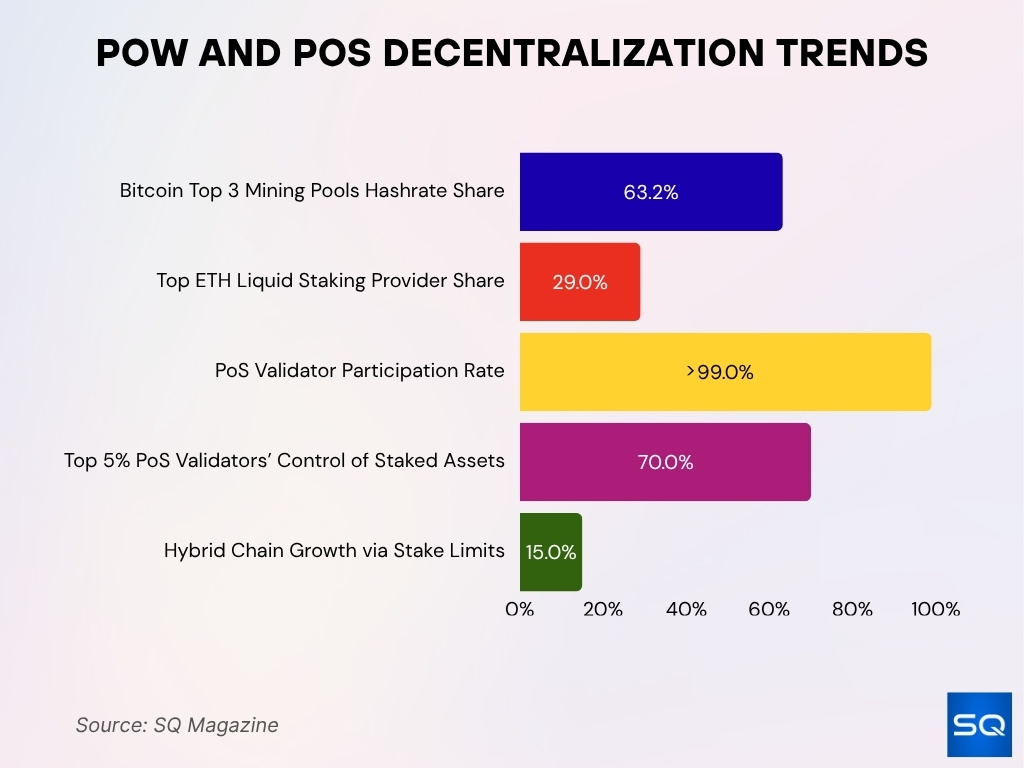
- Bitcoin’s top three mining pools control 63.2% of the total network hashrate in 2025.
- The largest Ethereum liquid staking provider controls over 29% of total staked ETH.
- Validator participation rate in major PoS networks exceeds 99%, suggesting high uptime.
- The top 5% of PoS validators control approximately 70% of staked assets, indicating stake centralization.
- Hybrid chains limiting per-validator stakes have seen up to 15% growth in 2025 as decentralization efforts.

- Ethereum’s Nakamoto coefficient is around 2, indicating validator concentration risks in PoS.
- Polkadot shows a Nakamoto coefficient of 149, reflecting high decentralization for a PoS chain.
- Over 1 million active Ethereum validators exist as of mid-2025, showing broad network involvement.
Rewards Distribution Statistics
- On Ethereum PoS, consensus layer rewards accounted for about 89% of staking payouts, while the execution layer (including MEV‑related rewards) comprised approximately 11% in early 2025.
- The average validator on Ethereum earned around 0.00206 ETH per day from consensus layer rewards in Q2 2025.
- PoW block rewards for Bitcoin as of 2025 remain at 6.25 BTC per block, excluding transaction fee variations and pending any halving event.
- Cloud‑mining analysis shows Bitcoin miners may receive around $20 million worth of Bitcoin per day, representing aggregate miner rewards before cost deductions.
- In PoS systems, staking rewards also function as token inflation; for Ethereum, the annual issuance rate post‑Merge is estimated near 0.35%.
- Liquid staking platforms’ total value locked (TVL) for ETH exceeded $25 billion, showing large-scale reward distribution via pooled staking services.
- Historical study found that in PoW systems, reward share tends to further favour larger hashrate contributors, reducing fairness over time.
Consensus Participation Rates
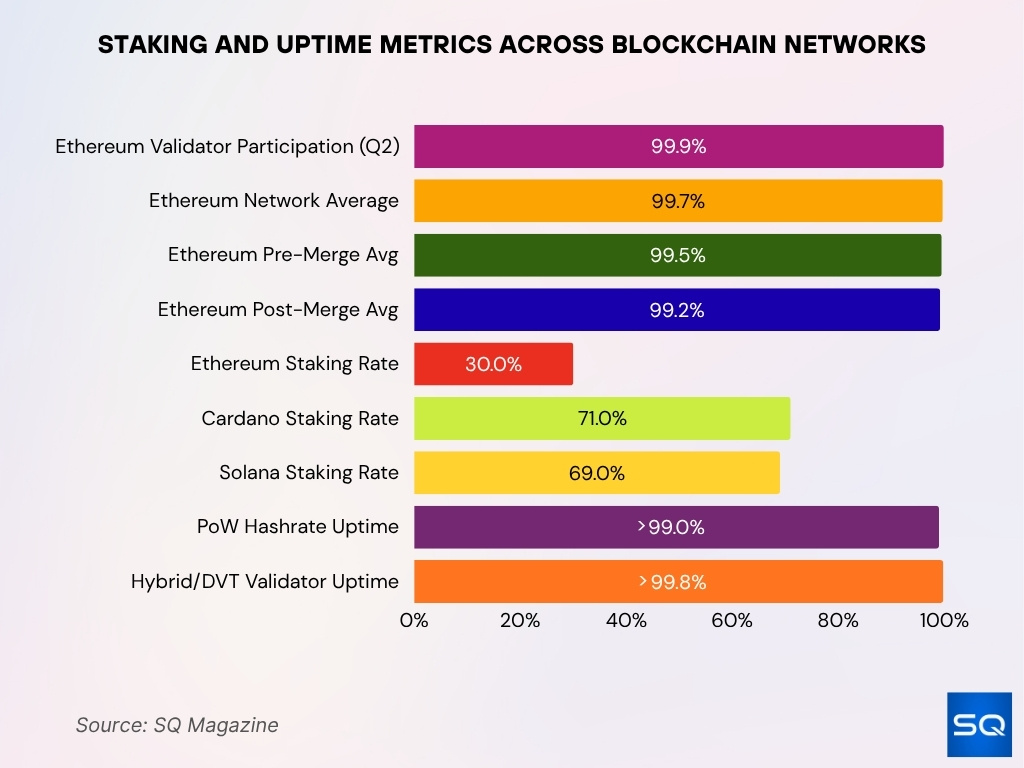
- In Q2 2025, Ethereum validators achieved a participation rate of 99.9%, slightly above the network average of 99.7%.
- A study reported Ethereum’s mean participation rate dropped from 99.5% pre-Merge to 99.2% post-Merge (SD 0.20%).
- Ethereum’s staking participation reached roughly 30% of the total supply by mid-2025.
- Cardano (ADA) staking participation is estimated at 71% of the circulating supply in 2025.
- Solana (SOL) has about 69% of tokens staked in 2025.
- Ethereum’s validator count exceeded 1 million active validators by mid-2025.
- PoW chains show network hash-rate uptime above 99%, though participation metrics differ from PoS.
- Hybrid and DVT networks report validator uptime above 99.8% due to redundancy layers.

Efficiency and Cost Analysis
- Ethereum’s shift from PoW to PoS reduced energy use by over 99.95%, lowering validator operating costs.
- PoW mining hardware costs fell to about $16 per terahash in 2025, down from $80/T in 2022.
- Entry-level staking yields on major PoS chains ranged from 3%–11.5%, depending on risk and liquidity.
- One estimate showed PoS using roughly 35 Wh per transaction vs PoW’s 84 kWh, significantly cutting costs.
- Staking locks supply and improves token-economic efficiency by reducing circulating assets.
Validator and Miner Distribution
- Ethereum PoS validators earned an average reward of ~3.15% APY in Q2 2025 with strong uptime.
- Approximately 29% of Ethereum’s total supply was staked by mid-2025.
- Ethereum validators achieved a 99.9% participation rate in Q2 2025, above the network average.
- Distributed Validator Technology nodes secured over $975 million in ETH across 300+ operators.
- Cloud mining cost per terahash dropped to around $16/T in 2025, lowering miner entry barriers.
- The typical Ethereum unstaking period is about 27 hours (4 epochs) for validator exits.
- Ethereum has over 1 million active validators as of mid-2025, enhancing decentralization.
- Liquid staking platforms hold about 31.1% of all staked ETH in early 2025.
- Major mining pools continue to control large percentages of hashrate, with top pools controlling over 60% globally.
- Mining hardware investments climbed to around $10 billion annually due to rising competition and costs.
Attack and Failure Rates
- Over $2.17 billion in crypto assets were stolen as of June 2025, already surpassing the total 2024 thefts.
- Mining-pool concentration persists on smaller PoW chains, with 7 miners controlling 68.8% of hash rate in one study.
- A simulation shows that PoS systems with over 40% staking control face sharply increasing risks of 20-block malicious reorgs.
- A $6 billion cost estimate was cited for a 7-day 51% attack on Bitcoin at Oct 2025 valuations.
- Smaller chains show annual downtime rates above 5%, especially niche PoW networks.
Regulatory and Compliance Statistics
- Over 130 countries are exploring or implementing CBDCs in 2025, increasing regulatory focus on blockchain consensus and networks.
- The global blockchain market is projected to reach $39.7 billion by 2025, with consensus design cited as a key sustainability factor.
- ESG scrutiny of PoW has intensified, with 48% of Bitcoin mining electricity in 2025 estimated to come from fossil fuels.
- Nearly 90% of businesses have deployed or plan to deploy blockchain by 2025, pushing compliance and audit needs to align with consensus mechanisms.
Future Trends and Projections
- By 2025, over 60% of new blockchains are expected to adopt PoS or its variants.
- Hybrid consensus models combining PoW and PoS saw a growth rate of 25% in adoption during 2025.
- DeFi total value locked (TVL) surpassed $123.6 billion globally in Q2 2025, with tokenized real-world assets driving demand.
- New validator selection algorithms have improved decentralization metrics by an average of 51% to 132%.
- Cross-chain interoperability protocols account for 57% of blockchain revenue in 2025, boosting multi-chain interactions.
- Enterprise blockchains with audit-friendly features grew by 18% in 2025, emphasizing transparency and uptime.
- PoW security budgets declined by over 15% in 2025, raising concerns about network attack resistance.
- Staking participation across major PoS networks is expected to increase by approximately 30% in 2025.
- Integration of AI and IoT in blockchain consensus models is projected to grow at a CAGR of 22% through 2026.
- Consensus mechanism choice is becoming a key competitive factor, with 80% of new projects prioritizing ESG compliance and regulatory readiness.
Frequently Asked Questions (FAQs)
PoS consumes over 99% less energy than equivalent PoW networks.
Approximately 97,100 GWh per year for large PoW systems
As low as 35 Wh per transaction in leading PoS systems.
One PoS network averaged around 1,133 transactions per second (TPS) in real-world usage.
Conclusion
The comparison between PoW and PoS is no longer a simple question of which one is “better,” but rather which model best fits a network’s purpose under today’s demands for efficiency, scalability, and regulatory alignment. Attack and failure rates remain extremely low across major networks, yet the overall risk landscape continues to evolve. High participation rates in PoS consensus serve as a key indicator of reliability, an increasingly important factor for enterprises and institutions evaluating blockchain infrastructure.
At the same time, regulatory and compliance pressures are pushing consensus-mechanism choices out of purely technical discussions and into executive-level decision-making. Looking forward, the momentum toward PoS and hybrid consensus models is unmistakable, fueled by the rise of real-world asset tokenisation and growing interoperability needs. For builders, investors, and regulators alike, monitoring consensus-layer statistics has become essential to understanding how blockchain ecosystems are positioned for the future.


