E-commerce continues to reshape how consumers and businesses interact. With $6.8 trillion in global e‑commerce sales and 2.77 billion online shoppers, it’s clear that digital retail is driving major economic shifts.
Two real‑world applications illustrate this shift vividly:
- U.S. retailers increasingly prioritize mobile‑first experiences, with over 76% of American adults shopping via smartphones, underlining the importance of seamless mobile checkout flow.
- India’s quick commerce segment accounted for approximately 60–65% of total e-grocery orders in metro areas.
Read on to explore detailed, data‑rich insights across global and regional e‑commerce trends, and discover what’s shaping the future of online platforms.
Editor’s Choice
- $6.8 trillion in global e‑commerce sales projected for 2025.
- 2.77 billion people are shopping online worldwide this year.
- Online purchases account for 21% of all retail sales, expected to reach 22.6% by 2027.
- As of 2025, there are estimated to be over 28 million e-commerce websites globally, including platforms, independent sellers, and marketplaces.
- 59% of total e‑commerce sales, an estimated $4.01 trillion, will come from mobile commerce.
- 76% of U.S. adults shop with their smartphones.
- Quick commerce in India captured two‑thirds of e‑grocery orders in 2024.
Recent Developments
- Growth in global e‑commerce is moderating in 2025, largely due to economic slowdown in China and trade stress in North America, but recovery is expected in 2026.
- The quick commerce model, ultrafast delivery, is booming in India, with market size jumping to $6–7 billion in 2024, and projected 40% annual growth through 2030.
- Video-based social commerce, particularly on platforms like TikTok Shop, Instagram Shopping, and YouTube Live, is growing at an estimated 30% CAGR globally.
- In Southeast Asia, live-stream commerce now drives up to 60% of sales in specific categories such as beauty and fashion, particularly in markets like Thailand and Indonesia.
Number of E-commerce Platforms Worldwide
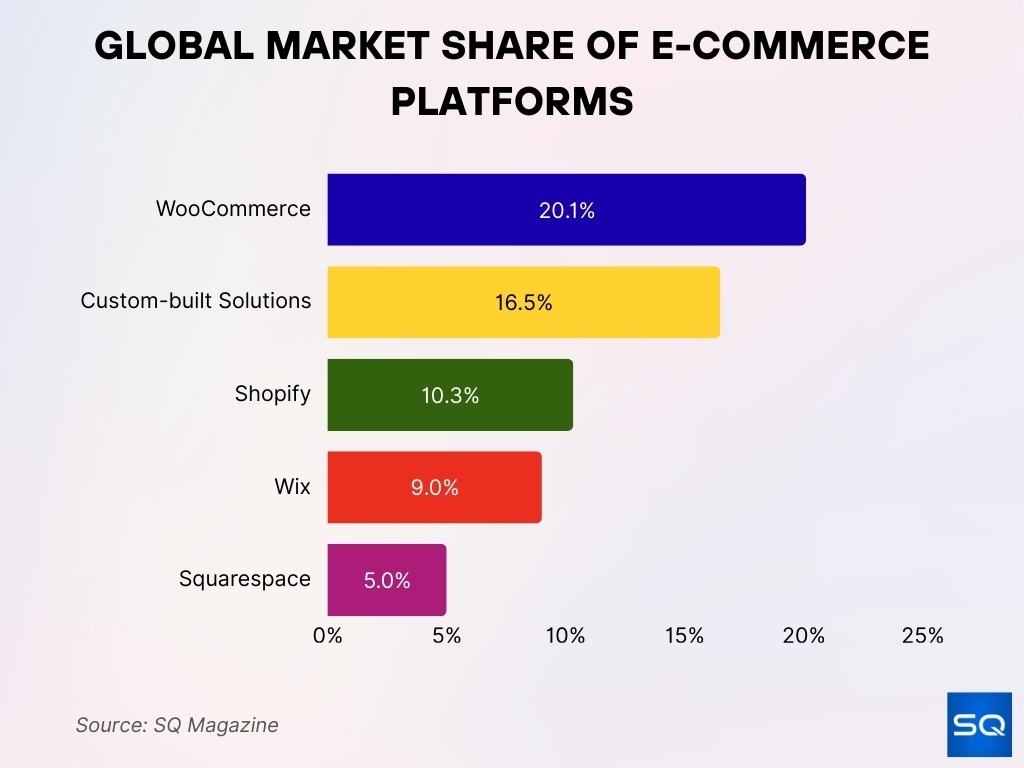
- WooCommerce dominates with 20.1% of platform market share, followed by custom-built solutions (16.5%), Shopify (10.32%), Wix (9%), and Squarespace (5%).
- There are now over 28 million online stores globally, meaning nearly 2,162 new stores launched daily between 2024 and 2025.
- 49.1%, over 13 million, of those stores are based in the U.S..
- 603 e‑commerce platforms power more than 4.9 million e‑commerce businesses worldwide.
- Shopify serves 4.6–4.63 million active websites globally.
- In the U.S., Shopify holds 29% of the e‑commerce platform share, far ahead of its global share.
- Shopify commands a 23% share among the top 1 million websites, highlighting its use by high‑traffic merchants.
- Among the top 100,000 websites worldwide, Shopify leads WooCommerce with a 19% share.
Global E-commerce Market Size Statistics
- Global e‑commerce sales will hit $6.8 trillion in 2025, growing toward $8 trillion by 2027.
- Other projections show the market size to be near $7.4 trillion in 2025.
- Contrasting estimates from other sources suggest $4.8 trillion for 2025.
- An older figure estimated $6 trillion in global sales, representing 19.5% of all retail.
- A long‑range forecast puts e‑commerce at $10.36 trillion in 2020, with $27.15 trillion expected by 2027, CAGR of 14.7%.
- A comprehensive market report expects $28.5 trillion worldwide by the end of 2025, up from $15.8 trillion in 2021. North America alone accounts for $10.2 trillion.
Number of Online Shoppers
- 2.77 billion global online shoppers in 2025, now 33% of the world’s population, up 2.2% from last year.
- The shopping population is expected to reach 2.86 billion by 2026.
- In India, e‑commerce reached 312.5 million shoppers in 2022 and is expected to exceed 400 million by 2027.
Share of Online Retail Sales
- In 2025, 21% of all retail purchases will happen online, climbing to 22.6% by 2027.
- Another source confirms e‑commerce’s continuing rise in the overall retail mix.
Online Purchase Timing and Spending Trends
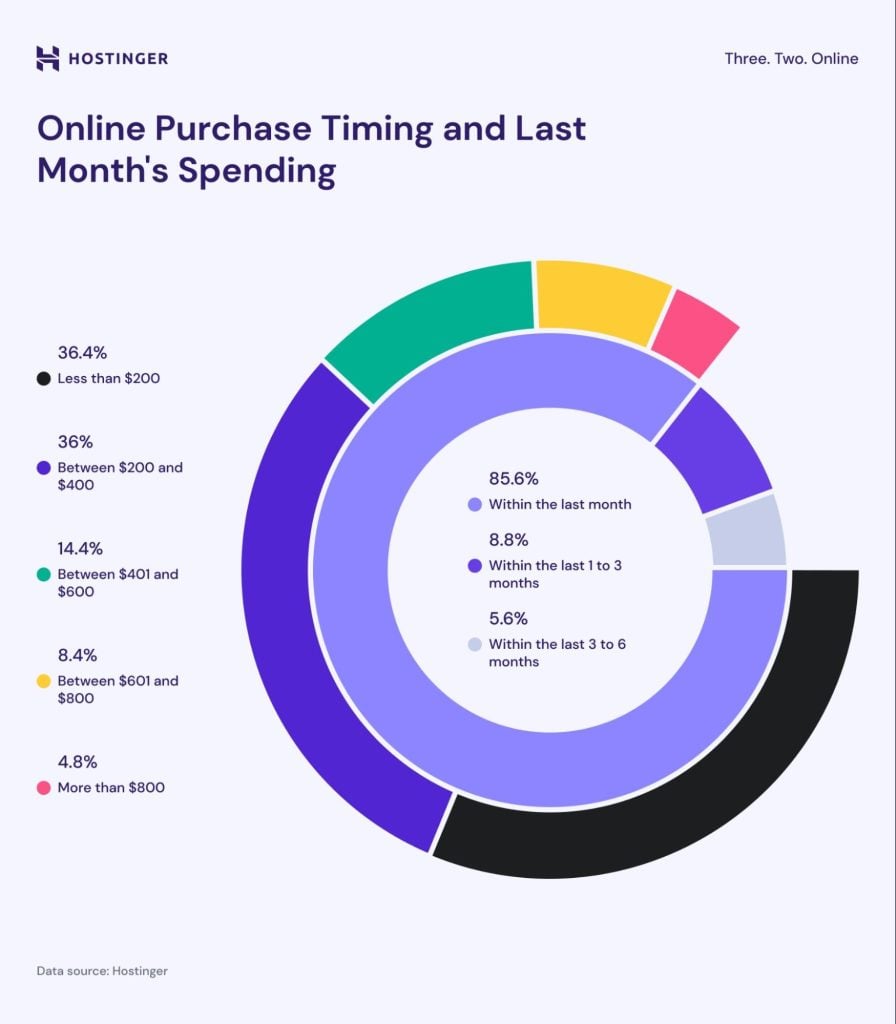
- 85.6% of shoppers made an online purchase within the last month.
- 8.8% purchased within the last 1 to 3 months.
- 5.6% made purchases within the last 3 to 6 months.
- 36.4% of buyers spent less than $200 on online shopping in the last month.
- 36% spent between $200 and $400, showing a strong mid-range spending trend.
- 14.4% spent between $401 and $600.
- 8.4% of consumers spent between $601 and $800.
- 4.8% spent more than $800, representing the high-spending segment.
Top E-commerce Websites by Traffic
- Amazon remains the undisputed traffic leader in e‑commerce and shopping categories in 2025.
- In July 2025, globally, AliExpress.com recorded ≈797.7 million monthly visits.
- eBay followed with 529 million visits in the same period.
- Samsung.com registered 507 million visits by June 2025.
- In global rankings, Amazon consistently holds the top spot, with exceptional engagement, average. pages per visit 9.96, bounce rate ~30%.
- Other top sites include Alibaba, Taobao + Tmall, noted for around 925 million visitors monthly.
- Shopee attracts about 587 million visits monthly.
- Additional major traffic players, Walmart, 514 M, and JD.com, 499 M.
United States E-commerce Market Statistics
- U.S. retail e‑commerce sales reached $1.1926 trillion in 2024, with quarter 4 alone generating $352.93 billion, up 24.6% year-over-year.
- Forecasts for 2025 see U.S. e‑commerce hitting $1.29 trillion, pushing online sales to ≈22.6% of total retail.
- Another report projects 7.7% growth in U.S. e‑commerce in 2025, taking it to about $1.2 trillion.
- In Q2 2025, e‑commerce sales were $304.2 billion, up 5.3% YoY, and made up 16.3% of total retail sales.
- Unadjusted, Q2’s e‑commerce sales were $292.9 billion, showing a 6.2% increase from Q1 2025.
- In Q1 2025, online sales totaled $300.2 billion, accounting for 16.2% of total U.S. retail, unchanged from the previous quarter, with 6.1% annual growth.
- Under a moderate tariffs scenario, U.S. e‑commerce growth is projected at 5.0% in 2025, down from earlier estimates of 7.9%.
Social Commerce Spending by Generation
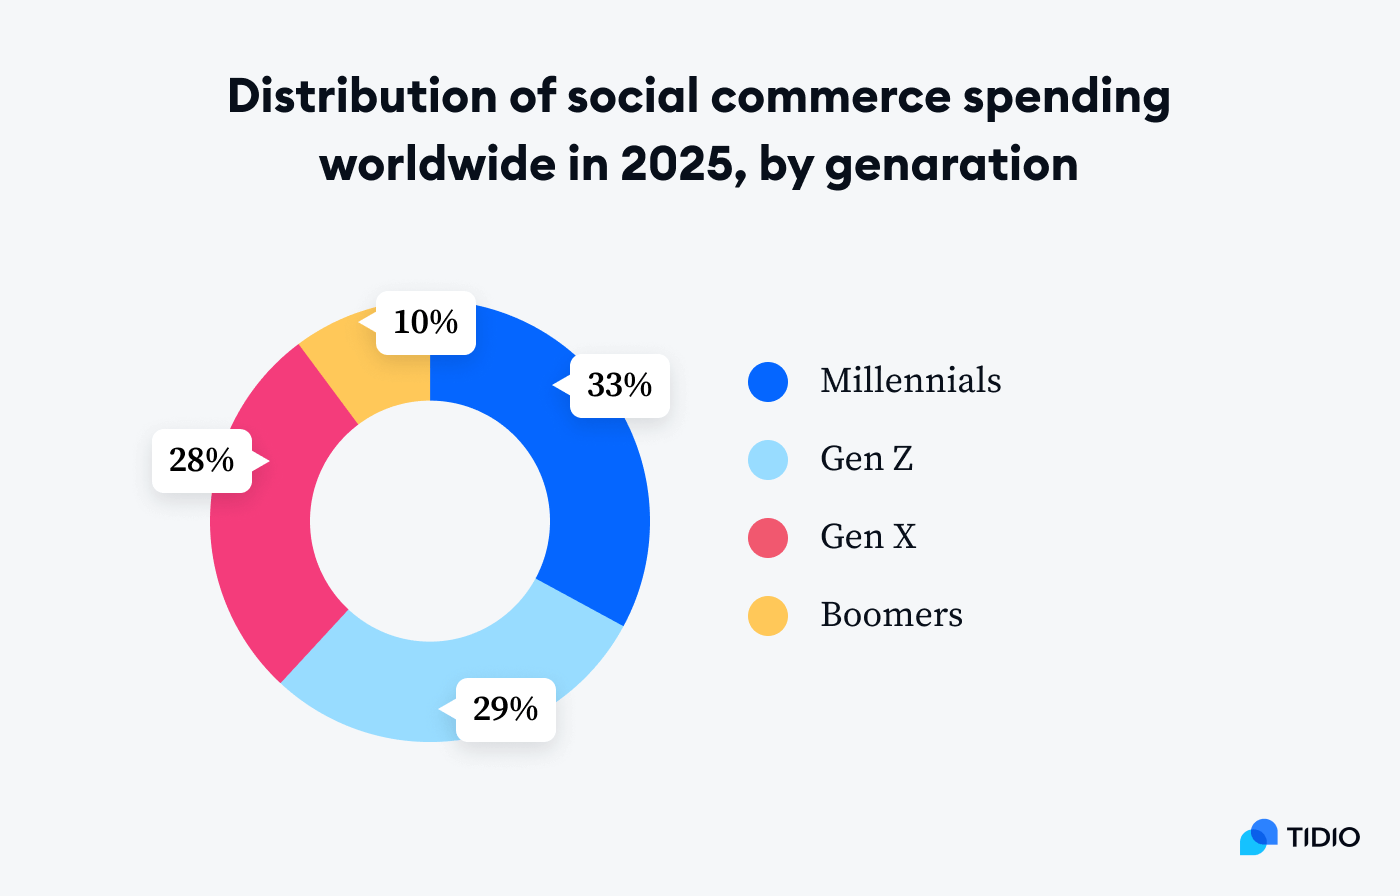
- Millennials lead with 33% of global social commerce spending.
- Gen Z accounts for 29%, showing strong adoption among younger consumers.
- Gen X contributes 28%, making them nearly equal to Gen Z in spending power.
- Boomers represent 10%, the smallest share among all generations.
Regional E-commerce Growth Statistics
- In Germany, e‑commerce sales rose 1.1% in 2024 to €80.6 billion, the first increase since 2021. 2025 is expected to bring 2.5% growth.
- Vietnam’s e‑commerce market is set to grow from $13.7 billion in 2021 to $32 billion by 2025, reflecting average annual growth of ~30%.
- India’s digital economy is projected to cross $1 trillion by 2030, driven by mobile adoption and seamless payments.
- In China, live commerce continues to surge; the country’s online retail reached over ¥7.4 trillion (~$1.03 trillion) in H1 2025, powered significantly by live‑stream shopping platforms.
B2B E‑commerce Statistics
- The global B2B e-commerce market is projected to reach $32.1 trillion in 2025, although other models (e.g., UNCTAD) estimate significantly lower ranges depending on definitions.
- Projected to grow to $36.16 trillion by 2026.
- Another outlook pegs the 2025 B2B e‑commerce at $13.68 trillion, rising to $60.62 trillion by 2034 at 18.0% CAGR.
- As of 2023, the market stood at $18.66 trillion, expected to reach $57.58 trillion by 2030.
- The U.S. B2B e‑commerce market alone is valued at $10.1 trillion in 2025, with growth to $11.4 trillion by 2030.
- On average, 82% of B2B company revenue now comes from remote, non-in-person sales.
- Asia accounts for approximately 80% of global B2B e‑commerce activity.
Product Category Share in Social Commerce
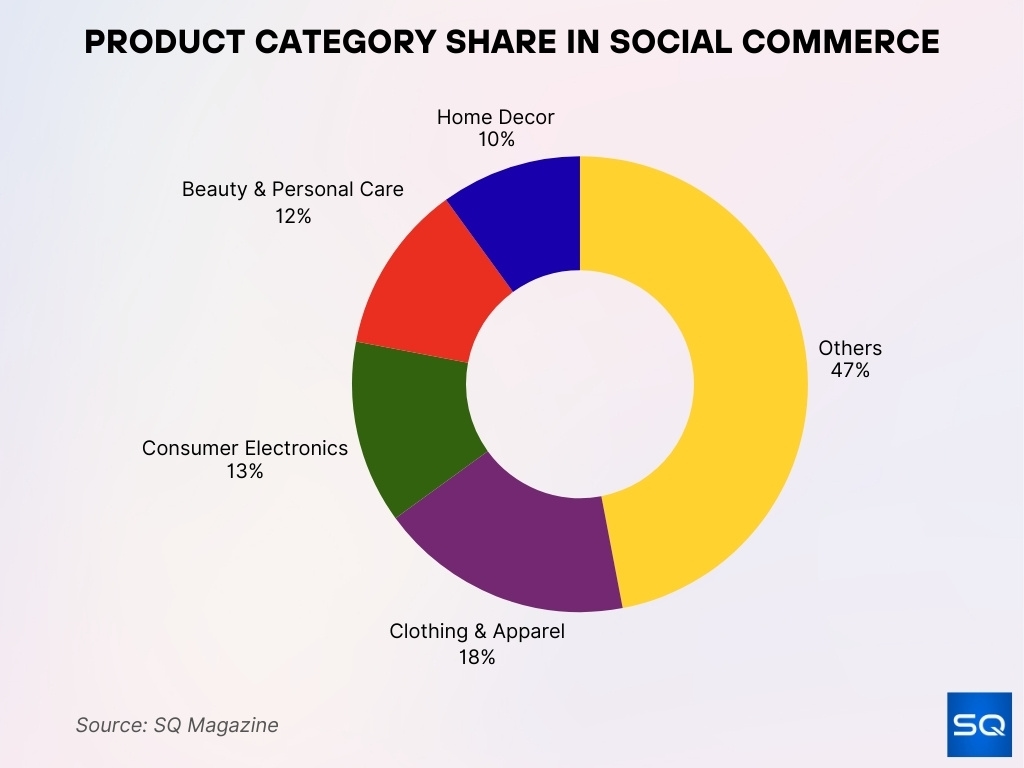
- 47% of sales will come from other categories, showing the wide diversity of social commerce products.
- Clothing & Apparel holds 18%, making it the largest defined category in social commerce spending.
- Consumer Electronics accounts for 13%, reflecting the popularity of tech purchases via social platforms.
- Beauty & Personal Care represents 12%, highlighting steady demand in lifestyle-driven products.
- Home Decor contributes 10%, capturing a notable share of consumer spending.
Mobile Commerce (M‑commerce) Statistics
- M‑commerce is expected to drive about 59% of all online retail sales in 2025, totaling around $4.0 trillion.
- An estimated 1.65 billion consumers worldwide shopped via mobile devices in 2024, representing about 30% of internet users.
- In the U.S., mobile commerce sales are projected at $900 billion in 2025, representing nearly 50% of total e‑commerce.
- In Asia, over 85% of online transactions occur on mobile devices, with leaders like WeChat Pay and Alipay dominating.
- Mobile-driven fraud costs, 33% in the U.S. and 41% in Canada, originate from mobile or digital wallet payments.
- Digital wallets have surged, from 22% to 65% in e‑commerce and from 3% to 45% at the point of sale.
- The shift to digital payments is accelerating, with digital methods expected to account for 79% of e‑commerce payments by 2030, up from 34% in 2014.
Social Commerce Statistics
- The global social commerce market will grow from $764.5 billion in 2024 to $872.7 billion in 2025, at a 14.2% CAGR.
- Another forecast sees social commerce at $1.26 trillion in 2024, rising to $1.66 trillion in 2025, with a 31.7% CAGR through 2034.
- U.S. social commerce is expected to reach $114.7 billion in 2025, growing annually at 14.4%.
- In the U.S., social commerce sales account for about 7.2% of total e‑commerce in 2025, up from 5.1% in 2022.
- CAGR for U.S. social commerce is about 24.7% through 2025.
- Projected U.S. growth continues, social commerce sales to eclipse $90 billion in 2025, up from nearly $64.8 billion in 2023.
- Video-first channels, such as TikTok Shop and Instagram Shopping, are driving 30% annual growth in social commerce across Europe and beyond.
Payment Methods and Trends
- Credit and debit cards are still widely used, accounting for 20% (credit) and 12% (debit) of e‑commerce payments in 2024.
- Digital wallets remain the top channel for e‑commerce payments, surging from 22% to 65% share.
- Digital payments are expected to reach 79% of e‑commerce transactions by 2030.
- The total e‑commerce payment market is valued at $4.32 trillion in 2025, with an 8.0% CAGR, projecting toward $5.89 trillion by 2029.
- Consumer “phygital” experiences blending physical and digital payments are rising, powered by biometrics, IoT, and tokenization.
- Buy Now, Pay Later (BNPL) is increasingly offered, but requires responsible integration due to potential consumer financial stress.
- Real-time payments and AI-driven fraud detection are gaining traction across payment systems.
Fraud and Security Statistics
- E‑commerce firms face annual losses of approximately $48 billion to fraud.
- About 40% of global e‑commerce fraud attacks originate in the U.S.
- Companies lose roughly 2.9% of global revenue to online fraud, and about 10% of revenue is spent managing fraud.
- Fraud grew 21% year-over-year as of 2025.
- One in 20 verification attempts in 2024 was fraudulent, and authorized fraud surged to 1.62%, which is 18× the global average.
- AI-driven attacks are on the rise, with 60.5% of professionals reporting increased AI use in fraud attempts.
- Remote-access attacks rose 8% during the 2024 Black Friday and Cyber Monday period compared to 2023.
- Fraud prevention best practices include layered detection, CVV and address checks, and risk scoring to reduce impact.
Automation and Technology Adoption
- Personalization tools, chatbots, and analytics will drive the AI-enabled e-commerce software and services market to reach $8.65 billion in 2025.
- As of 2025, about 89% of retail and consumer goods companies report piloting or adopting AI.
- Retail executives expect 80% of companies to adopt AI automation by the end of 2025.
- 84% of e‑commerce businesses now list AI as a top priority.
- AI tools power recommendations, dynamic pricing, inventory management, and personalized offers.
- Conversational commerce, including chatbots and voice assistants, hits $8.8 billion in 2025.
- Augmented reality (AR) shopping is gaining traction, with AR device count projected at 1.7 billion by 2024, enhancing interactive buying experiences.
- In the U.S., online purchases drive 53% of fraud costs, and mobile channels contribute 30%. In Canada, mobile and digital wallets generate 41% of fraud costs.
- 60% of merchants adopt tokenization, but 80% struggle to use data and ML tools effectively, and 90% deploy anti–first-party misuse strategies.
Emerging Trends in E‑commerce Platforms
- AI‑driven personalization is now standard, with 92% of businesses already using generative AI for marketing and search enhancements.
- Social shopping is booming, integrating commerce and community across platforms.
- Voice commerce is emerging, leveraging messaging and AI assistants for seamless shopping.
- Sustainability is rising as a core consideration in platform design and logistics.
- Quick commerce is expanding into smaller Indian cities, fueling D2C growth in niche wellness and personal care categories.
- In China, AI “virtual human” livestream sellers boosted direct sales, with one brand reporting a 30% increase, earning $2,500 in two hours.
- In Europe, concerns over Chinese e‑commerce platforms like Temu are triggering regulatory discussions about import duty changes and market threats.
- Retailers in Australia and New Zealand are investing in ship‑from‑store models to compete on speed and efficiency.
- Amazon’s U.S. expansion into same‑day grocery delivery across 2,300 cities aims to challenge Walmart’s 32% market share.
Conclusion
E‑commerce today is a dynamic, multinational force, driven by fast‑growing B2B markets, mobile-first shoppers, immersive social commerce, and advanced payment and fraud controls. AI and automation are redefining personalization, risk management, and multichannel reach. Meanwhile, emerging trends like virtual avatars, AR experiences, and hyperlocal logistics are reshaping how brands connect with consumers.
These numbers tell a clear story: digital commerce is not slowing; it’s evolving. Whether you’re a brand, platform operator, or strategist, staying informed on these trends is key to navigating the shifting digital economy.


