Augmented Reality (AR) has swiftly evolved from novelty tech into a cornerstone of modern industry. Today, it powers immersive e-commerce experiences, revolutionizes medical training, and elevates gaming far beyond screens. Retailers use AR to reduce returns and drive conversions, while educators leverage it to improve engagement and retention. As the technology scales, so does its influence across sectors.
Editor’s Choice
- The global AR/VR market is projected to reach $89.82 billion in 2025, growing from $62.75 billion in 2024, reflecting a CAGR of 31.6%.
- In Q1 2024, Meta commanded 50.2% of global AR/VR headset shipments, according to IDC, making it the dominant player.
- The mobile AR market will grow at a CAGR of around 31.1%, reaching approximately $112–115 billion by 2030, driven by gaming, e-commerce, and navigation applications.
- AR advertising is set to generate $6.72 billion by 2027, driven by immersive ad experiences.
- Some studies suggest that VR-based training can improve learning outcomes by 70–75% and reduce training time significantly, although these results vary by context and are not universally standardized.
- Products with 3D/AR experiences have shown up to a 94% increase in conversion rates in some cases, though results can vary by product category.
- The AR gaming market will reach $51.63 billion by 2029, nearly quadrupling from current figures.
Recent Developments
- AI integration into AR hardware is pushing smart glasses and headsets toward mainstream use.
- Meta’s Ray-Ban smart glasses have sold over 2.6 million units since 2023, reflecting surging consumer demand.
- Apple Vision Pro, released in early 2024, combines spatial computing with AR, but high pricing limits broad adoption.
- IDC projects a 12% decline in headset shipments in 2025, due to economic headwinds and market saturation.
- Despite a temporary dip, headset sales are expected to rebound by 87% in 2026, reaching 11.2 million units.
- Niantic sold its AR games division (including Pokémon GO) for $3.5 billion, covering 30 million monthly users.
- Snap’s next-gen AR glasses, expected in 2026, will include video calling and real-time translation.
- Meta, Google, and Apple continue to invest in building foundational AR ecosystems.
- Industry insiders predict AR to replace smartphones by 2030, aligning with broader spatial computing trends.
- 5G expansion is accelerating cloud-based AR experiences, enabling lower-latency rendering and higher realism.
AR Devices, Hardware, and Software Statistics
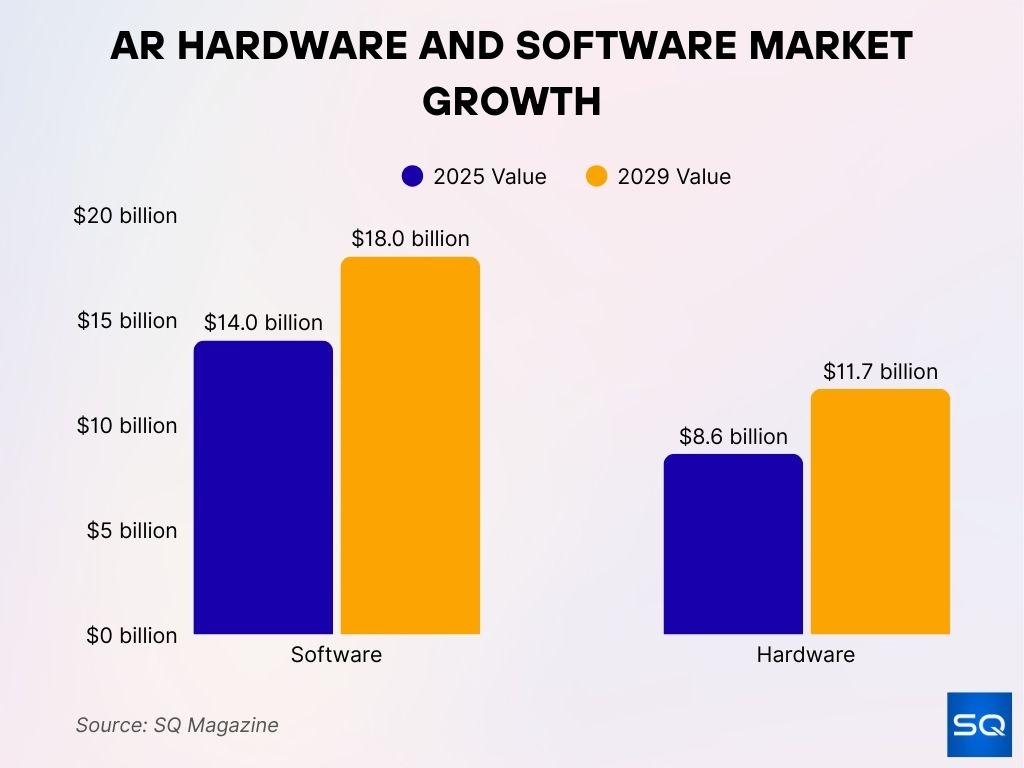
- The AR software market is expected to generate $14 billion in 2025, growing at a 6.4% CAGR through 2029, reaching $18 billion.
- The AR hardware market globally is projected at $8.6 billion in 2025, growing at a 13% CAGR to $11.7 billion by 2029.
- The combined AR & VR hardware market grew from $62.5 billion in 2024 to $82.9 billion in 2025, a 32.6% increase.
- Global AR/VR headset shipments rose 18.1% year-over-year in Q1 2025, with Meta holding 50.8% market share.
- Headset shipments for the full year 2024 reached 9.6 million units, reflecting 8.8%–10% annual growth rates.
- Despite this growth, IDC forecasts a 12% drop in headset shipments in 2025, citing production delays.
- Thanks to AI integration and lower prices, AR/VR headset shipments are expected to surge 41.4% in 2025, reaching 22.9 million units by 2028.
- The mobile AR market is projected to grow from $30.6 billion in 2025 to $113.6 billion by 2030, at a 31.3% CAGR.
Market Share Statistics by Region
- North America holds over 33% of the AR market revenue, making it the global leader in 2025.
- Asia-Pacific leads in growth, expected to exceed 41% CAGR through 2030.
- Europe ranks third, with AR adoption strongest in Germany, the UK, and France.
- China’s AR market is projected to surpass $30 billion by 2026, powered by government funding and mobile adoption.
- In India, the AR/VR market is forecast to grow at a 40% CAGR, reaching $5 billion by 2028.
- Latin America’s AR growth is slow but steady, with Brazil and Mexico driving regional momentum.
- Middle East & Africa markets remain nascent, yet investments in education and tourism AR apps are rising.
- Global AR investment by region shows 60% of capital flows into North America and Asia combined.
- Cross-border AR collaborations are becoming common, especially between U.S. startups and APAC manufacturers.
- Regional compliance laws, particularly in the EU, impact how AR data can be collected and processed.
Consumer and User Statistics
- In the U.S., around 60% of the population is AR users in 2025, many through smartphones.
- 71% of shoppers say they would shop more often if AR were available during the buying process.
- AR filters and lenses are used by over 500 million users daily on platforms like Instagram and Snapchat.
- Snapchat reports over 6 billion AR lens plays per day, highlighting consumer demand for AR content.
- Generation Z and Millennials make up 75% of AR users, indicating strong long-term market viability.
- Consumers spend 2.6 times more time with AR experiences than with static ads.
- 60% of U.S. consumers prefer brands that offer AR-powered try-before-you-buy tools.
- AR-powered navigation apps, like Google Live View, are now used by over 150 million people globally.
- Virtual home design AR apps like IKEA Place have seen installs grow by 180% year-over-year.
- AR-enhanced museum exhibits and tourism experiences are visited by over 70 million tourists annually.
Augmented Reality Services Global Market Report
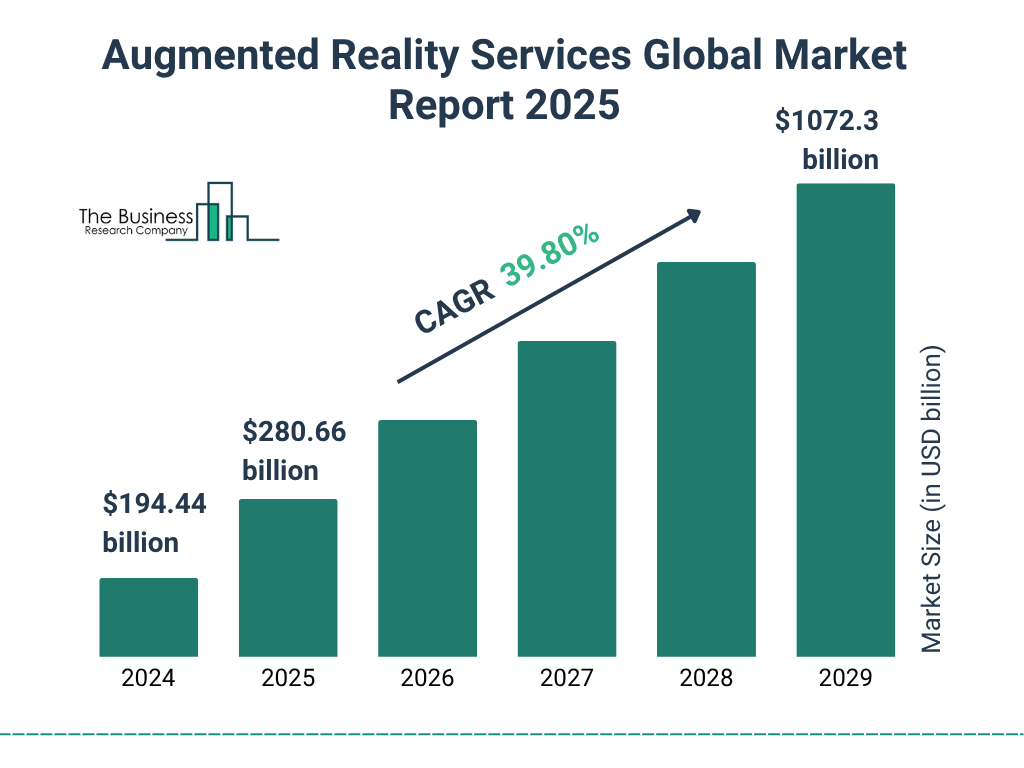
- The global AR services market was valued at $194.44 billion in 2024.
- In 2025, the market is projected to grow to $280.66 billion.
- By 2029, the AR services market is expected to surge to $1,072.3 billion.
- This expansion represents a strong CAGR of 39.8% between 2024 and 2029.
AR Glasses and Headsets Statistics
- IDC projects shipments of AR/VR headsets to drop 12% in 2025, falling from 7.5 million units in 2024 to 6.6 million.
- A rebound is expected in 2026, with 87% growth, surpassing 11.2 million units sold.
- The market for simpler internet-connected “smart glasses” is projected to double from 2.7 million units in 2024 to 5.5 million in 2025.
- Meta’s Wayfarer AI glasses have already sold nearly 2.6 million units since 2023, and the smart glasses market is expected to grow by nearly 50% annually through 2029.
- Meta’s investment in EssilorLuxottica underscores its focus, with expected annual growth over 60% through 2029.
- Snap’s next-gen AR smartglasses are slated for 2026, offering hands‑free video calling, AI features, translation, and more.
- IDC forecasts near 9 million smartglasses units sold in 2025, with a 47% average annual growth through 2029.
Retail and E-commerce
- In the U.S., 35%–40% of internet users, equating to ~60% of the population, are expected to be regular AR users by 2025.
- Companies using AR in retail often report up to 40% higher conversion rates.
- Though dated, in 2020, forecasts indicated that AR/VR could be used by 100 million shoppers, both online and in-store.
- About 71% of consumers say they would shop more often if AR were available.
- Only 1% of retailers were using AR in customer experience, and 52% weren’t ready to integrate AR/VR.
- Adoption barriers conflict with strong user interest, especially in sectors like furniture, fashion, and auto, where visual trials matter.
- Retailers face an opportunity to close this gap, with more consumers ready than the adoption rate suggests.
- AR in fashion retail has increased virtual try-on adoption by over 200% since 2023.
AR Market Segmentation by Industry
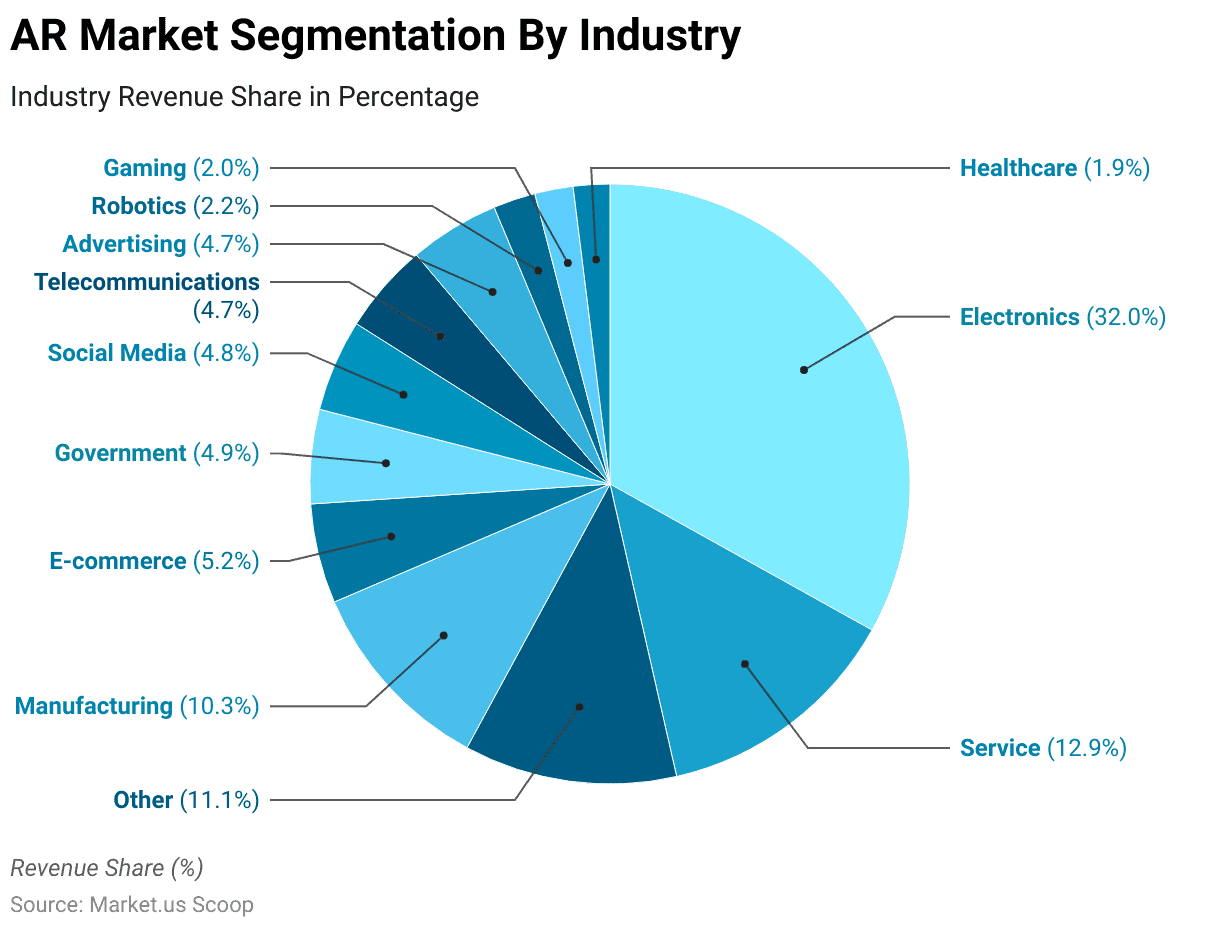
- Electronics leads the AR market with 32.0% revenue share.
- Service industries account for 12.9% of the AR market.
- Other sectors collectively contribute 11.1%.
- Manufacturing holds a 10.3% share.
- E-commerce makes up 5.2% of the market.
- Government applications represent 4.9%.
- Social Media platforms contribute 4.8%.
- Telecommunications also account for 4.7%.
- Advertising captures 4.7% of AR revenue.
- Robotics takes a 2.2% share.
- Gaming represents 2.0% of the AR industry.
- Healthcare has the smallest share at 1.9%.
Healthcare and Medicine
- The global AR healthcare market is projected to exceed $4.2 billion by 2026.
- AccuVein’s AR technology has aided over 10 million patients, making vein access 3.5 times more likely on the first attempt.
- At St. Jude Research Hospital, using VR/AR (EaseVRx) led to a 50% reduction in patient pain scores after six months.
- Training applications dominate, with 41.7% of AR training use cases focused on automotive and medical fields, and 40% using head‑mounted displays.
- AR tools are used in surgical planning, allowing for 3D mapping before complex procedures.
- AR-based rehabilitation programs have shown a 30% improvement in patient adherence.
- Telemedicine platforms with AR overlays are being piloted for remote diagnostics.
- AR-powered pharmacy apps help users understand prescriptions and usage with interactive visuals.
Manufacturing and Industrial Use
- In 2024, hardware represented over 58% of the global AR market share, and head‑mounted displays led by application, particularly in industrial and manufacturing use.
- North America held over 33% of the AR market revenue in 2024, with Asia‑Pacific showing the fastest projected growth (41%+ CAGR from 2025–2030).
- Key drivers include remote assistance, asset maintenance, and employee upskilling.
- AR-enhanced digital twins are used in factory simulations to optimize production workflows.
- AR inspection tools reduce error rates by 25% in quality control processes.
- AR in field service enables remote experts to guide technicians using smart glasses.
- Warehouse operations using AR overlays show up to 20% improvement in picking accuracy.
- Heavy equipment training with AR reduces incident rates by over 40%.
Factors Hindering AR Adoption
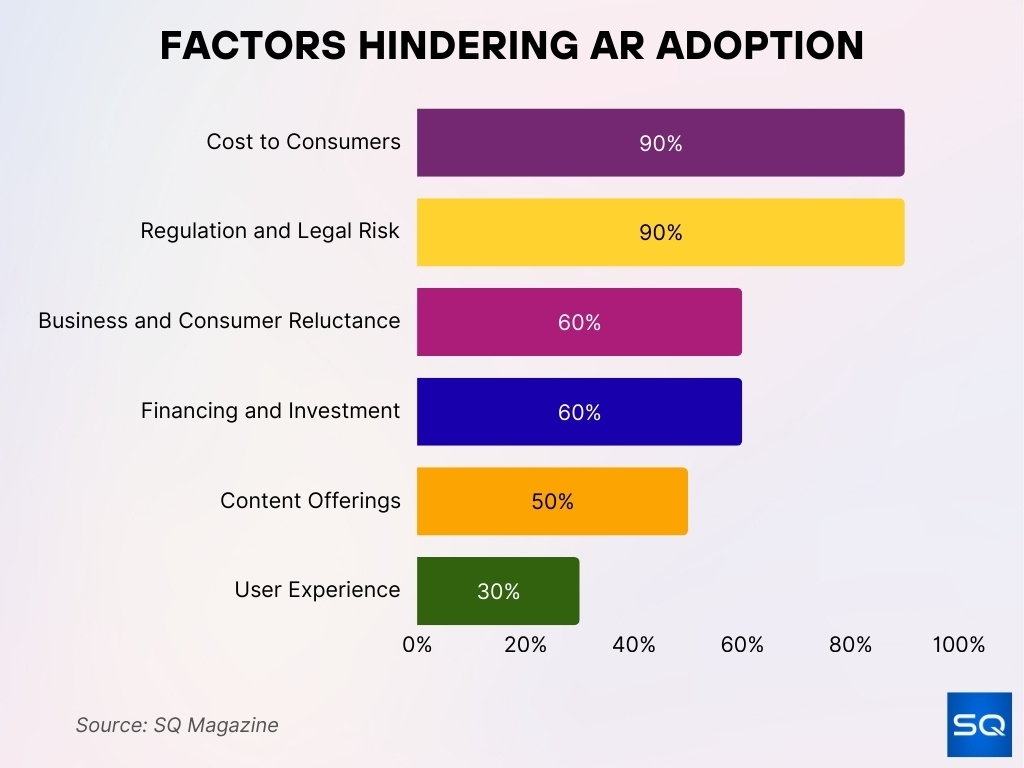
- 90% of respondents cite cost to consumers as a major barrier.
- 90% point to regulation and legal risk as a key adoption hurdle.
- 60% are concerned with business and consumer reluctance toward AR technology.
- 60% highlight issues with financing and investment availability.
- 50% believe content offerings are still lacking.
- 30% report user experience as a limiting factor in adoption.
Gaming and Entertainment
- The global AR gaming market is projected to grow from $14.32 billion in 2024 to $18.43 billion in 2025, marking a CAGR of 28.7%.
- The market will reach $51.63 billion by 2029, continuing a strong 29.4% CAGR.
- North America accounted for the largest share of AR gaming revenue in 2024, while Asia-Pacific is poised to exhibit the fastest growth.
- Smartphones dominate gaming devices, but AR glasses and HMDs are rising, especially in immersive e‑sports and geolocation games.
- Niantic’s games division, including Pokémon Go, Pikmin Bloom, and Monster Hunter Now, was sold for $3.5 billion, covering 30 million monthly active players and over $1 billion in annual revenue.
- This acquisition highlights the ongoing commercial strength of AR entertainment.
- User engagement with AR games is 2x higher than with non-AR games.
- Social AR features, like multiplayer or AR chat rooms, are expanding in entertainment apps.
Augmented Reality in Education
- The combined AR/VR education market is estimated at $27.1 billion in 2025.
- The AR in training and education segment is forecasted to grow from $31.26 billion in 2024 to $51.34 billion in 2025, a CAGR of 64.3%.
- Projections suggest growth to $249.42 billion by 2029, at a 48.5% CAGR.
- VR training yields 76% higher learning outcomes, reduces training time by up to 75%, and improves retention rates to 80% after one year.
- In the UK, VR adoption in schools rose 35% in 2024, with 93% of teachers reporting enhanced engagement.
- AR/VR labs in schools, such as in Coimbatore, improve learning with immersive 3D tools.
- STEM subjects benefit most from AR, with student scores increasing by up to 20%.
- AR-enabled textbooks are being deployed by top universities and publishers.
Advertising Statistics
- AR advertising shifts engagement from passive to active, immersive experiences, anchoring content in the user’s environment.
- AR ads help reduce product returns by 25%–40%, as shoppers visualize purchases more accurately.
- The global AR market is expected to reach $87.3 billion in 2025, with AR advertising revenue alone projected to hit $6.72 billion by 2027.
- Brand awareness increases by up to 70% when AR is used creatively.
- Brands increasingly rely on AR to boost engagement and stand out in saturated digital channels.
- AR-powered branded lenses on Snapchat generate 15+ seconds of average engagement time.
- AR ad campaigns see 20% better recall rates than traditional digital formats.
- Personalized AR ads lead to 45% higher click-through rates.
Impact of AR on Conversion and Brand Loyalty
- Products with 3D/AR content see a 94% higher conversion rate than those without.
- Retail using AR/VR enjoys 20% higher conversion rates and 25% fewer returns.
- 63% of customers say AR would improve their shopping experience.
- In loyalty programs, AR creates deeper engagement with immersive experiences and interactive storytelling.
- AR’s immersive nature strengthens brand recall and emotional connection, driving repeat purchases.
- 73% of consumers prefer brands offering consistent experiences, and 60% are more likely to return to brands with personalized AR.
- Gamified AR loyalty apps see engagement rates 2.5x higher than static programs.
- AR-based rewards programs result in a 20% increase in customer lifetime value.
Conclusion
AR adoption is no longer futuristic; it’s fundamentally reshaping gaming, education, retail, advertising, and brand experience across the U.S. and globally. The data show explosive market growth, stronger engagement, measurable conversion lifts, and improved learning outcomes. As smart glasses, immersive learning, and interactive ads converge, the path ahead is rich with innovation. Explore the full article for a deeper dive into these trends and see how businesses can harness AR’s power in today’s landscape.


