Tumblr has often been dismissed as a relic of early social media, but today, it’s quietly carving a niche as a cultural and creative haven. With renewed interest from Gen Z and fans of niche subcultures, its relevance is resurging. For marketers, Tumblr offers a way to reach audiences through fandom, visual art, and micro‑communities. For creators, it remains a platform where identity, aesthetics, and deep engagement matter more than follower counts. Below, we begin a structured look into the latest Tumblr statistics and trends.
Editor’s Choice
- 135 million monthly active users globally in 2025.
- Roughly 70% of users are under 35 (combining Gen Z and Millennials).
- Tumblr receives about 160.85 million visits in a single month (August 2025).
- 72.3% of users access Tumblr via mobile, 27.7% via desktop.
- 31% of users engage daily, 86% weekly, 88% monthly.
- Tumblr’s audience is 51.17% female, 48.83% male (approx.).
- Among visitor traffic, the United States accounts for about 44% of all visits.
Recent Developments
- In late 2024, Tumblr introduced “Communities”, a topic-based group features modelled after Reddit’s subreddits.
- The platform migrated major backend infrastructure in 2024, 2025 to align more closely with WordPress, aiming for smoother integration and feature upgrades.
- In early 2025, Automattic announced layoffs affecting around 16% of its workforce, including Tumblr teams.
- Tumblr once again focused on optional support for ActivityPub, the decentralized social protocol, to interoperate with federated networks.
- The tipping, micro‑donation feature (introduced in 2022) was removed in June 2024 due to low adoption.
- The Tumblr Live video streaming product was discontinued in January 2024.
- Tumblr’s new Communities feature is now available on web, iOS, and Android platforms.
- These recent changes reflect a shift toward stability, community structuring, and interoperability rather than pure growth.
Tumblr Employee Turnover Statistics
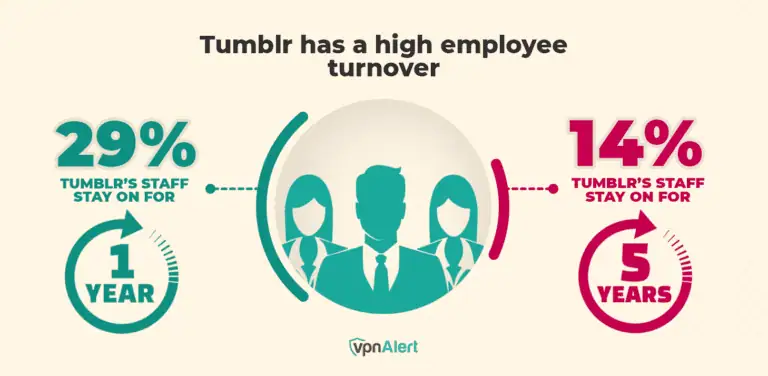
- 29% of Tumblr’s staff remain with the company for just 1 year.
- Only 14% of Tumblr’s staff stay employed for 5 years.

Key Tumblr Statistics
- 135 million monthly active users in 2025.
- Tumblr ranks among social platforms with over 100 million active users.
- The total visits to tumblr.com in August 2025: 160.85 million.
- Month‑to‑month decline: August visits were down ~5% from July.
- Traffic composition: 57.93% mobile, 42.07% desktop.
- Average session duration for tumblr.com in August 2025: 13 minutes 37 seconds.
- Bounce rate sits at about 55.22% in that same period.
- Pages viewed per visit: 4.51 pages on average.
- Organic search traffic has seen a ~32% drop month-over-month.
- Referring domains to Tumblr: ~204,170 in August 2025.
Geographic Distribution of Users
- The United States accounts for 44.0% of Tumblr’s web traffic (all devices) in August 2025.
- India contributes about 4.12% of visits.
- Brazil sends 3.73% of Tumblr’s traffic.
- The United Kingdom contributes 3.46% of total visits.
- Canada makes up 2.88% of Tumblr’s visits.
- On desktop only, the U.S. share is even higher, ~70.77% of desktop visits.
- Outside the top 5, the remainder (~33.9%) comes from a mix of countries worldwide.
- Tumblr’s rank in the U.S. is #125 in overall site traffic as of August 2025.
- In global site rank, Tumblr sits around #221.
Tumblr User Demographics
Age Demographics
- 40% of users are Gen Z (roughly ages 16–25).
- 30% of users are Millennials.
- Overall, 70% of users are under 35.
- Breakdown by more granular groups:
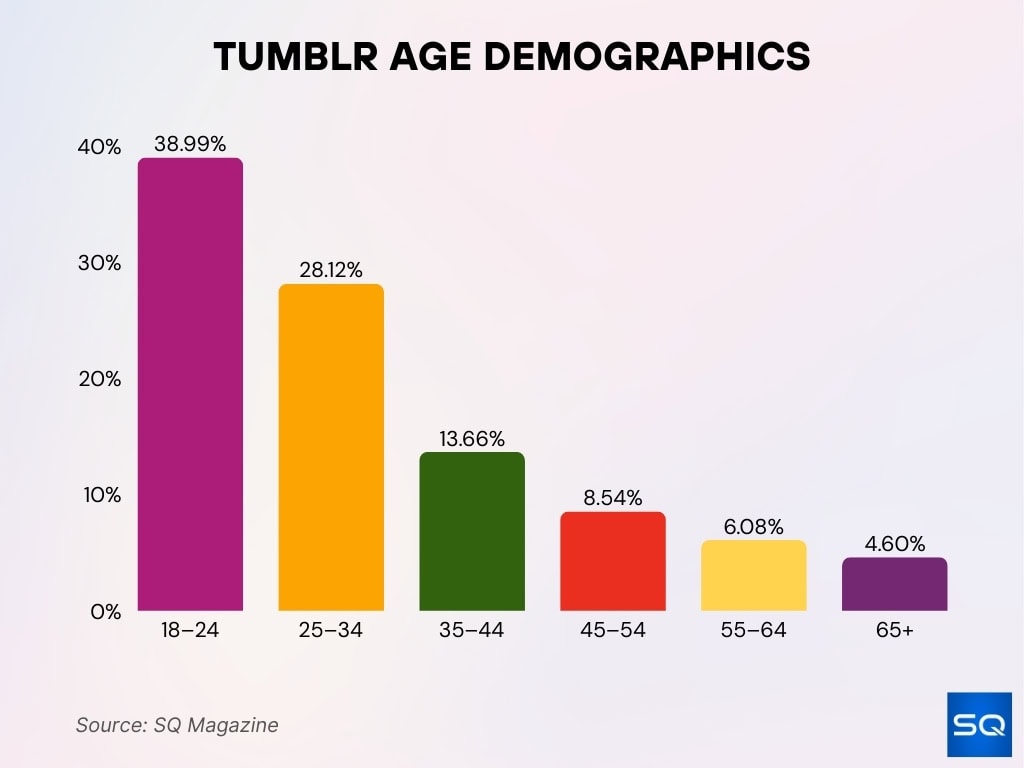
• Ages 18–24: 38.99%.
• Ages 25–34: 28.12%.
• Ages 35–44: 13.66%.
• Ages 45–54: 8.54%.
• Ages 55–64: 6.08%.
• Ages 65+: 4.60%. - A smaller share (~11%) falls in the age group 26–35.
- Usage penetration in the US: ~10% of 15–25 year-olds, ~11% of 26–35 year-olds.

Gender Demographics
- Tumblr site traffic shows 51.17% female, 48.83% male audience.
- Other sources confirm a near‑balanced split, often phrased as 50/50 male/female.
- The near parity in gender is unusual among major social platforms and contributes to Tumblr’s reputation as more inclusive or balanced.
- Some older reports suggest methods to infer gender via content or network analysis, but official numbers remain more balanced.
Monthly Active Users
- As of 2025, Tumblr has 135 million monthly active users globally.
- Tumblr ranks as one of the “top 10” social platforms by MAU in the U.S. context.
- Gen Z and Millennials combined make up 70% of its active user base.
- Some sources report 12 million U.S. monthly active users.
- Tumblr’s “advertiser audience” cites 60 million global monthly active users in that subset.
- The 135 million figure places Tumblr among platforms with over 100 million active users.
- In certain analyses, Tumblr is said to have ~11% market share within the social media ecosystem.
- Some sources note the user base has been relatively flat or slowly declining following earlier peaks.
Number of Tumblr Blogs
- Tumblr now hosts over 620 million blogs as of 2025.
- Last year (2024), the blog count was nearly 100 million fewer, indicating growth in blog creation.
- About 618 million blogs in 2025.
- Earlier data had ~572 million blogs, suggesting steady growth year-over-year.
- Tumblr users publish between 8.6 million and 12.8 million posts daily, depending on seasonal and regional fluctuations.
- That daily post volume equates to roughly 2,000 posts per second.
- Some sources estimate ~8.6 million daily posts to Tumblr.
- The large divergence in “blogs vs posts” metrics underscores Tumblr’s hybrid identity as both blogging and microcontent.
Reasons People Use Tumblr
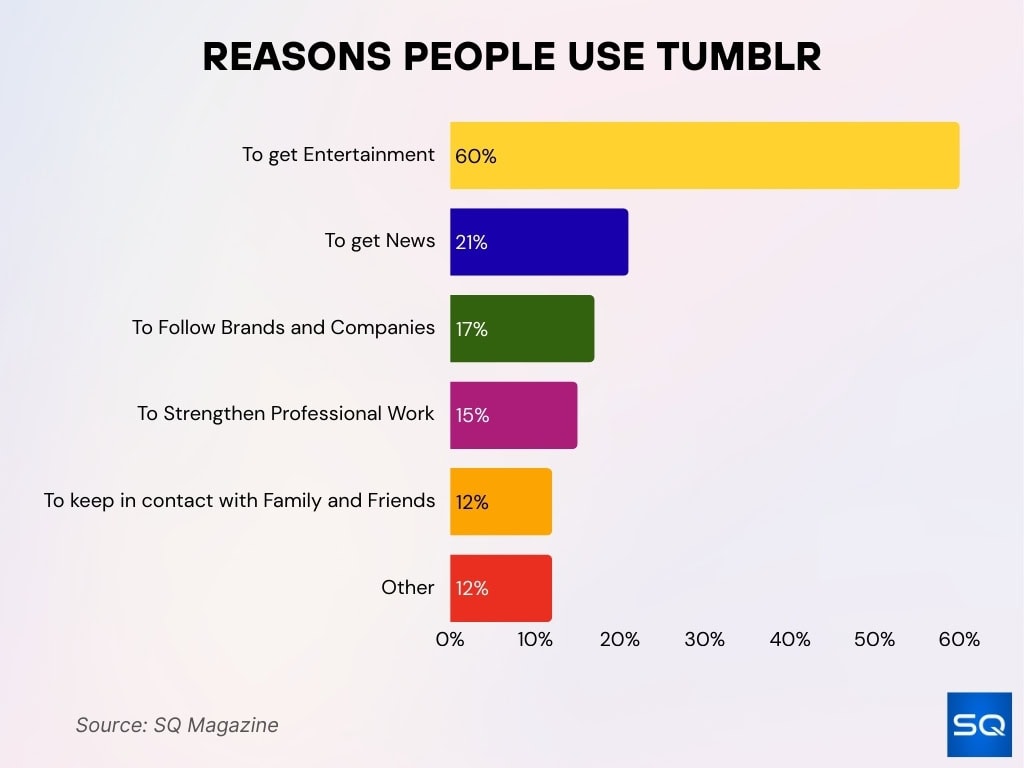
- 60% of users visit Tumblr primarily for entertainment.
- 21% use Tumblr to access news.
- 17% follow brands and companies on the platform.
- 15% use Tumblr to strengthen professional work.
- 12% keep in touch with family and friends through Tumblr.
- 12% use Tumblr for other purposes.

Daily Blog Posts Published
- One estimate: 12.8 million posts/day on Tumblr.
- Another estimate: 8.6 million posts/day.
- If 12.8 million, that’s ~2,000 posts per second.
- If 8.6 million, that’s ~100 posts per second.
- The wide range suggests fluctuations in publishing behavior across times of day, region, and user activity.
- Tumblr sees consistent content flow, regardless of debate over the exact number.
- Some analyses say daily posting numbers have declined from peak years but remain substantial.
- The disparity between posted and reblogged content means many more views than original posts.
- Growth in blog count suggests that many users maintain multiple blogs, increasing total posting frequency.
Website Traffic Statistics
- In August 2025, Tumblr recorded 160.85 million visits.
- That was a –5% drop from July 2025 (168.49 million visits).
- The average session duration was 13:37 (thirteen minutes, thirty-seven seconds).
- Tumblr had a bounce rate of 55.22% in August 2025.
- Pages per visit averaged 4.51 pages.
- Organic search traffic fell –32.48% month-over-month in August 2025.
- Direct traffic is the dominant source; 66.64% of visits came directly.
- Referring domains stood at 204,170.
- Backlinks numbered ~285.05 million in August 2025.
Mobile vs Desktop Usage
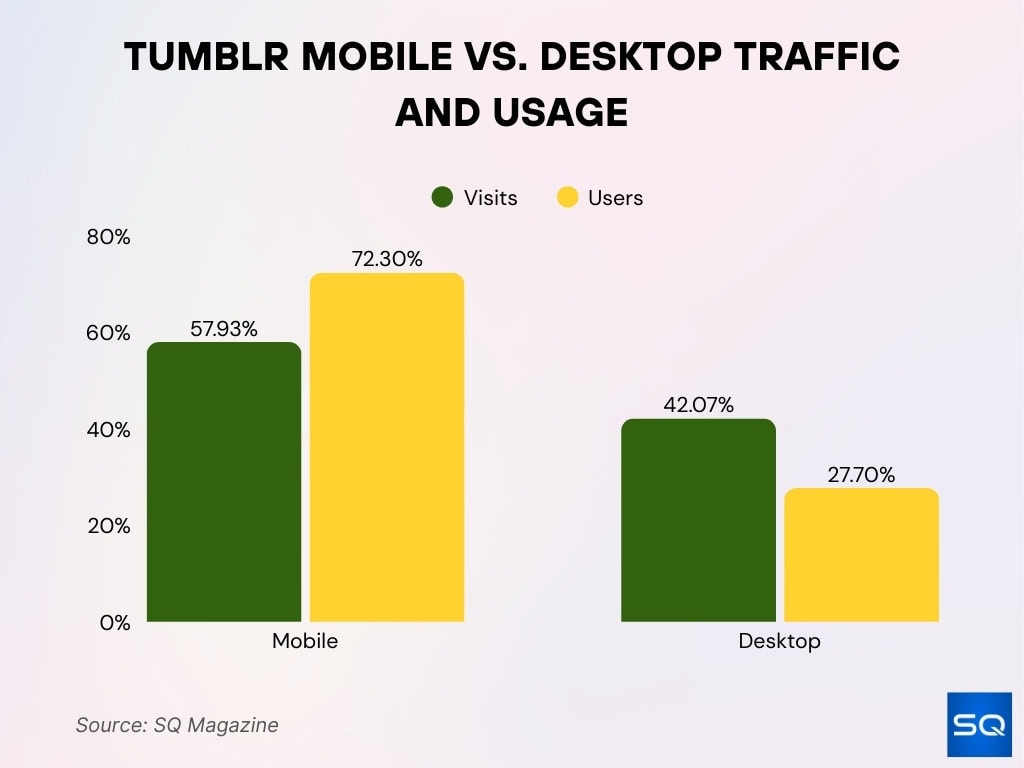
- 57.93% of Tumblr’s traffic comes from mobile devices.
- 42.07% originates from desktop.
- 72.3% of users access Tumblr via mobile and 27.7% via desktop.

- These differing figures hint at variation by region, session type, or measurement method.
- Mobile dominance is broadly consistent with trends in social and content platforms.
- Desktop remains relevant, particularly for deeper browsing sessions and content creation tools.
- Tumblr’s relatively high desktop share suggests a hybrid use case, content reading and blogging on larger screens.
- The mobile, desktop split may shift further toward mobile over time with app improvements and demographic change.
Traffic by Country
- On all devices, the U.S. leads with 44.0% of traffic share.
- India follows at 4.12% share.
- Brazil contributes 3.73%.
- The United Kingdom sends 3.46%.
- Canada accounts for 2.88%.
- On desktop-only, 70.77% of traffic is from the U.S.
- Other countries make up the rest (~40–42%).
User Engagement Rates
- 31% of Tumblr users engage daily.
- 86% of users engage at least weekly.
- 88% engage at least monthly.
- Tumblr’s “user engagement rate” is –21%.
- Tumblr still outperforms many platforms in session length, with average sessions well above 10 minutes.
- Tumblr’s bounce rate is moderate, meaning many users stay past the landing page.
- Engagement is heavily driven by reblogs, likes, and comments.
- Animated GIFs on Tumblr tend to go more viral than static images or videos.
- Posts with more hashtags tend to have wider reach and engagement on Tumblr.
Content Types Shared on Tumblr
- Image-based content constitutes ~78% of posts.
- Text, video, quote, link, chat, and audio remain supported post types.
- Animated GIFs tend to outperform static images in virality and reblogs.
- Many posts are reblogs or reposts rather than original content.
- Tumblr encourages tagging and content curation via tags, hashtags.
- Long‑form text posts survive alongside microblogs.
- Users also post fan art, memes, commentary, visual collages, aesthetics, and mixed media.
- Content in multiple languages (Tumblr supports 18 languages) allows cross‑cultural reach.
Market Share in Social Media
- Tumblr’s global social media share is estimated at around 0.36%.
- In North America, its share is estimated to be ~0.55%.
- In South America, its share is cited as 1.16%.
- In Europe, Tumblr’s share is lower, ~0.41%.
- In Asia, an estimated share is ~0.24%.
- In Africa, Tumblr’s share is near 0% in many estimates.
- Tumblr ranks #10 among social media platforms in U.S. usage by monthly active users.
- Its share is modest compared to giants, but it holds relevance in niche, fandom, and creative verticals.
- Its market share shrank significantly after the 2018 adult content ban, but has stabilized since.
Revenue and Monetization
- Tumblr’s annual revenue is ~$65 million.
- Tumblr introduced a “Post+” feature, allowing creators to charge $3.99, $5.99, or $9.99 monthly. Tumblr takes a 5% cut.
- Sponsored posts, branded content remain part of Tumblr’s advertising model.
- Tumblr sells themes and premium customization options.
- Native display ads and direct ad partnerships contribute to revenue streams.
- Tumblr categorizes outgoing ads by destination.
- Ad revenue appears to be a smaller slice of overall internet ad spending.
- Automattic has considered selling Tumblr and WordPress user data to AI training firms as a revenue strategy.
Impact of the Adult Content Ban
- Tumblr banned “adult content” on December 17, 2018.
- Monthly traffic fell sharply from ~521 million in 2018 to ~213 million by 2023.
- Visits dropped ~63% over a ~1.5‑year span post‑ban.
- The ban alienated part of Tumblr’s previous base but repositioned it as a more brand-safe environment.
- The policy change contributed to Tumblr’s decline in “mainstream” social media competition.
- Some posts still reference “Adult” as a category, but enforcement remains strong.
- The ban triggered shifts in content strategy: more safe‑for‑work visuals, fandom content, art, and commentary.
- Tumblr’s stabilization in recent years suggests communities adapted, even if scale was reduced.
Tumblr Fandom and Community Culture
- Fandoms (TV shows, anime, books, games) form a core of Tumblr’s active communities.
- Users often engage via fan art, fanfiction, theories, visual edits, and meta commentary.
- Community interaction is driven by reblog chains, tag threads, ask boxes, and shared microcultures.
- Tumblr allows high degrees of customization (themes, HTML).
- The platform’s design amplifies community dynamics over algorithmic virality.
- Some users treat Tumblr as a “safe space” or alternative to heavily monetized, polarized platforms.
- Fandoms sustain longevity on Tumblr; old shows, niche interests still find active communities.
- The community culture makes Tumblr less a mass broadcast medium and more a collective storytelling canvas.
Frequently Asked Questions (FAQs)
135 million monthly active users.
Around 620 million (or 620.8 million) blogs.
Approximately 72.3 % of users access Tumblr via mobile.
The U.S. contributes about 45% of Tumblr’s traffic.
Roughly $65 million per year.
Conclusion
Tumblr no longer competes head-to-head with global giants, but it retains a vital, passionate core. Its strengths lie not in mass reach but in deep engagement, creative expression, and niche communities. The 31% daily engagement, robust content diversity, and resilient fandom culture prove it’s not dormant; it’s evolved.
The 2018 ban on adult content reshaped Tumblr’s trajectory, but it also opened the way for a more brand-safe, art-forward identity. Monetization remains modest but adaptive through Post+, themes, and partnership-based ads. Market share is small, yes, but in Tumblr’s terrain, quality of community matters more than quantity.
For creators, brands, and analysts looking for truly invested audiences, especially within fandoms, art, and youth subcultures, Tumblr still offers something rare: a space built around belonging, not broadcasting.


