The native token of the The Open Network (“TON”) ecosystem, Toncoin (TON), is forging its place in the crypto landscape with measurable traction across on‑chain activity and market metrics. In one scenario, financial firms use TON for cross‑border remittances thanks to its low‑fee transfers and integration with the Telegram wallet. In another example, decentralized apps built on the network leverage TON staking and liquidity provisioning to power DeFi offerings. Dive into the stats below for a clear view of where TON stands, and why those numbers matter.
Editor’s Choice
- Circulating supply is about 2.57 billion TON as of November 2025.
- Total supply is reported at around 5.14 billion TON, though no fixed cap exists.
- Market capitalization is around $3.66 billion in November 2025.
- 24-hour trading volume averages $133 million in November 2025.
- Over the past year, the token price has experienced a drop of around ‑77% in GBP terms.
- Daily transactions average in the low millions (≈2.16 million) in recent snapshots.
Recent Developments
- TON’s trading price per token has ranged roughly between $1.45–$2.10 in November 2025.
- Forecasts in late 2025 suggested targets of $4.30 to $4.83 by December for Toncoin under bullish conditions.
- New wallet activations average ~43,600 per day as of Nov 2025.
- Network usage growth, daily active wallets and monthly metrics show positive momentum (e.g., monthly active wallets ~1.78 million).
- The integration of TON into Telegram’s wallet ecosystem deepens, providing easier access for mainstream users.
- The underlying protocol and community are proceeding with upgraded tooling and platform features (e.g., smart contract language FunC, validator tooling).
- Academic and audit attention are increasing, reflecting rising scrutiny and the maturity of the network.
Toncoin Technical Indicators
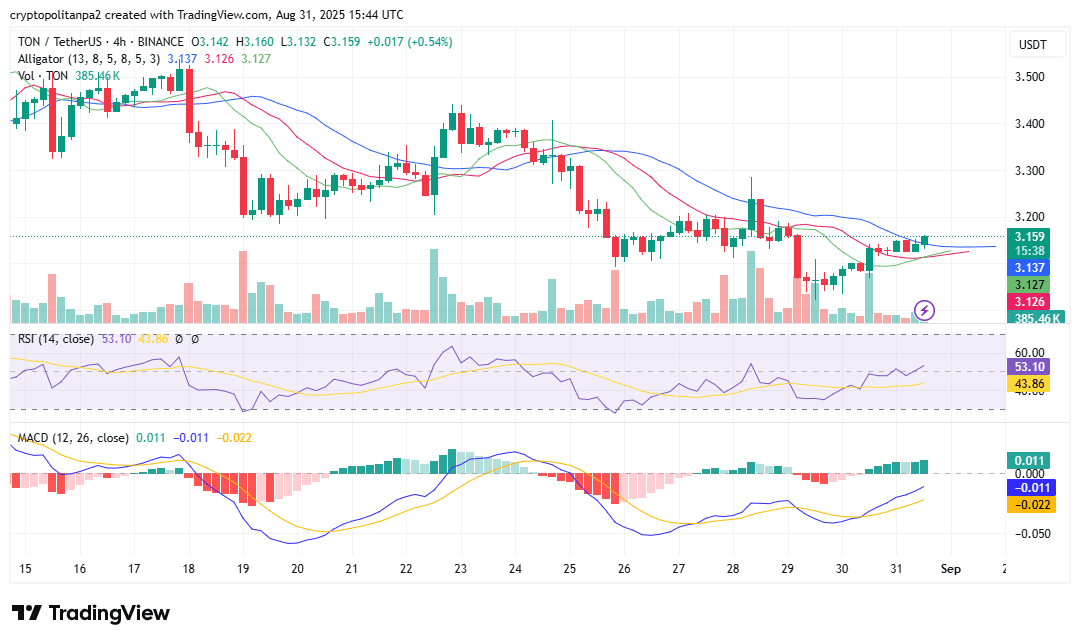
- Current price is $3.159, up +0.54% in the last 4-hour candle.
- 24H range moved between $3.132–$3.160, showing slight upside pressure.
- Trading volume hit 385.46K TON, indicating steady activity.
- Alligator Indicator shows tight clustering, suggesting low volatility.
- Jaw (blue) at $3.137, Teeth (red) at $3.127, Lips (green) at $3.126.
- Set up points to a potential breakout due to the narrow range.
- RSI is at 53.10, signalling mild bullish momentum above neutral.
- MACD Line is +0.011, Signal Line is –0.011, Histogram is +0.022.
- MACD crossover confirms early signs of bullish momentum.
Trading Volume & Liquidity
- Volume to market‑cap ratio sits at roughly 3.6%, showing a moderate level of liquidity relative to size.
- Data from ecosystem trackers indicates 24‑hour trading volume fluctuating between $140 million $158 million, suggesting some recent pick‑up.
- Exchange liquidity appears concentrated on certain platforms, e.g., HTX with ~$15.6 million daily, Binance ~$13.1 million, KuCoin ~$5.7 million.
- Historical price data shows intraday ranges moving between ~$1.46 and $2.31 in the past month.
- The high‑volume trading days correlate with upticks in wallet activity and on‑chain movements, indicating tight coupling between liquidity and network usage.
- While liquidity is sufficient for trading activity, the ratio of circulating to total supply (~48%) suggests a sizable portion of tokens remain off‑market, which could affect price dynamics if unlocked.
Circulating and Total Supply
- Circulating supply is about 2.57 billion TON as of November 2025.
- Total supply is reported at ~5.14 billion TON, with no defined maximum cap.
- Supply ratio, circulating supply / total supply ≈ 48%, indicating roughly half the issued tokens are tradable.
- Daily minting (creation) is approximately 88,137 TON per day.
- Daily burn (destruction) is about 3,140 TON per day in the referenced study.
- The annual inflation rate is cited at around 0.56%, linking mint and burn rates to supply growth.
- The difference between total supply and circulating supply (~2.66 billion TON) suggests large allocations of tokens remain uncirculated, potentially in staking, strategic reserves or future unlock schedules.
Transaction Statistics
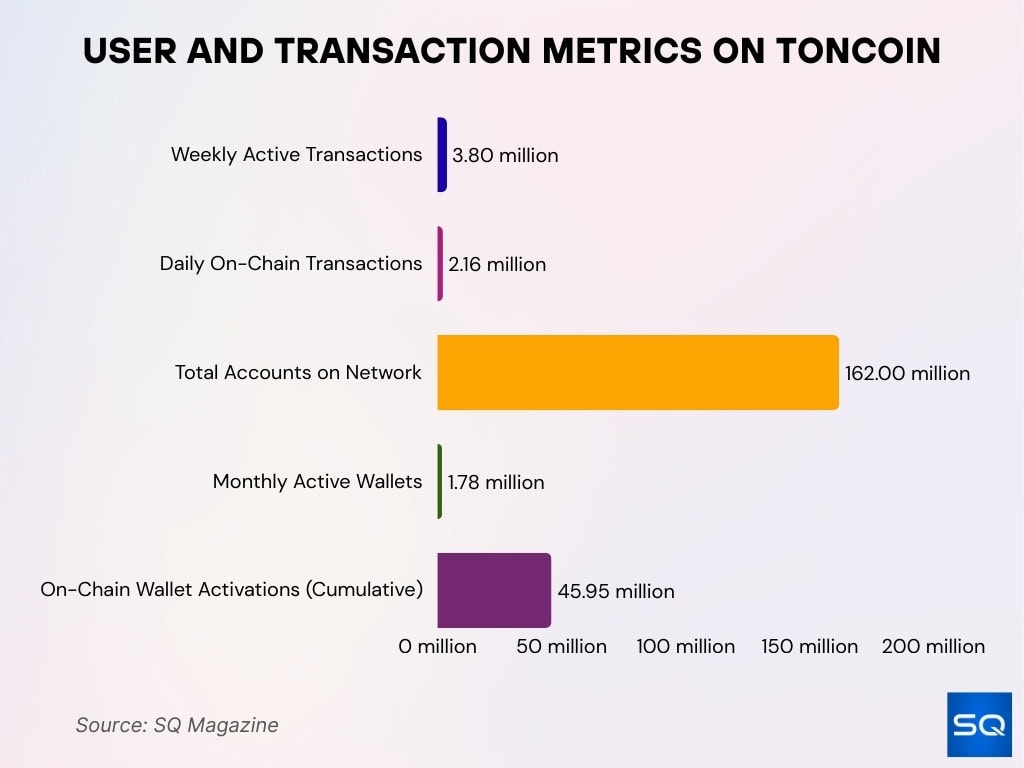
- Weekly active transactions hit 3.8 million, marking a 32% increase.
- Daily on-chain transactions hold steady at 2.16 million, showing stable throughput.
- Total network accounts surpassed 162 million overall.
- Monthly active wallets are around 1.78 million, reflecting healthy user engagement.
- Cumulative on-chain wallet activations reached 45.96 million.
On‑Chain Activity
- Daily transactions on Toncoin (TON) average ≈ 2.16 million.
- On-chain wallet activations are over 48.5 million as of November 2025.
- New wallet activations per day hover around 43,600 per day.
- Daily active wallets are approximately. 155,364, with monthly active wallets near 1.78 million.
- Daily wallet activations (cumulative) show ≈ 65,959 activations for the month‑to‑date metric on TonStat.
- In August 2025, one weekly window saw ≈ 3.8 million transactions, a 32% increase week‑on‑week.
- Daily active address counts reportedly surged to the “top 4” among major layer‑1 chains, reaching ~500,000 daily in recent snapshots.
- Across 2024, TON’s daily active addresses expanded from ~26,000 in January to ~902,737 by September, a growth of ~3,435%.
Active Wallet Statistics
- On‑chain activated wallets total at least ≈ 48.48 million according to TonStat metrics.
- Daily active wallets, ~160,420 in recent snapshots.
- Monthly active wallets approximate ~1,745,196 for the recent month‑to‑date period.
- Daily new wallet activations are ~65,959.
- Daily transactions ~2.07 million as per TonStat’s recent daily figure.
- For the one‐month period shown, on‑chain metrics suggest sustained growth (no sudden drop in wallets).
- First‑time user transactions reportedly account for ~38% of total demand, indicating a meaningful share of wallet activations are new users.
Toncoin (TON) Price Forecast
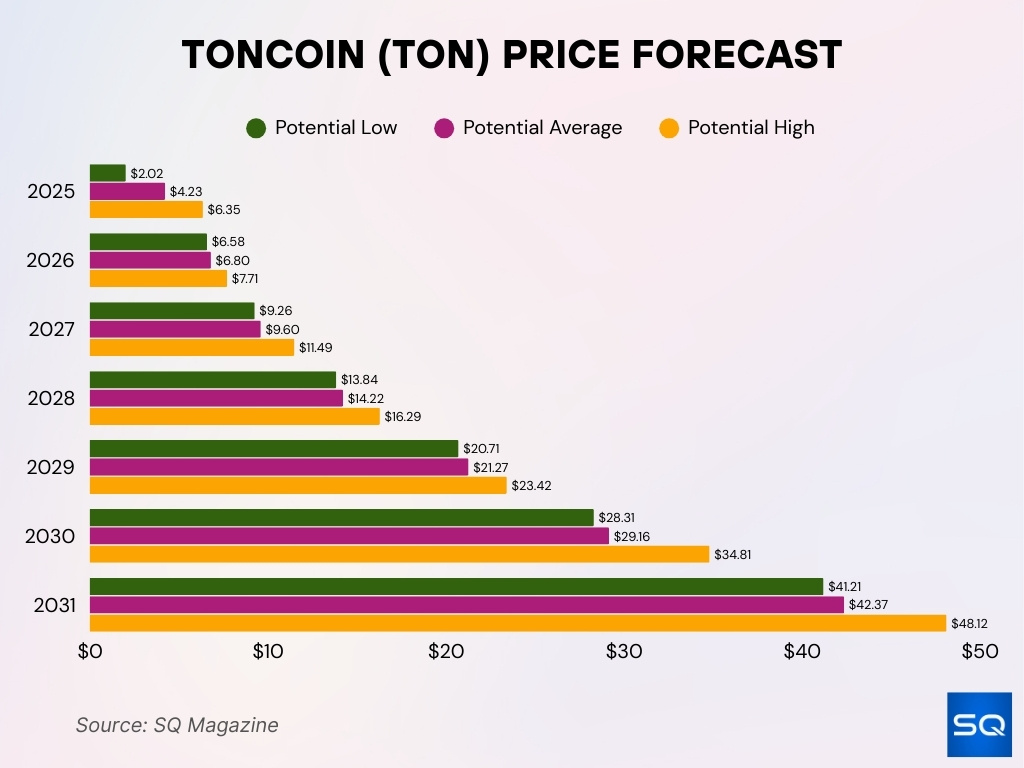
- 2025 forecast ranges from $2.02 to $6.35, averaging around $4.23.
- 2026 estimate rises to $6.58–$7.71, signalling growing momentum.
- 2027 projection shows a move between $9.26 and $11.49.
- 2028 outlook expects prices between $13.84 and $16.29, averaging $14.22.
- 2029 forecast jumps to $20.71–$23.42, reflecting strong upside.
- 2030 prediction points to a high of $34.81 and an average of $29.16.
- 2031 forecast suggests a peak at $48.12, with a low of $41.21 and average at $42.37, implying a 20x+ return from 2025 levels.
Validator and Staking Data
- Number of active validators securing the network: ~340 nodes.
- Total TON staked under validation, ~667.3 million TON.
- Liquid staking protocols hold over 60.73 million TON.
- One protocol, Tonstakers, controls ~80% of the TON liquid staking market by TVL.
- Staking reward (APR) for TON is currently around 2.40%–4.00% annually.
- Annual inflation (issuance) tied to staking and validators is cited at approximately. 0.3%–0.6% per year.
- The minimum self‑stake/nominator requirement for a validator is reported in the tokenomics breakdown, ~300,000 TON.
- As part of issuance control, about 1.08 billion TON were frozen in inactive accounts until 2023 for 48 months via governance vote.
Annual Inflation and Burn Rate
- Annual inflation rate for TON is estimated to be around 0.56% in 2025.
- Daily minting of new TON tokens averages ~88,137 TON per day.
- Daily burn rate of TON is roughly 3,140 TON per day.
- TonStat records a daily burn figure of ~2,821 TON and a daily issuance of ~88,871 TON in its snapshot.
- According to tokenomics, 50% of network fees (transaction + storage) are burned, helping offset issuance.
- In January 2025, inflation rose to ~0.37% from ~0.337% previously, while daily burn dropped to <6,000 TON in one snapshot.
- The metric “daily minting minus burning” indicates net supply growth is modest, helping maintain token scarcity.
Toncoin Exchange Inflows and Selling Pressure
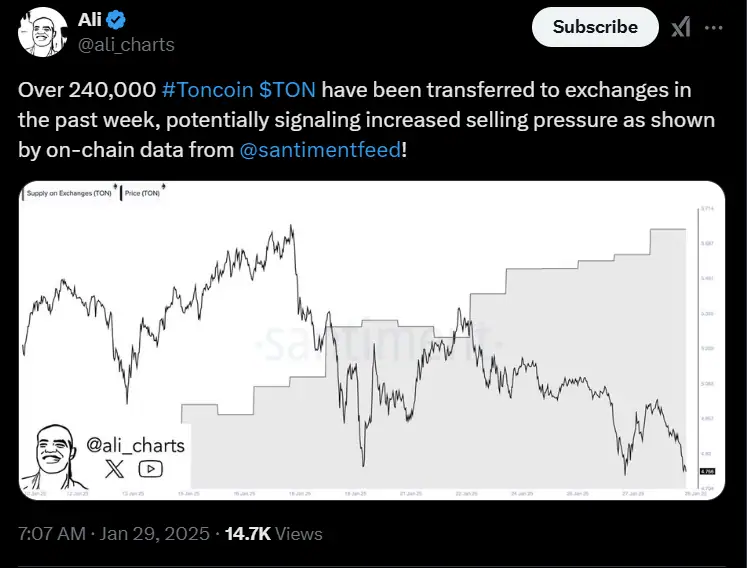
- Over 240,000 TON were sent to exchanges in 1 week as of January 29, 2025.
- The spike in transfers signals rising selling pressure on-chain.
- The exchange supply of TON increased throughout the last week of January.
- As inflows grew, TON’s price dropped below $2.60, down from $2.90+ earlier that month.
- The inverse trend between price and exchange supply suggests bearish momentum is building.
- This pattern often indicates upcoming short-term corrections or profit-taking.
DeFi Metrics and Total Value Locked
- Toncoin network TVL stands at approximately $158.9 million in November 2025.
- Stablecoins circulating on the network have a market cap of $837 million, up ~0.64% over the past 7 days.
- Daily DEX trading volume on the network is approximately $3.32 million.
- Over the past 24 hours, the network collected approximately $6,299 in fees and generated around $3,149 in revenue.
- DEX vs. centralized exchange dominance on the network remains low at about 0.02%, indicating most trading occurs on CEXs rather than native DEXs.
- According to mid‑2025 data from an alternate source, TVL had reached $155.23 million with daily chain fees at ~$17.388 million.
- Liquid staking on the network shows ~63.13 million TON locked, reflecting user participation beyond just exchange trading.
NFT and Asset Statistics
- The Toncoin (TON) ecosystem reportedly sees $3 million to $9 million in daily NFT collectible gift volume as of mid‑2025.
- Developer metrics cite over 34,321 unique smart contracts and 10,938 estimated developers active on the Open Network (TON) chain as of June 2025.
- TON’s chain is ranked #40 by Total Value Locked (TVL) among blockchains.
- On the TON chain, stablecoin market cap stands at around $729 million, with a 7‑day growth of ~3.5%.
Top Holders and Distribution
- The top 10 TON addresses hold 62.19% of all tokens, the top 20 hold ~71.08%, the top 50 hold ~85.78%, and the top 100 hold ~92.16%.
- The feature of concentrated holdings suggests that fewer wallet addresses control the majority of supply, which may raise liquidity risk or sell‑pressure risk.
- Circulating supply is about 2.57 billion TON as of November 2025.
- From that supply, a substantial portion remains non‑circulating or held in large addresses, possibly including staking or reserves.
- The degree of unlocking schedules, vesting or strategic holdings is less publicly transparent but implied by supply vs circulating metrics.
- Exchange holdings and large‑wallet flows appear to remain a dominant share of tradable tokens.
- Because large holders control a sizable portion, any shift in their behaviour could influence price dynamics more sharply.
- Monitoring large‑address behaviour, vesting unlocks and staking flows becomes more important for understanding supply risk.
Exchange Listings and Liquidity
- The Toncoin token is listed on major exchanges, including Binance, e.g., TON/BTC, TON/USDT.
- Toncoin’s 24‑hour trading volume is ~$133 million, and the volume‑to‑market‑cap ratio is about 3.59%.
- Certain platforms list TON pairs with daily volumes in the tens of millions of $, e.g., KuCoin ~$9.87 million trading in TON/USDT.
- Some newer listings and improved liquidity corridors are reported via recent integration announcements in 2025.
- Lower liquidity for large trades may increase slippage, volatility or price impact.
- Checking order‑book depth, bid‑ask spreads, and exchange pair liquidity remains important.
Major Partnerships and Integrations
- Toncoin’s integration with Telegram reached over 100 million wallet addresses in 2024.
- In November 2025, TON spot trading launched globally on several major exchanges, including Coinbase and Revolut.
- Toncoin’s Total Value Locked (TVL) in DeFi protocols exceeded $540 million as of late 2024.
- Over 800 million active Telegram users can access Toncoin payments and wallets via integration.
- Fiat on-ramp integrations like Ramp Network facilitate the purchase of Toncoin through Apple Pay, Google Pay, and bank transfers worldwide.
- Tokenization of real-world assets on TON’s blockchain includes projects handling over $500 million in tokenized Telegram debt.
- The TON Foundation planned a $400 million treasury to support ecosystem growth and partnerships.
- Toncoin trading volume reached over $5 billion in total spot volume in 2025, with monthly peaks surpassing $1.1 billion.
- The ecosystem supports mini-apps and GameFi, contributing to a 22.8 million active wallet addresses increase (2468% YoY growth) in 2024 due to Telegram integration.
Future Outlook and Projections
- Price-forecast modelling suggests Toncoin could reach a high of $6.35 in 2025 under bullish conditions.
- Daily active addresses are approximately 500,000 as of November 2025.
- Total Value Locked (TVL) peaked at around $770 million mid-2025 and declined to about $158.9 million in November 2025.
- TVL has dropped by over 70% in the past quarter, reflecting regulatory and market pressures.
- Active wallet addresses may reach between 16 and 20 million by the end of 2025 due to continued adoption.
- Staking APR is projected to moderate around 3.58% in late 2025, with staking activity increasing by over 30% year-to-date.
- Over 87 million U.S. Telegram users now have access to TON wallet mini-apps, driving transaction volume growth.
- Monthly active wallets reached about 1.78 million in mid-2025, showing sustained engagement.
- Transaction volume surged by 32% in August 2025, topping 3.8 million transactions in a week.
Frequently Asked Questions (FAQs)
The 24‑hour trading volume is approximately $131.3 million.
Daily transactions exceed 2.16 million.
Wallet activations (cumulative) reach over 48.5 million.
The annual inflation rate is about 0.56%.
Conclusion
The Toncoin ecosystem presents a compelling mix of solid infrastructure (via Telegram integration), active on‑chain usage and a growing asset or collectible layer. At the same time, metrics such as high supply concentration, modest TVL, and liquidity depth flag caution for large‑scale investors. For U.S. audiences and global observers alike, the key takeaway is that Toncoin is transitioning from “emerging” to “maturing”, but has not yet reached full mainstream financial‑asset status. As you evaluate Toncoin’s potential, monitor unlocking schedules, large‑holder behaviours, and real‑use‑application adoption inside Telegram and beyond.


