In the rapidly evolving Web3 environment, bug bounty programs targeting smart contracts have become a cornerstone for securing decentralized applications. Companies running decentralized finance (DeFi) platforms, token bridges, and marketplaces routinely turn to crowd-sourced security researchers to expose vulnerabilities before they’re exploited.
For example, a DeFi protocol on Immunefi’s platform capped its critical-bug bounty at $500,000, signalling how seriously high-stakes these programs have become. In another case, automated vulnerability research disclosed 10 high-value smart contract bugs totalling over $3 million in rewards. Whether you’re launching a blockchain project or securing an existing ecosystem, understanding the current statistics behind smart-contract bug bounties is essential. Explore the full article for detailed insight.
Editor’s Choice
- In the first half of 2025, smart contract bugs caused approximately $263 million in damages across Web3.
- Over $65 million was paid in bug bounties for blockchain and smart-contract vulnerabilities in 2023.
- The global smart contract security market reached about $467 million in 2024 and is projected to grow at ~24.7% CAGR from 2025 to 2033.
- In the broader bug bounty platform market (including blockchain), the segment is estimated at $350 million in 2025 and expected to hit $2.1 billion by 2033.
- Immunefi protects over 330 projects and monitors $190 billion in total value locked (TVL) across DeFi.
- For blockchain projects, the average reward for a critical severity bug is about $13,000, while high-severity bugs ~$5,300.
- AI-powered exploits in smart contracts have surged by 1,025% in 2025, mainly targeting APIs and inference weaknesses.
Recent Developments
- H1 2025 saw losses across Web3 of around $3.1 billion, already surpassing the full year of 2024.
- Access-control exploits accounted for roughly $1.83 billion of that loss in H1 2025.
- Automated vulnerability-detection research disclosed 10 bug bounties totalling over $3 million in high-profile deployed code.
- The average payout for critical bugs is $13,000, and for high-severity bugs, it’s $5,300, while the overall average payout (including large outliers) can reach $52,800.
- Many programs operate both public and private invite-only tracks; around 85-90% of programs fall into this dual-mode.
- In 2025, a prominent Layer-2 (Scroll) set its critical bug bounty cap at $1 million.
- Regulatory and audit pressure push more projects to launch formal bug bounty programs as part of release cycles.
- Projects increasingly reward not just the bug finder, but a valid, exploited vulnerability scenario, paying up to 10% of funds at risk in some cases.
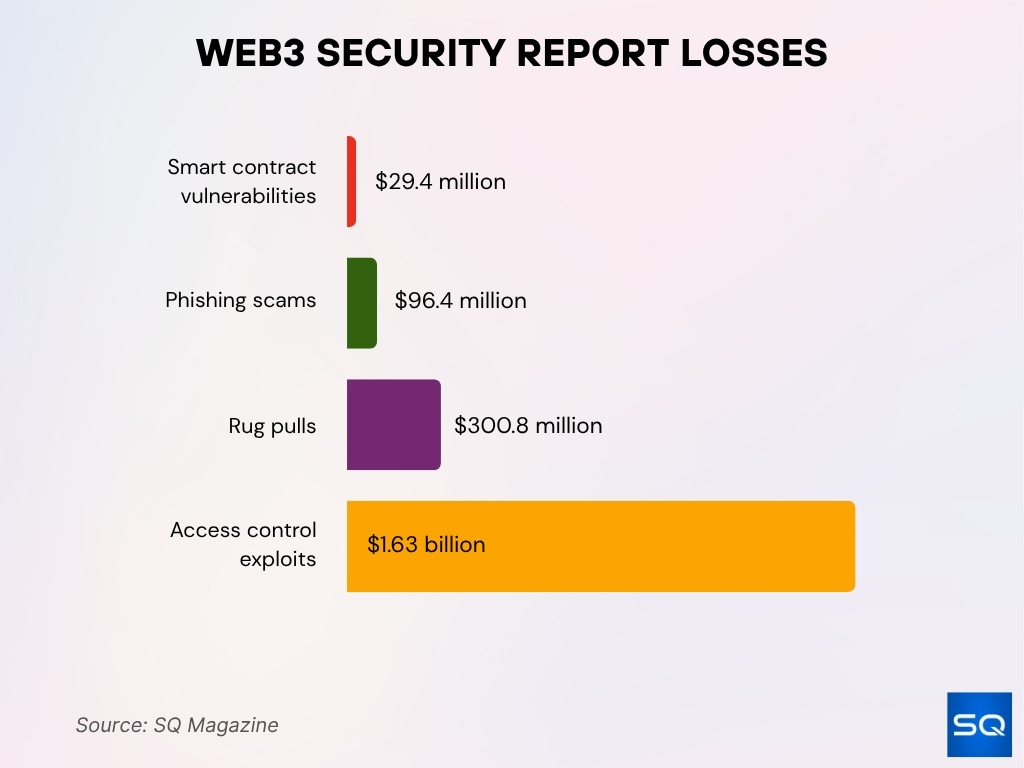
Web3 Security Report Losses
- $2.05 billion in total Web3 losses reported in Q1 2025.
- $1.63 billion was lost due to access control exploits, the biggest contributor.
- $300.8 million in damages from rug pulls across Web3 projects.
- $96.4 million lost to phishing scams targeting users and wallets.
- $29.4 million in losses stemmed from smart contract vulnerabilities.

Overview of Smart Contract Bug Bounty Programs
- Bug bounty programs reward ethical hackers who identify and responsibly disclose vulnerabilities before attackers exploit them.
- In smart-contract contexts, programs often classify bugs by severity (Critical, High, Medium, Low) and set reward ceilings accordingly. E.g., Critical smart-contract bug reports may be capped at $500,000 in some programs.
- Some programs calculate reward as a percentage of funds at risk, for example, 10% of funds affected up to a cap, with minimum payout floors (e.g., $10,000).
- Many projects use platforms like Immunefi to host and triage bug bounty programs, managing submissions and payouts.
- Audit competitions combine bounty programs with fixed-reward pools (e.g., a pool of $125,000 for a competition targeting a specific smart-contract product).
- The scope of bug bounty programs has expanded to invite-only private tracks for sensitive protocols, alongside open public tracks for broader coverage.
- Projects now often require proof-of-concept (PoC) and triage by the platform to validate findings and avoid duplicate reports.
- Reward structures are evolving, the minimum critical reward floor is trending upward, $10,000 has become more of a baseline in many programs.
Global Market Size for Smart Contract Bug Bounties
- The global smart contract security market (which includes bug bounties, auditing, and formal verification) reached about $467 million in 2024.
- Forecasts indicate growth at roughly 24.7% CAGR from 2025 to 2033, reaching an estimated $3.95 billion by 2033.
- Bug bounty platform market size estimates for 2025 range from $223 million to $350 million, with 2033 projections spanning $1.2 to $2.1 billion.
- According to one dataset, the smart contracts market overall escalated from $2.63 billion in 2024 to $3.2 billion in 2025 (for the broader smart-contracts industry).
- Regional focus, North America held over 34% of the smart contract market share in 2024.
Smart Contract Developer Salaries by Country
- $132,400 average salary in Singapore, the highest globally.
- $119,000 average in Dubai, among the top-paying regions.
- $118,500 average annual pay in Germany for smart contract developers.
- $107,000 is the average salary in the United States.
- $95,900 is the reported average salary in France.
- $69,000 average salary for developers in Canada.
- $63,800 is the average in the United Kingdom.
- $13,173 annual average salary in India, the lowest on the list.

Platforms and Projects Offering Smart Contract Bug Bounties
- Immunefi has paid out over $115 million to date and lists more than 400 protocols hosting bug-bounty programs.
- Compound DAO offers a maximum bounty of $1,000,000 for critical smart-contract bugs.
- HackenProof reports over $15.7 million in payouts across 200 + bug-bounty programs and 25,000+ submitted reports.
- Roughly 188 million+ in user funds are listed as “protected” via platforms’ programs and associated vaults.
- Approximately 88% of blockchain bug-bounty programs run both public and private tracks.
- General platforms like Bugcrowd and HackerOne increasingly host blockchain projects.
- Reward structures often tie to funds at risk, e.g., 10% of funds affected, capped at $1 M.
- The average time to first confirmed vulnerability on Immunefi is about 12 days post-program launch.
Program Participation Statistics
- In Q1 and Q2 of 2025, bug-bounty platforms registered over 8,500 white-hat disclosures in blockchain/DeFi.
- Around 50–70% of submissions are rejected (duplicates, false positives).
- Only about 5% of reports are classified as critical severity.
- HackenProof shows 25,000+ total received reports across its ecosystem.
- Researcher hit-rate (valid impactful vulnerabilities) is around 52%.
- Monetary incentive is ranked as the top motivator for participants.
- Projects typically see dozens to several hundred unique researchers per program.
- Approximately 9% of all bug-bounty programs are blockchain/DeFi related.
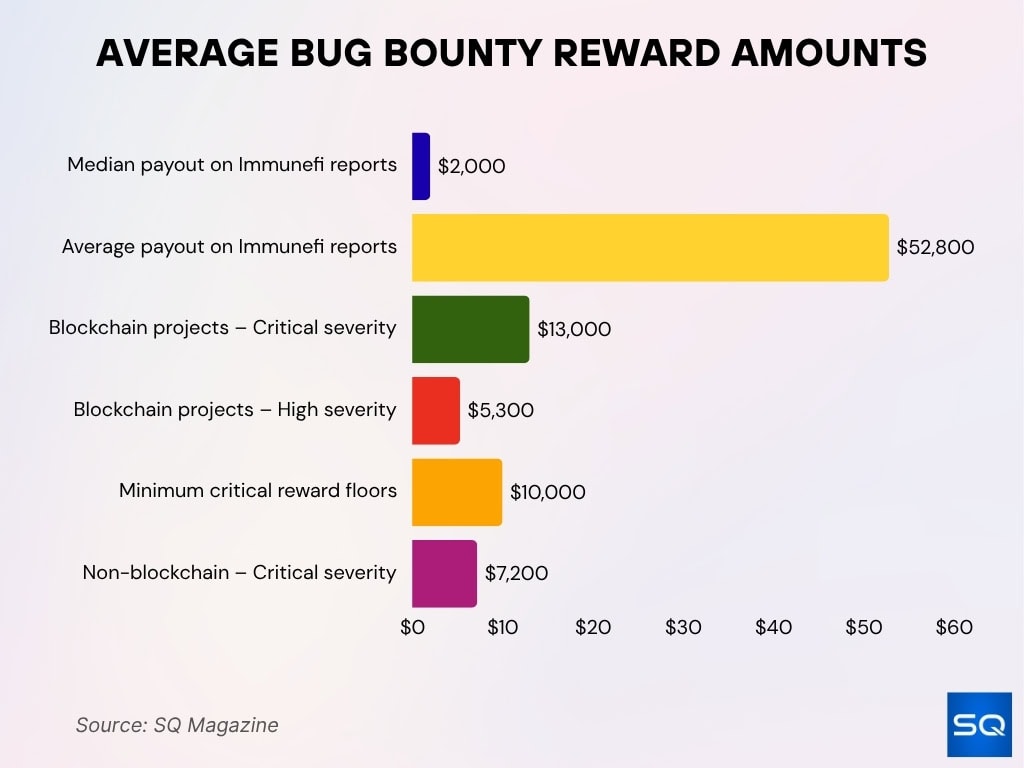
Average Bug Bounty Reward Amounts
- $2,000 is the median payout on confirmed Immunefi reports, with an average of ~$52,800.
- $13,000 is the average critical-severity reward for blockchain projects.
- $5,300 is the average payout for high-severity blockchain bugs.
- $10,000 is a common minimum floor for critical rewards across many programs.
- $7,200 is the average critical reward in non-blockchain bug bounty programs.
- A few large critical payouts represent a majority of the total distribution.
- Average rewards are increasing over time as bounty budgets grow.

Adoption Rates of Bug Bounty Programs Across Blockchains
- Ethereum projects have paid out over $7.6 million in bug bounties.
- On Cardano, payouts in 2025 reached roughly $850,000.
- Scroll set a cap of $1,000,000 for critical bugs.
- Immunefi-based programs now exceed 330 protocols.
- Blockchain/DeFi projects form about 9% of bug-bounty programs.
- Adoption grows fastest in North America and Asia-Pacific, with North America holding ~34% market share.
- Minimum critical reward floors have moved up to $10,000.
Number of Critical Bugs Reported and Fixed
- Ten high-value smart-contract vulnerabilities yielded over $3 million in bounty payments.
- About 77.5% of bounties on Immunefi went toward smart-contract bug reports.
- Many programs cap critical-bug payouts at $50,000, though some scale higher by funds at risk.
- The median payout for smart contract bounties is $2,000.
- Non-upgradable contracts tend to assign higher critical-bug rewards.
- Many critical vulnerabilities remain undisclosed due to private tracks and NDAs.
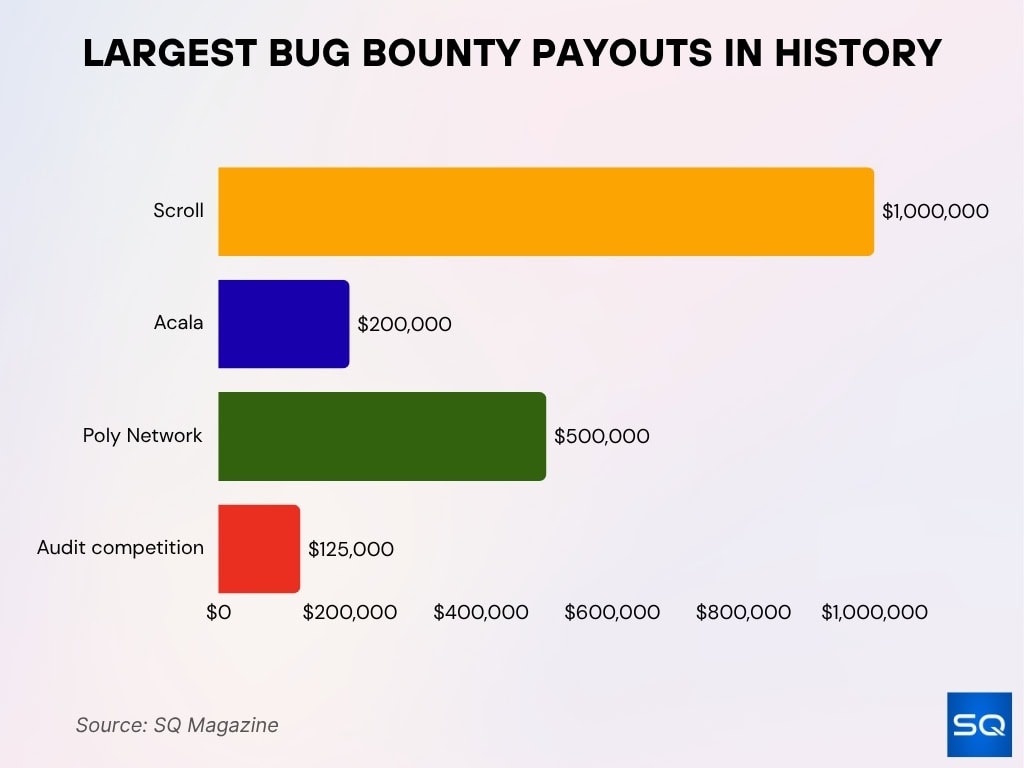
Largest Bug Bounty Payouts in History
- Scroll offers a maximum bug bounty payout of $1,000,000.
- Acala caps its critical bug rewards at $200,000.
- Six-figure payouts have been awarded for major reentrancy exploit discoveries.
- Poly Network gave a $500,000 reward to a white hat for disclosure.
- $125,000 has been awarded in single events through large audit-competition pools.
- Some payouts rival traditional institutional audit budgets.
- Confidential high-value bounties have helped set new industry benchmarks.

Severity Distribution of Reported Bugs
- Access-control vulnerabilities accounted for approximately $953.2 million in losses in 2024.
- Logic errors contributed $63 million in losses.
- Critical bugs represent less than 5% of submissions yet consume large payout budgets.
- Medium- and low-severity reports form the majority by volume.
- Smart-contract bugs caused about $263 million in damages in H1 2025.
- Reentrancy and flash-loan vulnerabilities remain high-severity issues.
- Public programs classify bugs by three tiers: Critical / High / Medium.
- Severity classification improvements are helping programs calibrate payouts.
Financial Losses Prevented by Bug Bounty Programs
- Bounty programs via Immunefi claim to have prevented over $25 billion in potential losses.
- In H1 2025, Web3 saw ~$3.1 billion in losses, showing bounty impact.
- Total losses from access-control bugs in smart contracts topped $1.83 billion in H1 2025.
- Some programs tie rewards directly to “funds at risk,” typically 10%.
- Projects allocate 5-10% of TVL to bug-bounty budgets.
- Bounties lower total losses per incident compared with audits alone.
- Many projects now include “ bounties paid ” in security disclosures.
- Prevention via bounties remains intangible but increasingly tracked.
Time-to-Resolution for Submitted Vulnerabilities
- On Immunefi, the average time to first valid vulnerability is 12 days.
- Median payout reports (~$2,000) resolve within several weeks.
- Duplicate/false submissions (50-70%) delay triage and fixing.
- Private programs show faster resolution than fully public ones.
- Some projects impose minimum reporting windows (e.g., 72 hours).
- Over 60% of programs now publish fix-status within 30 days.
- Programs with TVL > $100 million often face governance-timelock delays.
- Some initiatives aim for “24-hour first contact” with researchers.
Trends in Smart Contract Bug Bounty Participation
- Immunefi’s total payout crossed $100.21 million, with 87.8% of bounties marked critical.
- Web3 bug-bounty scopes continue to grow year-over-year.
- Platforms now host more multi-chain and cross-protocol programs.
- Researcher participation increasingly uses AI and automation tools.
- Roughly 9% of global bug bounty programs target blockchain/DeFi platforms.
- About 50–70% of all bug bounty reports are duplicates/false positives per platform statistics.
- About 80% of programs now run both private and public tracks.
- Launch-to-first-report time averages about 12 days.
Impact of AI and Automation in Vulnerability Detection
- The market for smart contract vulnerability-detection AI reached $412.6 million in 2024 and will hit $3.89 billion by 2033.
- AI has become a key tool for detecting flaws that traditional audits miss.
- AI vulnerability-detection frameworks achieve over 90% accuracy.
- Automated tools currently prevent only about 8% of real-world attacks.
- Attack profitability (~$6,000 per exploit) still outpaces defender break-even (~$60,000).
- AI-powered “security agents” simulate contracts and alert in real time.
- More programs now accept machine-generated reports with human triage.
- Human review remains essential for logic and design layer flaws.
- Dynamic reward models now use AI risk analytics to set payouts.
Regulatory and Compliance Statistics
- 81% of healthcare providers using blockchain smart contracts report improved compliance.
- 64% of developers cite data-localization as a major compliance hurdle.
- 49% of public blockchain contracts expose sensitive metadata.
- 22% of organisations faced fines for non-compliance in 2024.
- 77% of blockchain organisations report improved transparency.
- 61% of trade smart contracts fail at least one local regulation.
- 29% of trade-finance contracts include automated compliance checks.
- 50% of European regulators recognise blockchain contracts as enforceable.
- Smart-contract audit costs range from $25,000–150,000.
Common Smart Contract Vulnerabilities Statistics
- Access-control flaws led to $953.2 million in losses.
- Logic/business-logic flaws caused $63 million in losses.
- Over $1.8 billion was lost in DeFi hacks due to smart-contract bugs in 2023.
- The OWASP Smart Contract Top 10 (2025) was based on 149 incidents.
- About 59% of Ethereum transactions involve multiple contracts.
- Reentrancy, timestamp, and overflow issues remain the top vulnerabilities.
- Three of the most-depended-upon contracts in Ethereum are mutable.
- Control-flow-integrity frameworks blocked 28 of 30 attack scenarios.
- Audits still find logic bugs as the hardest to detect automatically.
Frequently Asked Questions (FAQs)
Smart contract vulnerabilities caused approximately $263 million in damages across Web3 platforms in the first half of 2025.
As of 2025, Immunefi has paid out $100.21 million in total bounties, with 77.5% of these payouts going to smart contract bug reports.
Critical smart contract bugs typically receive a minimum of $10,000 and can reach up to $1,000,000 in exceptional cases like those on Scroll or major DeFi chains.
The global bug bounty platforms market was valued at $1.76 billion in 2025 and is projected to reach $5.74 billion by 2034, growing at a CAGR of 15.94%.
Conclusion
The statistics today reveal a smart-contract bug-bounty ecosystem that is maturing rapidly. From growing participation, higher average payouts, and dynamic reward models, to the growing role of AI in vulnerability detection and more stringent compliance frameworks, the data show a system under evolution. Yet the risk remains real; multi-contract dependencies, logic flaws, and novel exploit techniques continue to drive losses in the billions.
For project owners, security teams, and developers alike, the message is clear: embed bug-bounty programs early, incorporate AI and automation wisely, and stay aligned with evolving regulatory landscapes if you want to protect value and limit risk. The full article has unpacked these themes across multiple dimensions. Explore the detailed sections above to understand the full statistical landscape.


