LinkedIn has become a central hub for professional networking, career development, and B2B marketing. As the platform evolves, the balance between mobile and desktop usage is shifting, influencing how users interact with content and how advertisers design their campaigns. From corporate recruiters reviewing profiles on desktops to sales professionals networking via mobile on the go, device choice impacts engagement patterns and marketing strategies. This article explores the latest statistics, trends, and implications, giving readers a clear view of how device usage shapes LinkedIn in 2025.
Editor’s Choice
- LinkedIn usage estimates, approximately 57% of total traffic comes from mobile devices when combining mobile web and app usage, though desktop remains the primary environment for job applications and long-form content.
- Between August and October 2024, SimilarWeb reports 31.42% traffic from mobile web and 68.58% from desktop.
- Between August 2024 and January 2025, desktop accounted for 74.24% of LinkedIn visits, and mobile just 25.76%.
- Report estimates that when including both mobile app and mobile web traffic, LinkedIn activity reaches roughly a 70% mobile vs 30% desktop split, with desktop still seeing strong usage among office-based professionals.
- Nearly 70% of LinkedIn users access the platform on a mobile device.
- In February 2025, LinkedIn received 1.77 billion monthly visits.
- LinkedIn has 1.2 billion members worldwide as of early 2025.
Recent Developments
- LinkedIn’s monthly page views reached 1.77 billion in February 2025.
- There are now over 1.2 billion registered members, marking significant growth in professional networking participation.
- Age demographics show 47.3% of users are 25–34, 28.7% are 18–24, and just 3.3% are 55+.
- In the U.S., about 32% of adults use LinkedIn, on par with TikTok’s usage.
- Globally, 56.9% of users are male and 43.1% are female.
- In the U.S., the gender split is 55% male, 45% female.
- LinkedIn’s internal data indicates that members share an estimated 2 million posts, articles, and videos daily, spanning both personal and corporate content.
Brand Posting Frequency Insights
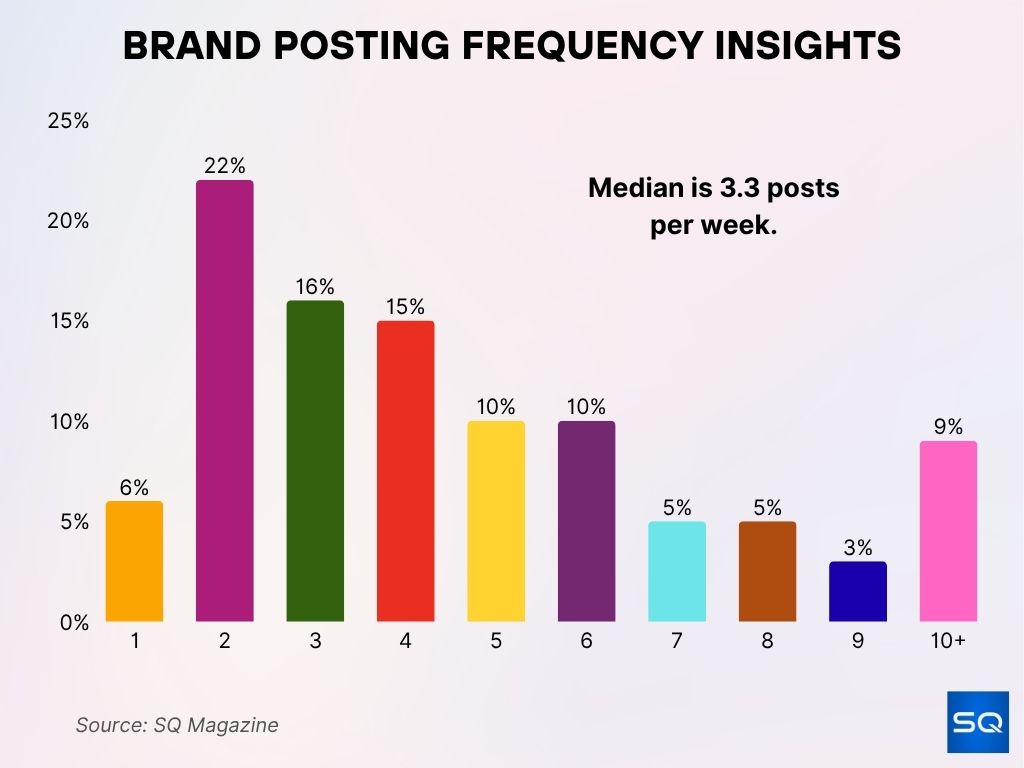
- The median posting frequency across brands is 3.3 posts per week.
- 22% of brands post twice per week, making it the most common posting frequency.
- 16% of brands post three times per week, closely aligning with the overall median.
- 15% of brands post four times per week, showing strong weekly engagement.
- Moderate posting rates (5–6 posts per week) are adopted by 10% of brands each.
- High-frequency posting of 10+ posts per week is done by 9% of brands.
- Very low posting activity (once per week) is seen in 6% of brands.
- Rare posting levels (7–9 posts per week) each account for only 3–5% of brands.
LinkedIn Mobile vs. Desktop Overview
- Mobile access ranges widely depending on the source, from 25.8% to 70% of visits.
- The 31.42% mobile / 68.58% desktop split noted by SimilarWeb highlights that desktop use remains significant.
- Some analyses argue that 57% of total LinkedIn traffic comes from mobile, suggesting a mobile preference.
- Nearly 70% of users access via mobile, a figure that aligns with growing mobile adoption trends.
- In-office behavior still supports desktop dominance for certain tasks, even amid growing mobile use.
- Variance in data underscores the fluid nature of device usage patterns across geographies and user intent.
- Given such variability, marketers should tailor strategies across both platforms.
Percentage of LinkedIn Users on Mobile vs Desktop
- Between August 2024 and January 2025, desktop accounted for 74.24% of LinkedIn visits, with mobile making up 25.76%.
- A SimilarWeb snapshot from late 2024 showed 31.42% of traffic from mobile web compared to 68.58% from desktop.
- Some aggregate platform analyses estimate 57% of total LinkedIn traffic comes from mobile devices, indicating a majority mobile share.
- Other marketing reports suggest a 70% mobile vs 30% desktop split, reflecting the impact of the LinkedIn mobile app, which is not included in mobile web traffic stats.
- Nearly 70% of active members reportedly log in via mobile at least once a month, aligning with global mobile-first internet trends.
- LinkedIn’s own product positioning emphasizes mobile as a primary touchpoint for networking, content engagement, and ad delivery.
- Office-based professionals still contribute heavily to desktop usage, especially during weekday business hours.
- Mobile access tends to dominate in regions like Asia, Africa, and Latin America, while desktop retains a stronger share in North America and Western Europe.
- Variations between data sources highlight that the mobile vs desktop split can look very different depending on whether mobile web, native app, or both are included.
LinkedIn Dominates as Top Value Platform for B2B Marketers
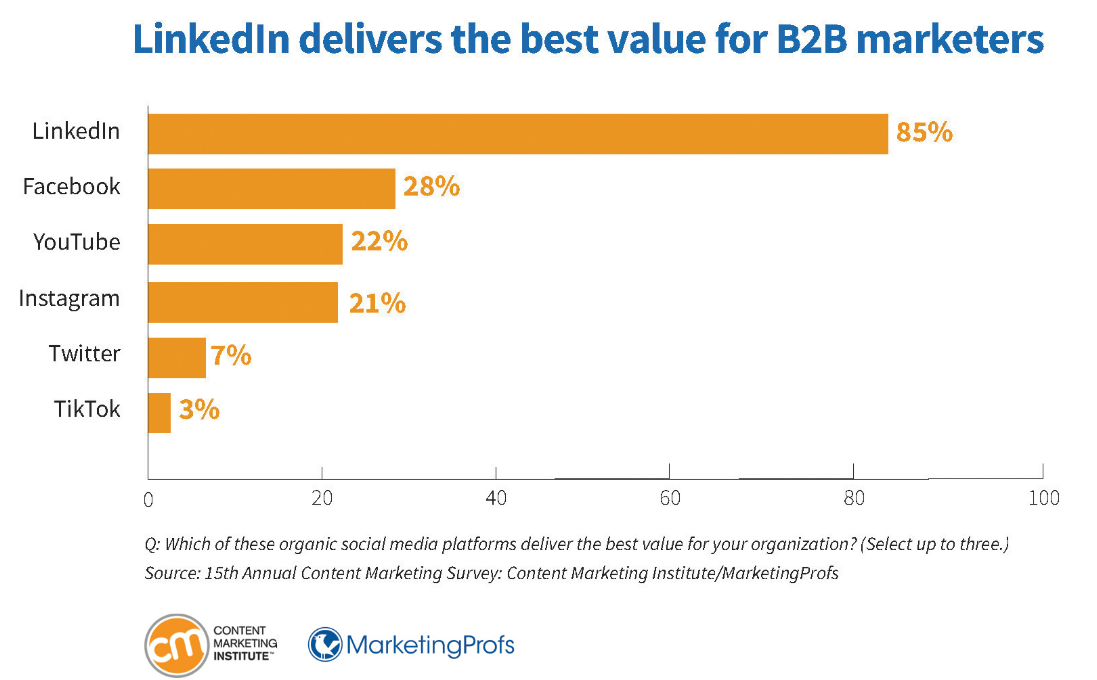
- LinkedIn leads overwhelmingly, with 85% of B2B marketers saying it delivers the best value.
- Facebook is a distant second at 28%, showing limited preference for B2B value.
- YouTube (22%) and Instagram (21%) have similar mid-tier value ratings.
- Twitter ranks low with just 7% seeing strong value.
- TikTok is last, with only 3% of marketers considering it valuable for B2B.
Mobile Usage Patterns & Behavior
- Mobile session suggests that LinkedIn’s median mobile app session lasts under five minutes, with users primarily engaging with short-form and rich media formats such as videos, carousel ads, and polls.
- Mobile users are more likely to engage with rich media formats such as video, carousel ads, and polls.
- Push notifications on mobile drive immediate interactions, making them valuable for timely announcements or campaigns.
- Mobile usage peaks during commutes, lunch breaks, and evenings.
- The LinkedIn mobile app is the primary access point for many users in mobile-first countries.
- Mobile users are more prone to interact with Stories and casual content compared to desktop users.
- In regions with limited desktop access, mobile is the dominant device for both content consumption and networking.
Desktop Usage Patterns & Behavior
- Between August 2024 and January 2025, desktop accounted for 74.24% of LinkedIn visits, compared to 25.76% mobile.
- Another measure shows 31.42% of traffic came from mobile web, implying 68.58% from desktop.
- A summary finds that 57% of all LinkedIn traffic is via mobile, suggesting desktop still holds a notable share.
- Desktop often dominates for job applications and reviewing longer-form content, especially in professional environments.
- Users tend to favor the desktop during working hours when accessing LinkedIn for deeper tasks.
- Highly detailed tasks, like composing articles, editing profiles, or managing ads, see higher usage on desktops due to larger screens.
- Engagement duration per visit is longer on desktop, especially for content creation and exploration.
Key Drivers of Brand Engagement on LinkedIn
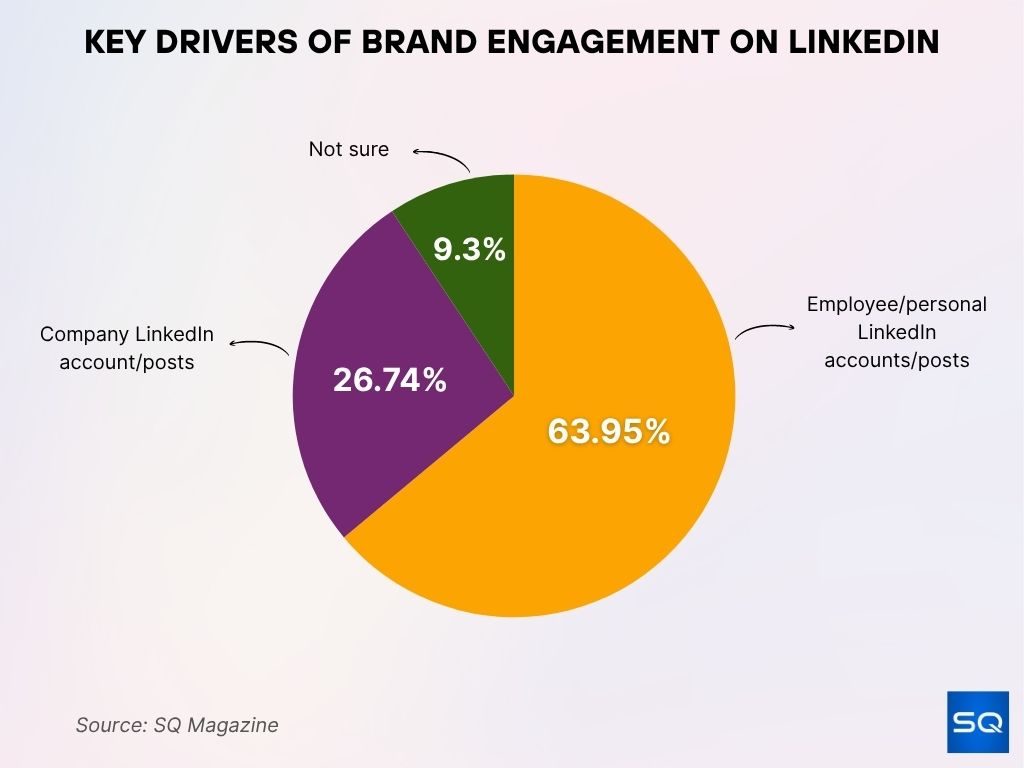
- Employee/personal LinkedIn accounts generate the most engagement, with 63.95% of respondents citing them as the top driver of traffic, leads, and sales.
- Company LinkedIn accounts/posts come in second, driving engagement for 26.74% of brands.
- Only 9.30% of respondents are unsure about which source drives more engagement.
Device Preferences by Industry or Profession
- Precise data on industry or profession-based device preference isn’t publicly available from major reports.
- Professionals in sectors like finance, consulting, or academia may lean more on a desktop for reports, analytics, and long content.
- Roles like sales, recruiting, and field operations might favor mobile for timely messaging and connection on the go.
- The LinkedIn Recruiter app includes features like messaging and candidate tracking, designed for on-the-go recruitment.
- More granular, industry-specific insights are needed to validate these patterns accurately.
Regional Device Usage Patterns
- In North America, about 57% of web traffic is from mobile, indicating a modest preference for mobile browsing.
- Regions like Asia lead with 72.3% of all web traffic coming from smartphones.
- Africa follows at 69.8% mobile usage, while South America is at 62.1%.
- Given these trends, LinkedIn mobile usage likely outpaces desktop in Asia, Africa, and South America.
- North America may lean more toward desktops compared to those mobile-heavy regions.
- Specific LinkedIn data by region would sharpen the picture, but broader web traffic patterns offer strong context.
Marketing Channels Distribution Insights
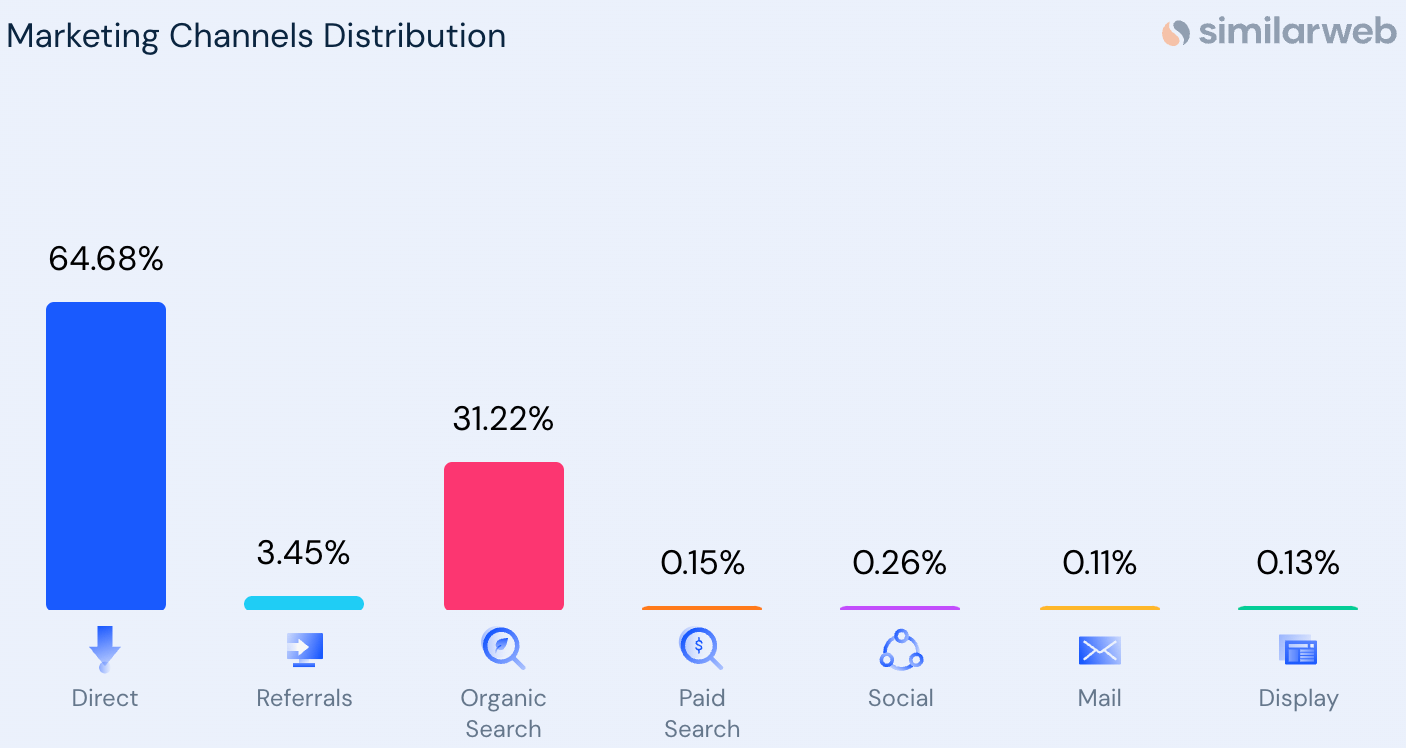
- Direct traffic dominates, accounting for 64.68% of total visits.
- Organic search is the second-largest channel with a 31.22% share.
- Referrals contribute 3.45%, indicating moderate external link traffic.
- Minor channels include Social (0.26%), Paid search (0.15%), Display (0.13%), and Mail (0.11%).
Demographics of Mobile vs Desktop Users
- General age distribution of LinkedIn users: 47.3% are 25–34, 28.7% are 18–24, 20.7% are 35–54, and 3.3% are 55+.
- Gender split: 56.9% male, 43.1% female globally.
- A 2025 campaign reported 55% males (25–34) and 23.3% females (25–34), though figures vary by source.
- There’s no public breakdown of which age or gender groups prefer mobile over desktop on LinkedIn.
- Younger users might gravitate toward mobile, while older professionals may rely more on desktop access.
- Further data on device preference by demographic would help validate those assumptions.
User Engagement Levels: Mobile vs Desktop
- The average LinkedIn post received 11.32 engagements in 2024, up from 8.75 in 2023.
- Approximately 25% of active LinkedIn users engage with branded content daily, including likes, comments, shares, and reactions.
- Nearly 16.2% of US users open the LinkedIn app at least once per day.
- Weekly, 40% of users engage organically with a page on the platform.
- Mobile may drive more frequent, smaller bursts of engagement, while desktop may facilitate longer, focused browsing.
- Tracking engagement via device type would clarify the distinct roles of each.
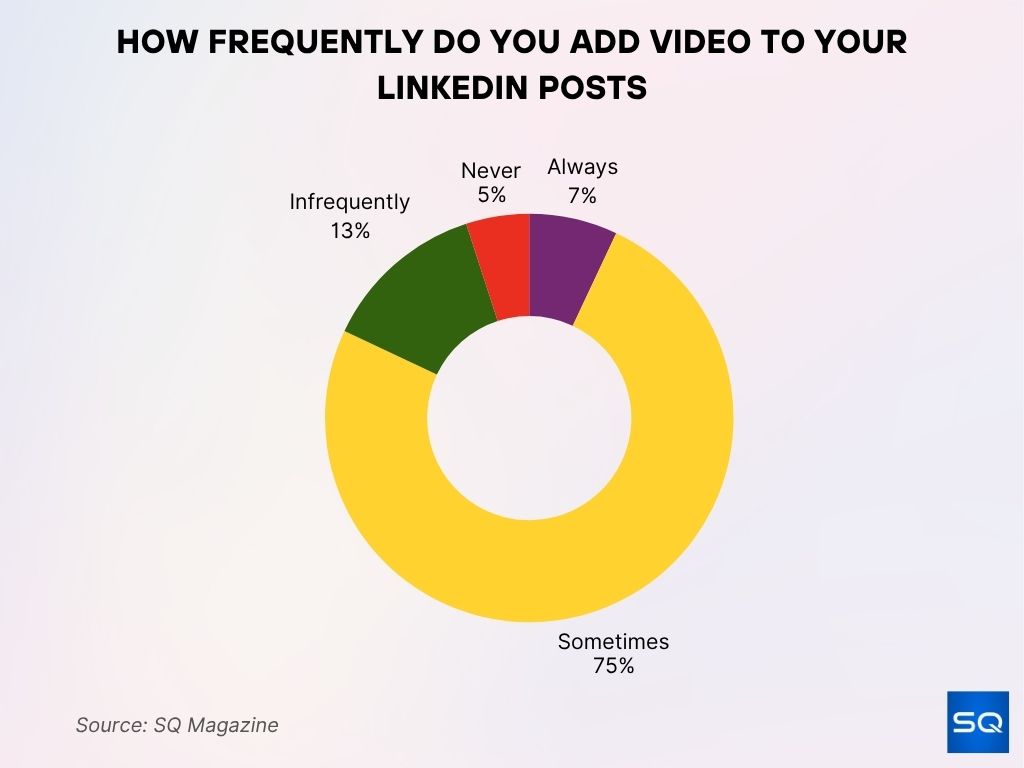
How Frequently Do You Add Video to Your LinkedIn Posts
- Sometimes adding video is the most common approach, chosen by 75% of respondents.
- Only 7% of users always include video in their LinkedIn posts.
- Infrequently adding video accounts for 13% of responses.
- A small 5% of users never add video to their LinkedIn content.
Time Spent on LinkedIn: Mobile vs Desktop
- The average LinkedIn mobile app user spends approximately 48 hours per month on the platform globally, with session length varying by region and profession.
- There’s no public data comparing mobile vs desktop time separately.
- Desktop sessions are likely longer per visit but fewer in number.
- Mobile likely supports more touchpoints, shorter but more frequent visits.
- Additional device-specific time tracking would greatly benefit strategic planning.
LinkedIn Content Consumption by Device
- LinkedIn video uploads increased over 20% year over year in 2025, with comments up 30%, signaling fast-rising feed consumption where mobile usage is typically strongest.
- LinkedIn’s ad reach touched ~1.20–1.29 billion people globally in early 2025, expanding the addressable audience for both mobile and desktop placements.
- On the open web, mobile held ~68.5% of traffic share in July 2025, favoring mobile consumption of professional content.
- For linkedin.com specifically, it ranks #18 globally by traffic (July 2025), underscoring heavy cross-device consumption at scale.
- The LinkedIn Single Image Ads spec explicitly supports vertical 1:1.91 (mobile-only) along with 1:1 and 1.91:1 (both devices).
- LinkedIn continues to invest in original video shows and creator programming, with a 36% year-over-year rise in video viewership.
- App usage signals steady frequency, with 31.4% mobile web vs 68.6% desktop in late 2024, while the native app adds additional mobile-only consumption.
- In the U.S. 2025 snapshot, LinkedIn ad tools could reach 91.4% of adults 18+, a proxy for broad content availability across mobile and desktop surfaces.
- Globally, social users climbed to ~5.41 billion (July 2025), a tailwind for mobile social consumption.
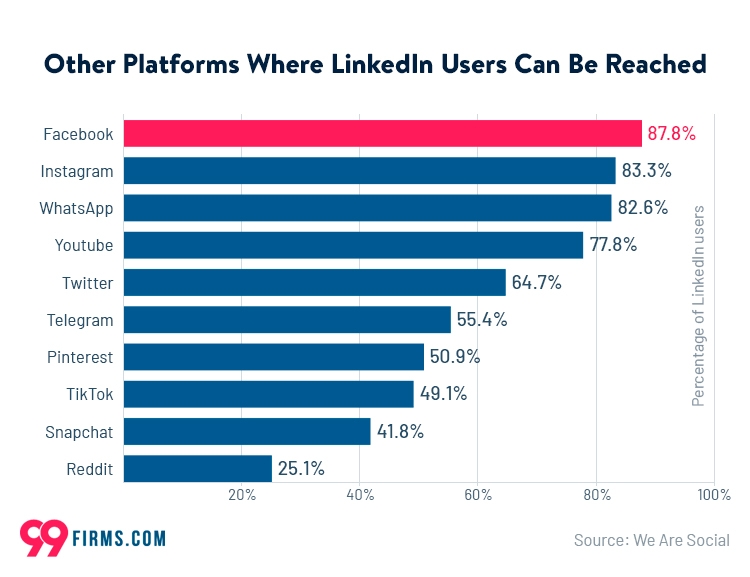
Other Platforms Where LinkedIn Users Are Active
- Facebook reaches the highest share of LinkedIn users at 87.8%.
- Instagram and WhatsApp follow closely, engaging 83.3% and 82.6% of LinkedIn users, respectively.
- YouTube is another major crossover platform, with 77.8% reach.
- Mid-tier platforms include Twitter (64.7%), Telegram (55.4%), and Pinterest (50.9%).
- TikTok reaches 49.1% of LinkedIn users, while Snapchat has 41.8% crossover.
- Reddit has the smallest overlap at 25.1%.
LinkedIn Ad Performance: Mobile vs Desktop
- LinkedIn confirms that Single Image, Video, Carousel, and Event Ads run natively across desktop and mobile (with some creative ratios optimized for mobile only), ensuring parity in delivery.
- Vertical 1:1.91 is mobile-only, nudging advertisers toward mobile-first creative when the goal is thumb-stopping reach in the feed.
- Industry coverage projects LinkedIn ad revenue to reach ~$8 billion in 2025, buoyed by rising video and affluent decision-maker audiences.
- U.S. ad reach = 91.4% of adults 18+ (early 2025), indicating near-universal availability for device-targeted campaigns.
- Global ad reach ~1.20–1.29 billion in 2025 sets the ceiling for scale on both mobile and desktop.
- With mobile holding ~68.5% of overall web traffic (July 2025), expect higher mobile impression share for feed formats, even when landing pages skew to desktop conversions.
- LinkedIn’s Audience Network expands off-LinkedIn inventory, primarily mobile environments, improving reach for top-funnel objectives.
- Microsoft’s FY25 commentary notes LinkedIn revenue up 9% YoY in Q4, indicating resilient advertiser demand despite limited public device breakdowns.
- Actionable reality: LinkedIn does not publicly report CPC/CTR by device, so advertisers should A/B test device bid adjustments and mobile-optimized creative to quantify lift locally.
Trends Over Time: Mobile vs Desktop Usage
- Four consecutive years of double-digit member growth to ~1.2 billion members fuel more mobile feed sessions and desktop use for deep work.
- Video uploads +20% YoY and comments +30% YoY in 2025 point to feed-centric behavior that tends to over-index on mobile for frequent check-ins.
- On the wider web, mobile share has led desktop through 2024–2025, peaking around ~68–69% in mid-2025, a directional indicator for LinkedIn browsing too.
- Regional data shows Asia and Africa are mobile-first online, implying higher relative mobile LinkedIn usage in those regions versus North America.
- U.S. reach saturation (91.4% of 18+) suggests future growth skews to engagement depth and format mix (e.g., video, newsletters) instead of raw audience.
- Creator initiatives and original video shows launched in 2025 indicate a strategic push toward lean-in content consumable on both devices, with mobile benefiting from snackable lengths.
- Company revenue +9% YoY (Q4 FY25) aligns with steady advertiser adoption as usage deepens across devices.
- linkedin.com maintained a top-20 global traffic rank in July 2025, reflecting persistent cross-device demand.
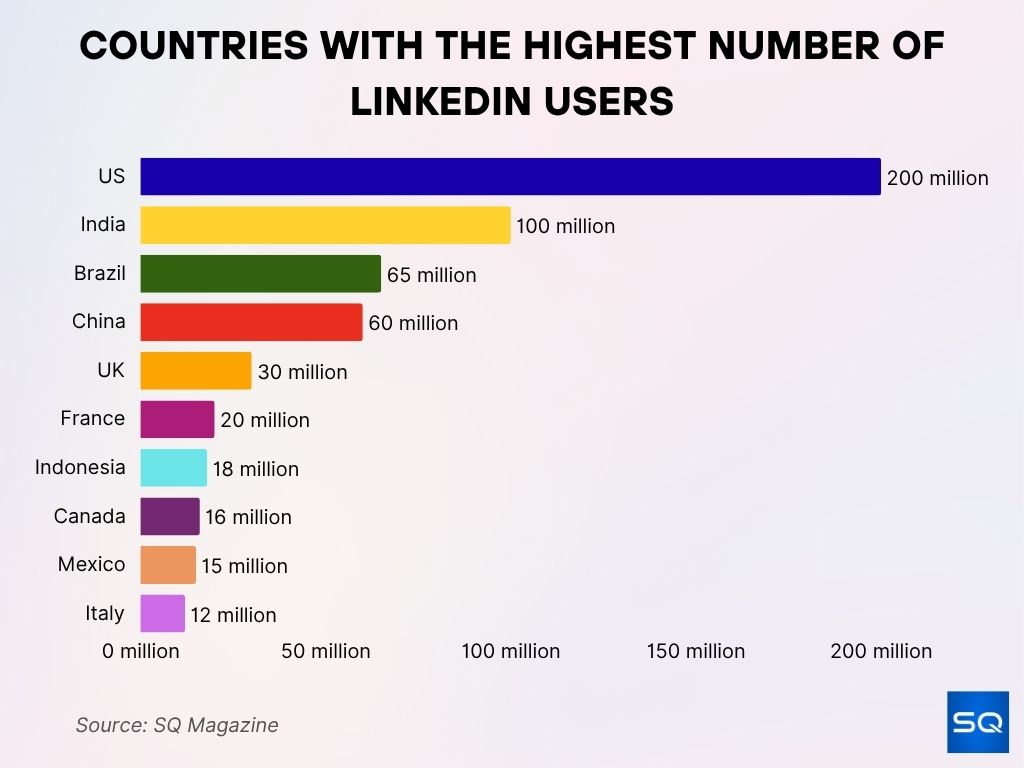
Countries with the Highest Number of LinkedIn Users
- The United States leads globally with 200 million LinkedIn users.
- India ranks second with 100 million users.
- Brazil holds 65 million users, slightly ahead of China with 60 million.
- The United Kingdom has 30 million LinkedIn members.
- Other top countries include France (20 million), Indonesia (18 million), and Canada (16 million).
- Mexico counts 15 million users, while Italy rounds out the list with 12 million.
Implications for Marketers and Businesses
- Expect more impressions on mobile for in-feed formats as global web usage skews ~68% mobile, plan creative and landing pages accordingly.
- Use mobile-optimized ratios (e.g., 1:1, vertical 1:1.91) to raise feed visibility and reduce letterboxing on phones.
- Lean into video, platform-reported +20% upload growth and +30% comments show engagement headroom, especially on mobile.
- For high-consideration B2B actions (demos, RFPs), expect stronger desktop completion rates, align campaign goals and device bid mods to that reality.
- Use U.S. reach (91.4% of adults) for planning TAM, segment creatives by device to test thumb-stopping mobile vs detail-rich desktop variants.
- Consider Audience Network to scale in mobile environments for awareness, then retarget on LinkedIn desktop for form-fill or long-read objectives.
- Ride the creator programming push to sponsor or repurpose a short video that travels well on mobile while remaining credible in desktop feeds.
- Monitor quarterly earnings updates for signals on sessions or engagement to calibrate device weighting over time.
Tips for Optimizing LinkedIn Content for Each Device
- Mobile (feed-first): Use 1:1 or vertical 1:1.91 images, keep copy ≤150 characters intro and ≤70-character headlines for scannability.
- Desktop (detail-first): Link to long-form assets (case studies, product pages) where larger screens help conversion, test longer headlines in Sponsored Content within spec.
- Video: Shorten to ≤15–30 seconds for mobile attention, add captions for sound-off viewing, square or vertical ratios maximize phone real estate.
- Landing pages: Implement responsive design and fast LCP to prevent mobile drop-off (global mobile majority ~68% web share).
- Dayparting: Schedule mobile-heavy posts for commute or lunch windows, reserve desktop-heavy asks (e.g., webinars) for late morning or early afternoon work blocks.
- Creative testing: Run device-level A/B on aspect ratio, CTA length, and landing experience. LinkedIn doesn’t provide public device CTR or CPC, so test locally.
- Format mix: Combine Carousel for product narratives (works on both devices) with Event Ads for registrations that users may complete on desktop.
- Retargeting: Sequence mobile video viewers into desktop conversion campaigns for complex offers.
- Creator integrations: Tap into 2025’s original video shows ecosystem for thought-leadership adjacency that travels well on phones.
Future Outlook: Device Usage Shifts
- Global web consumption remains mobile-led (~68–69% share), expect LinkedIn’s impression distribution to follow that macro line through 2026.
- LinkedIn’s 1.2 billion-member base and consecutive years of double-digit growth imply more mobile session frequency and desktop depth rather than one device “winning”.
- Continued video investment (new creator shows, brand programs) suggests a rising share of vertical and square content optimized for phones.
- AI-assisted features like Hiring Assistant and AI-enhanced job search collectively see usage from around 1 million members each day, driving faster profile reviews and job matching.
- Advertiser demand appears resilient (LinkedIn revenue +9% YoY in Q4 FY25), supporting broader experimentation with mobile-optimized formats.
- Regions with mobile-first internet (Asia, Africa) will likely keep pushing higher mobile shares for LinkedIn, while desktop retains strength in North America or Oceania workplaces.
- Expect limited public device-split reporting to continue; marketers should rely on account-level reporting and experimentation for precise mobile vs desktop ROI.
Conclusion
LinkedIn is expanding fast, ~1.2 billion members, rising video creation, and solid advertiser demand, but public, platform-level mobile vs desktop performance splits remain scarce. The macro internet mix favors mobile for impressions and quick interactions, while desktop still supports complex tasks and conversions. Plan for both, mobile-first creative and landing speed to win the feed, plus desktop-ready depth for demos, documents, and form fills. As AI features and creator video scale, expect more frequent mobile micro-sessions and steady desktop depth, and let your own device-level tests guide budget, bids, and creative for 2025–2026.


