As one of the largest tech companies in the world, Google plays a major role in shaping digital infrastructure, workplace culture, and talent demand. From artificial intelligence research to cloud computing and global ad platforms, its workforce powers the innovation behind billions of daily interactions. For instance, Google’s growing investment in AI has required mass hiring of data scientists, while its restructuring efforts have impacted roles in product and hardware divisions. This article explores how many people work at Google today, along with key breakdowns by role, gender, compensation, and future trends.
How Many People Work At Google?
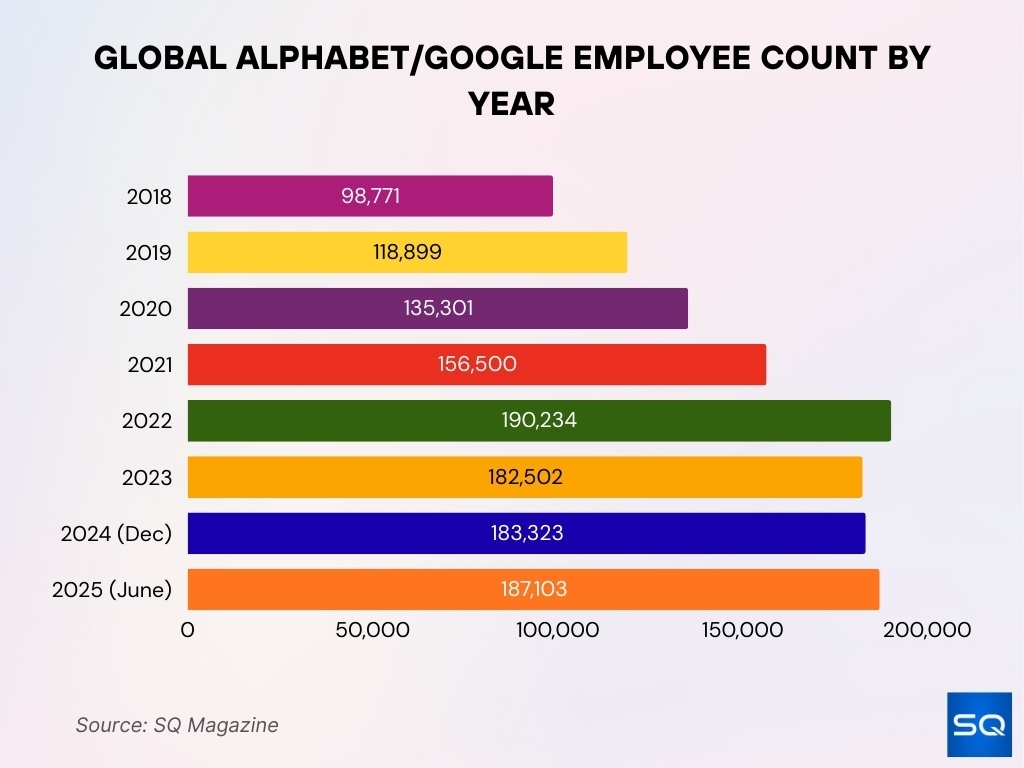
- Alphabet (Google’s parent) had 187,103 employees as of June 30, 2025, a 2.06% increase from the end of 2024.
- At the end of 2024, Alphabet had 183,323 full‑time employees, up slightly (~0.45%) from 182,502 in 2023.
- In January 2025, Google announced it is no longer using aspirational hiring goals tied to diversity for underrepresented groups.
- As of their 2023 Diversity Annual Report, about 65.9% of Google’s global workforce were men, and 34.1% were women.
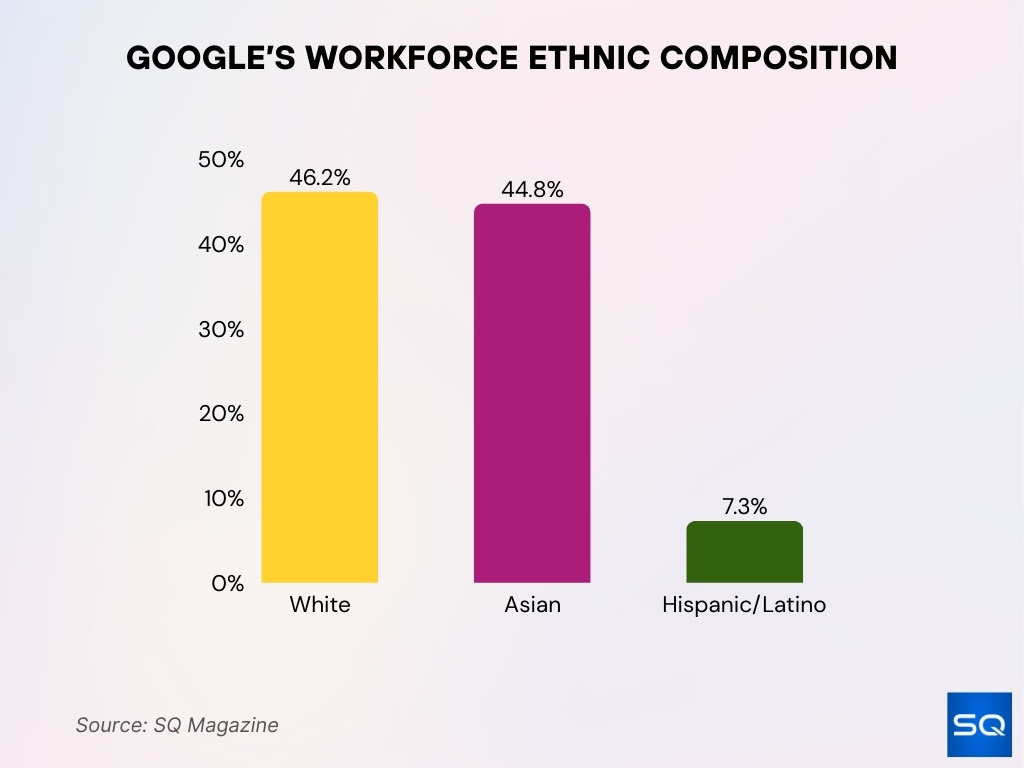
- Ethnicity breakdown (global) from latest reports: White employees ~46.2%, Asian ~44.8%, Hispanic/Latino ~7.3%, small percentages for Black/African American, Native American, etc.
- In tech roles, female representation has been slowly increasing; in 2023‑2024, it was ~25‑27% in tech roles globally.
- The company has over 70 offices in 70+ countries, and 17 employee resource groups with 50,000+ participants, per its Diversity & Belonging info.
Recent Developments
- In February 2025, Google officially scrapped diversity‑based hiring targets. The company is now evaluating DEI programs rather than operating with aspirational quotas.
- Also in 2025, Google offered voluntary buyouts across several divisions (search, advertising, engineering, etc.), as part of cost‑management efforts.
- Google laid off ~200 employees from its global business unit (sales & partnerships) in May 2025, part of continued restructuring.
- Over 200 AI contractors were terminated in late 2025 under programs reviewing AI‑generated content (e.g., Gemini), many via subcontractors.
- The DEI changes were partly in response to U.S. Executive Orders and court rulings concerning federal contractors and diversity programs.
- Financial growth remains strong. In Q1 2025, Alphabet’s consolidated revenues were ~$90.2B, up ~12% year‑over‑year. This growth supports more hiring in growth areas (cloud, AI).
- Despite these changes, Google continues to publish detailed annual diversity reports (as of 2024) and supports various internal programs around belonging, career development, and inclusive hiring practices.
Google’s Current Team (Key People)
- Sundar Pichai remains the CEO of Alphabet and Google as of 2025. He assumed this dual role in December 2019 after co-founders Larry Page and Sergey Brin stepped down from day-to-day leadership.
- Ruth Porat, Alphabet’s President and Chief Investment Officer, continues to oversee the company’s investment strategy and financial operations. She previously served as CFO for both Google and Alphabet before transitioning roles in 2023.
- Thomas Kurian, CEO of Google Cloud, leads the division responsible for cloud computing services. Under his leadership, Google Cloud has become one of Alphabet’s fastest-growing business units.
- Prabhakar Raghavan, SVP of Google Knowledge & Information, oversees Search, Assistant, Ads, and News. He plays a major role in shaping Google’s AI and search integration strategy.
- James Manyika, SVP of Technology & Society, leads long-term efforts around AI, responsible innovation, and broader tech policy considerations, especially where technology intersects with ethics and society.
- Philipp Schindler serves as Google’s Chief Business Officer, leading global partnerships, ad sales, and customer operations.
- Jen Fitzpatrick, SVP of Core Systems & Experiences, oversees key infrastructure and product teams that support Google’s user platforms.
- Liz Reid was appointed the new Head of Google Search in early 2024, taking over one of the most critical and visible divisions in the company.
- Kent Walker, President of Global Affairs, manages policy, legal, and trust & safety operations worldwide.
- Marian Croak, VP of Responsible AI and Human-Centered Technology, continues to lead Google’s efforts in building equitable and transparent AI tools.
Current Employee Count at Alphabet/Google
- As of June 30, 2025, Alphabet reported 187,103 employees globally.
- At December 31, 2024, the total was 183,323 full‑time employees, which had grown by ~0.45% from 2023.
- In 2023, the employee count was 182,502, showing a slight decline from 2022, which had ~190,234 employees.
- The year 2022 had seen a bigger jump, ~21.6% growth over 2021 (from ~156,500 to ~190,234).
- Between 2020 and 2021, the workforce increased from ~135,301 to ~156,500 (about a 15.7% rise).
- Earlier years show exponential growth, e.g., 2018 (~98,771) to 2019 (~118,899), ~20.4% growth.
- The growth has moderated recently, from end‑2024 to mid‑2025, and the increase was modest (~3,780 additional employees).
Gender
- As of 2023, about 65.9% of Google’s global full‑time workforce were men, and 34.1% were women.
- Over the past decade, female representation has increased gradually from ~30‑31% in the mid‑2010s toward the low to mid-30s.
- In tech roles specifically, female share has risen from ~20‑22% in earlier years toward ~25‑27% more recently.
- In non‑tech roles, the gender split is much closer, often approaching or exceeding 50% women in certain functions such as human resources, operations, and administrative/support roles.
- Among leadership roles (U.S.), male employees remain a large majority, though precise %s vary; women are underrepresented relative to their overall workforce share.
- The internal growth of female hires and promotions is part of Google’s DEI reporting and programs, though with the removal of hiring targets in 2025, some of these mechanisms face re‑evaluation.
Department or Role
- According to data through 2024, the tech/engineering/product development departments make up a large share of Google’s workforce, especially among higher-level.
- In technical roles (engineering, site reliability, data engineering, AI research), female representation has improved to ~25‑27% globally as of the latest reports.
- Non‑tech roles (sales, operations, marketing, HR, etc.) tend to have closer to a 50/50 split or tilt toward women, particularly in administrative, people operations, or support functions.
- Leadership roles (senior management, director‑level) in the U.S., ~67.6% male, female share ~32.4% as of 2024.
- Ethnicity within technical vs non‑technical, among tech roles, the White employee share has declined (to ~41‑42%) as the Asian share has increased (to ~50‑51%) in 2024.
- Among non‑tech roles, White share remains higher (~58‑60%), Asian share lower (~25‑26%), with rising representation from Hispanic/Latino, Black/African American groups.
- Leadership roles also show ethnic shifts, in 2024, White leaders ~59.6%, Asian leaders ~33.3%. Underrepresented groups (Latino, Black, etc.) make up smaller portions.
Ethnicity
- In Google’s 2023 diversity data, White employees made up about 46.2% globally, Asian employees about 44.8%, and Hispanic/Latino ~7.3%.
- Latino/Hispanic representation in leadership in the U.S. was lower, ~4.3% as of the latest leadership‑level report.
- In technical (tech) departments, as the Asian share increased significantly over the years, the White share in tech declined somewhat, but remains sizeable.
- For non‑tech departments, White employees remain the majority, representation of Hispanic/Latino, Black+ is higher in non‑tech relative to tech, but still modest.
- Among leadership/trends, Google reported achieving a “Racial Equity Commitment” in 2022, increasing Black+, Latinx+, Native American+ leadership representation by 30% over baseline.
Temporary and Contract Workers at Google
- As of 2019, Google had ~121,000 temporary, vendor, and contract workers globally, compared to ~102,000 full‑time employees.
- More recent reports (2025) show layoffs of 200+ contractors involved in AI tasks (GlobalLogic, etc.), particularly reviewing or refining AI‑generated content.
- These contract workers are often employed via subcontractors (not directly by Google) and have placed demands around pay, job security, and working conditions.
- It is less clear from public sources exactly how many contractors/temps Google currently uses; full‑time vs contractor ratios are not regularly published in recent annual reports.
- Some functions, especially content moderation, data annotation, AI raters (“super raters”), etc., rely heavily on temp/contract workers.
- Contractor layoffs in AI tasks in mid/late 2025 reflect Google’s ongoing adjustments in how much human evaluation is needed vs automated systems.
- Contracted roles often do not come with the same benefits or job stability as full‑time, public stories suggest disparities in pay and security.
Average Employee Compensation at Google
- Google’s median total compensation for many engineering roles is in the high hundreds of thousands of dollars. For example, some senior software engineers and staff roles report total compensation over $600,000‑$700,000+ annually.
- Software engineers can earn up to $340,000/year, while research scientists, product managers, and other specialist roles also command high compensation.
- In non‑engineering/business or analyst roles, financial analysts, UX designers, and business systems analysts typically fall in lower ranges compared to engineers, but still well above many industry averages (~$120,000‑$250,000+ depending on level).
- Entry‑level or lower‑level roles show wider variance, often significantly influenced by stock, bonuses, location, and department.
- Pay tends to increase steeply with level, moving from individual contributor (e.g., L3/L4) to senior/leadership roles bring much larger stock grants and bonuses.
- Compensation is influenced by specialization; AI/ML, data engineering, and security roles tend to pay more than general product management or operations roles.
- Some roles, like UX designer or program manager, while not as high as FAANG engineering, still reach six‑figure salaries comfortably, especially in major U.S. tech hubs.
US vs Worldwide Market Share of Internet Browsers
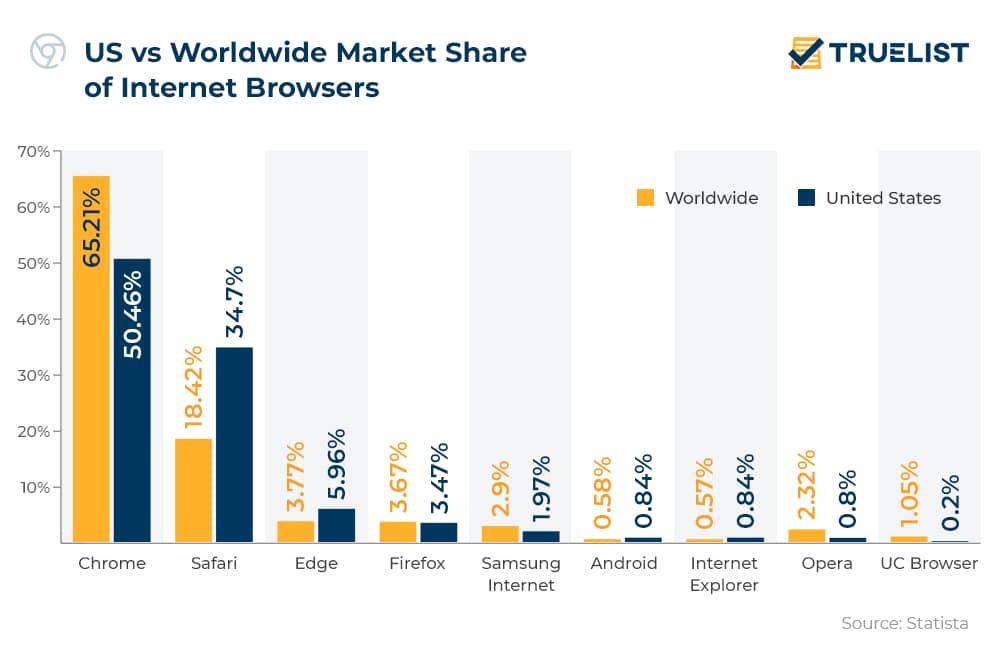
- Chrome holds a 65.21% global market share, but only 50.46% in the United States, showing a significant lead worldwide.
- Safari dominates more in the US with a 34.7% share, compared to just 18.42% globally.
- Edge has a modest presence with 5.96% in the US and 3.77% worldwide.
- Firefox maintains a stable presence across both regions, with 3.67% worldwide and 3.47% in the US.
- Samsung Internet is stronger globally at 2.9%, but less popular in the US at 1.97%.
- Android Browser accounts for 0.58% globally and 0.84% in the US, reflecting niche usage.
- Internet Explorer is nearly obsolete, with 0.57% market share globally and 0.84% in the US.
- Opera sees more use worldwide (2.32%) than in the US (0.8%).
- UC Browser is almost absent in the US, with 0.2%, while holding 1.05% globally, driven by Asian markets.
Employee Benefits and Perks at Google
- Google offers matching 401(k) retirement plans in the U.S., along with equity (stocks or RSUs) in many roles.
- Full health insurance coverage for employees and their families (spouse/partners, dependents) is included in many full‑time packages.
- Other perks include wellness programs, mental health support, subsidized meals, fitness facilities, and commuter benefits in many U.S. offices.
- Sabbaticals or personal time programs are cited in benefit descriptions. Google has historically offered paid time off for rest, development, or personal needs.
- Google has programs for parental leave, adoption, fertility support, and child care subsidies in certain locations.
- Equity & stock grant programs are a major part of compensation in senior and technical roles, making up a large portion of total pay.
- Additional perks, internal career development/training programs, tuition assistance in some cases, learning stipends, or reimbursement.
Global Office Locations and Distribution
- Google/Alphabet maintains 70+ offices in some 200+ cities across more than 50 countries as of 2024‑2025.
- The U.S. remains a major base, with many offices in California, New York, Texas, Massachusetts, Washington, etc.
- Major international hubs include India, Ireland, the UK, Canada, Germany, Japan, etc.
- Some offices are specialized, e.g., AI labs or R&D centers, cloud infrastructure data centers, hardware engineering sites, etc.
- Distribution reflects both historical growth and cost / strategic advantages in non‑U.S. locations.
- Remote work or hybrid working is now more common, and some roles allow employees to work from multiple locations.
- Office presence also means local regulatory and compensation adjustments depending on country norms, legal requirements, and cost of living.
Top 10 Most Frequently Asked Google Questions
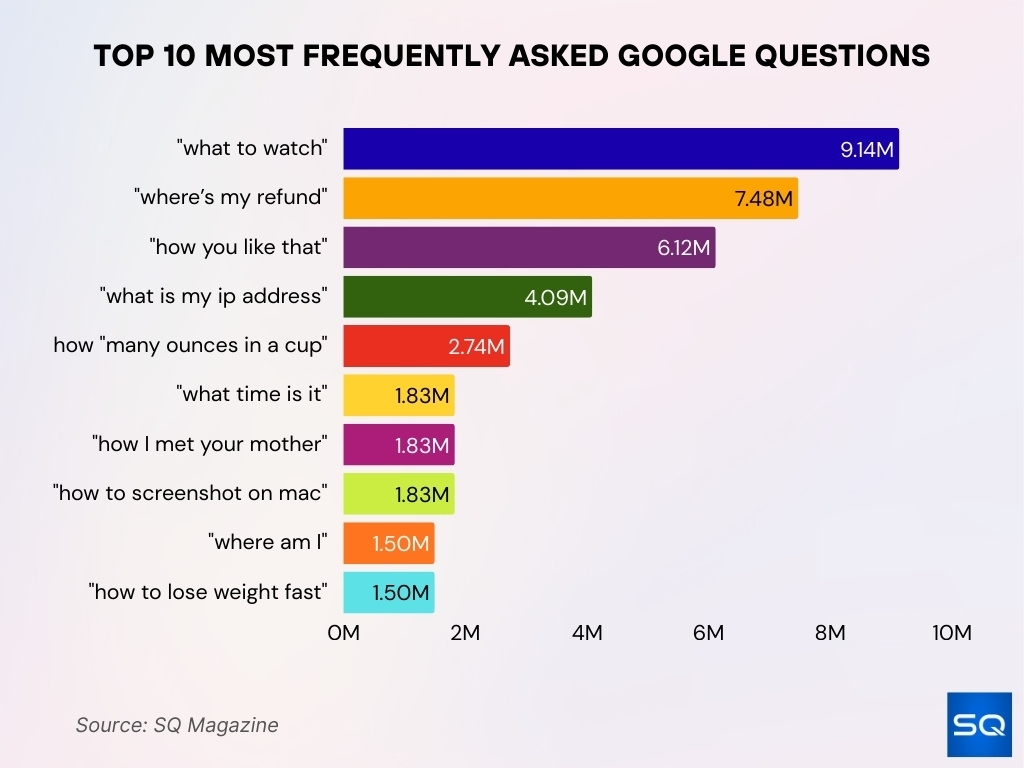
- “What to watch” leads all queries with 9.14 million monthly searches, reflecting strong interest in entertainment choices.
- “Where’s my refund” receives 7.48 million monthly searches, showing tax-related inquiries are a major concern.
- “How you like that” pulls in 6.12 million monthly searches, likely driven by K-pop fans of BLACKPINK.
- “What is my IP address” gets 4.09 million searches per month, indicating widespread technical curiosity.
- “How many ounces in a cup” garners 2.74 million monthly searches, a common cooking and measurement query.
- “What time is it” is searched 1.83 million times monthly, suggesting users still rely on Google for quick time checks.
- “How I met your mother” gets 1.83 million searches, showing enduring interest in the popular TV series.
- “How to screenshot on Mac” also sees 1.83 million monthly searches, pointing to frequent how-to tech queries.
- “Where am I” has 1.5 million monthly searches, likely used in travel, emergencies, or navigation.
- “How to lose weight fast” rounds out the list with 1.5 million monthly searches, reflecting ongoing interest in health and fitness.
Career Development Opportunities at Google
- Google’s Career Certificates program has produced over 1 million graduates globally, including more than 350,000 in the U.S., as of May 2025.
- The Certificate programs aim to provide in‑demand skills in areas like IT support, data analytics, project management, etc.
- Google also introduced Career Dreamer, a tool powered by generative AI, which helps employees map skills to potential career paths.
- Intern and early career programs like CSSI provide high school and college students with exposure to industry work.
- Employees often have access to internal training, mentoring, rotations across departments, and learning stipends.
- Google’s growth in AI, cloud, and infrastructure provides opportunities for career advancement in these domains.
- Google supports development in areas like design, operations, product management, and sales.
- Google’s promotion and leadership pipelines are frequently part of its diversity, equity, and inclusion reporting.
Trends and Future Outlook for Google’s Workforce
- As of June 2025, Alphabet (Google) had 187,103 employees globally.
- Growth since 2001 has been dramatic; Google has increased its workforce by about 183,000 employees since then.
- Growth has moderated recently, from end‑2024 to mid‑2025, with incremental increases rather than large expansion phases.
- The push toward AI, cloud infrastructure, and data‑center expansion suggests future hiring will concentrate in those areas.
- Divisions like platforms/devices have seen layoffs and restructuring.
- Remote and hybrid work is under reevaluation.
- Diversity, equity, and inclusion policies are adjusting; Google removed aspirational hiring targets in early 2025.
- Regulatory pressures could affect organizational structure and hiring practices.
Comparison with Other Big Tech Companies
- Microsoft employed about 228,000.
- Meta Platforms had ~74,067 employees.
- Amazon had ~1.55 million workers.
- Apple employed about 164,000.
- Alphabet generates ~$1.9 million in revenue per employee.
- Microsoft and Amazon had lower revenue per employee figures.
- Google mirrors peers in shifting investment focus.
- Google consistently ranks among the top firms for career growth and learning opportunities.
- Layoffs and buyouts have occurred across Big Tech.
Frequently Asked Questions (FAQs)
187,103 full‐time employees.
Growth of 2.06% (increase by 3,780 employees) over that period.
Approximately 65.9% male and 34.1% female.
Around 91% of the workforce is either White or Asian.
Conclusion
Google’s workforce today sits at a crossroads of modest growth, strategic contraction, and reshaping. Career development programs continue to offer meaningful paths for growth, though adjustments to diversity goals and departmental priorities signal change. Compared with its Big Tech peers, Google remains a heavyweight both in size and compensation, yet it faces the same pressures, cost control, regulatory constraints, and evolving workforce expectations. As Google refines what “growth” looks like, interested professionals and observers can gain insight by watching which departments expand tomorrow, AI, cloud, or elsewhere, and how internal policies adapt.


