Diversity in tech has become a critical measure of industry health, not just a moral imperative. Today, executives, policymakers, and advocates ask: who builds the future? Real-world effects already appear in product design (e.g., inclusive voice assistants) and hiring (e.g., diversity‐led recruiting pipelines at major firms).
Editor’s Choice
- Women are projected to hold approximately 28–30% of STEM roles in the U.S. in 2025, according to recent estimates from NSF and NCSES.
- Only about 25% of the U.S. tech workforce is female.
- Women hold under 20% of leadership roles in tech.
- Tech firms in the top 25% for racial and ethnic diversity are 35% more likely to generate above-average profits.
- In the U.S., 821 of 1,143 major tech executive roles are held by men (≈ 71%).
- Black, Latina, and Native American women’s share of tech roles dropped from 4.6% to 4.1% between 2018–2022.
- In AI teams, greater gender diversity correlates with higher code quality.
Recent Developments
- ASML announced it will drop U.S. diversity targets in 2025 to align with new U.S. regulations.
- The share of women in U.S. tech jobs rose from ~31% (2019) to ~35% in 2023.
- Among 1,143 surveyed executive roles, ~71% are now held by men, only 29% by women.
- Google increased its Black, Latino, and Native American leadership by 30% in 2024.
- Some major firms, under pressure, are retracting formal DEI policies or targets in compliance moves.
- The State of the Tech Workforce 2025 report forecasts a 6% annual replacement rate in tech roles (≈ 352,000 workers per year).
- Tech continues to outpace overall U.S. workforce growth over the decade 2024–2034.
- Slow racial and ethnic gains show that much of recent diversity hiring favors Asian professionals, with limited change for other underrepresented groups.
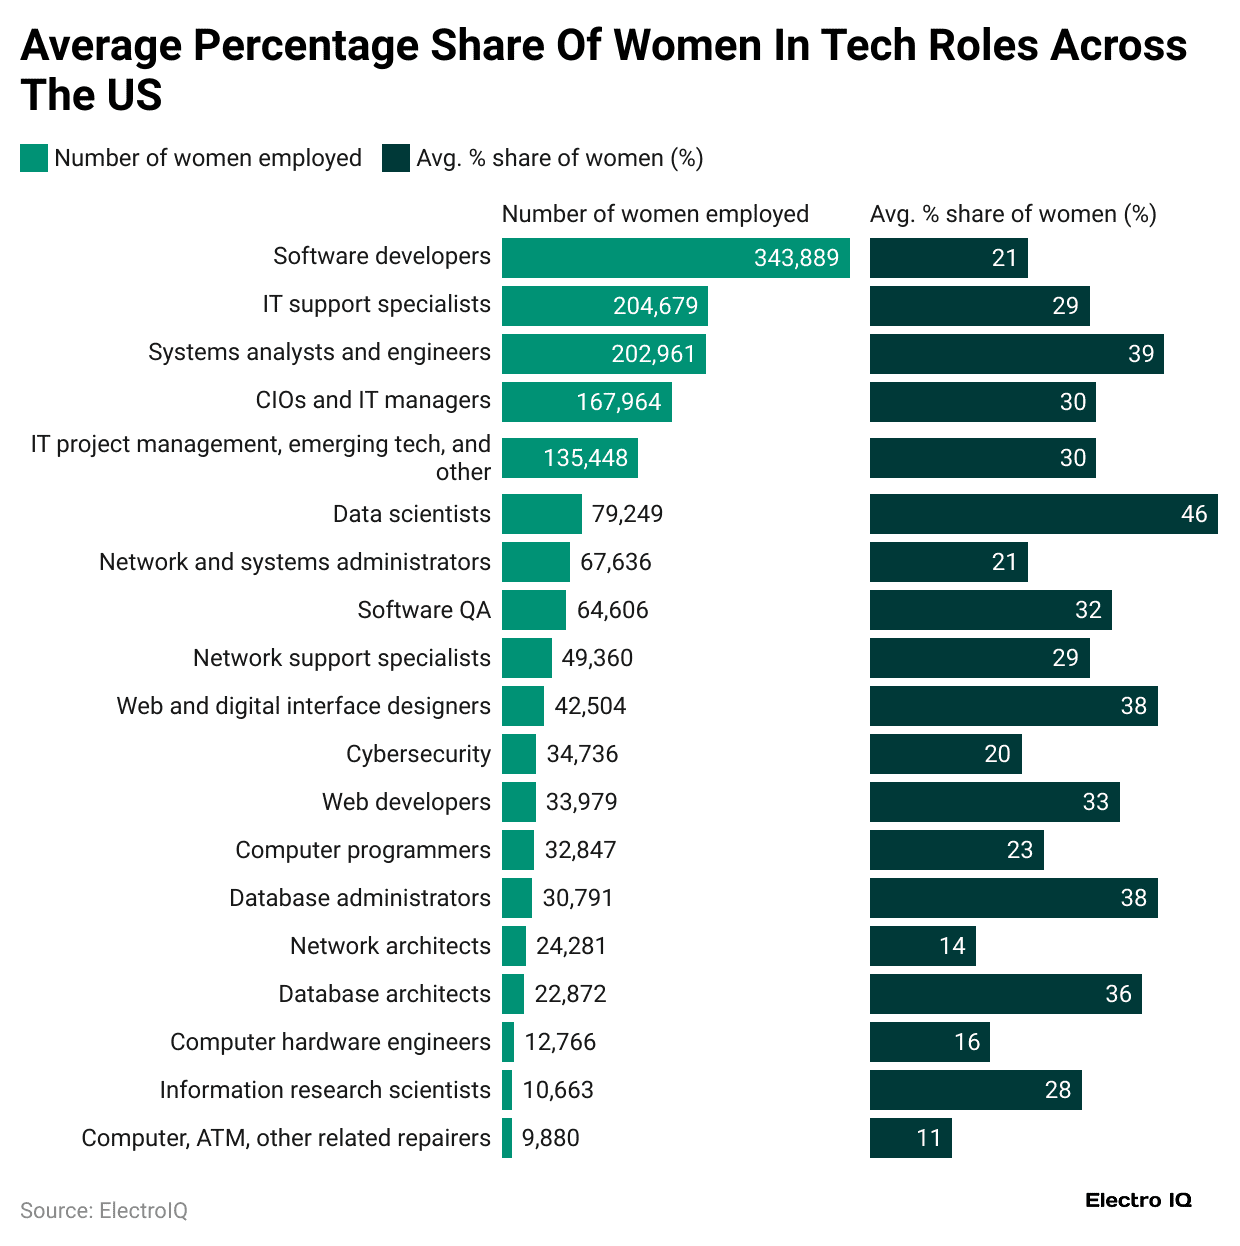
Women’s Representation in U.S. Tech Roles
- Software developers employ 343,889 women, making up 21% of the workforce.
- IT support specialists count 204,679 women, representing 29% of the field.
- Systems analysts and engineers show a higher inclusion rate with 39% women, totaling 202,961 employees.
- CIOs and IT managers include 167,964 women, accounting for 30% of leadership roles.
- IT project management and emerging tech roles have 135,448 women, or 30% representation.
- Data scientists lead in gender diversity, with 46% of roles filled by women (79,249 employees).
- Network and systems administrators remain male-dominated, with women holding just 21% of roles (67,636 employees).
- Software QA positions show 32% female participation, totaling 64,606 women.
- Network support specialists include 49,360 women, reflecting 29% representation.
- Web and digital interface designers show a strong 38% female share (42,504 women).
- Cybersecurity remains one of the least diverse fields, with only 20% women (34,736 employees).
- Web developers have 33,979 women, making up 33% of the workforce.
- Computer programmers count 32,847 women, equal to 23% representation.
- Database administrators show 38% female inclusion, totaling 30,791 women.
- Network architects are among the least gender-diverse, with only 14% women (24,281 employees).
- Database architects feature 36% women (22,872 employees).
- Computer hardware engineers show 16% women (12,766 employees).
- Information research scientists include 10,663 women, accounting for 28% of the total.
- Computer and ATM repair roles have the lowest female share at just 11% (9,880 women).
Gender Diversity in Tech
- About 35% of U.S. STEM roles are held by women in 2025.
- Women represent roughly 27.6% of the tech workforce as of 2025.
- Among Big Tech firms, female representation hovers between ~29% and 45%.
- In core technical roles such as software and infrastructure, women comprise less than 25%.
- Only 17% of tech companies have a female CEO.
- In computing, women account for just 26% of roles, while African American women hold about 3%.
- 91.88% of software developers are male.
- About 50% of women entering tech leave by age 35.
Gender Gap in Technology
- Women earn about 94% of what men do in computer science roles.
- In tech job postings, men benefit from higher salaries in 62% of roles.
- Women are 65% more likely to be laid off in tech downturns.
- 78% of women report they must work harder to prove themselves compared to male coworkers.
- In promotions, women’s rate is 15.9% versus men’s 13.6%.
- Women report burnout rates of 57% versus men’s 36%.
- Pay differences persist even among employees with equal experience and role level.
- Attrition is higher for women; many cite a lack of advancement, culture, or bias.
Disability Representation in Tech
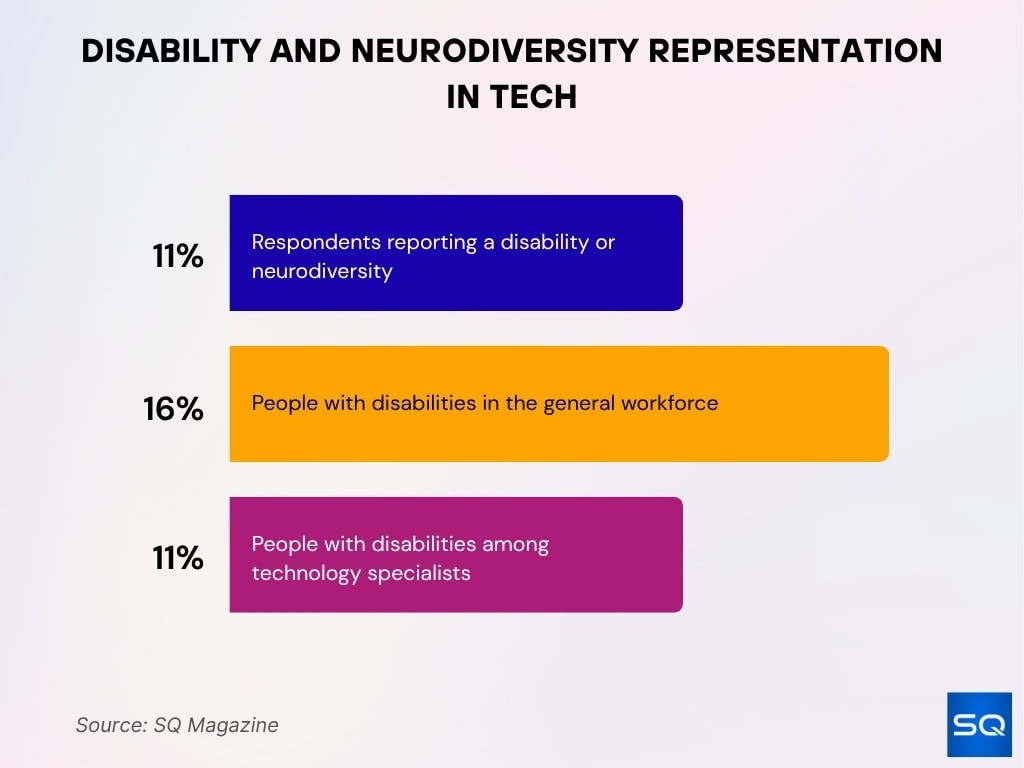
- In many U.S. tech communities, only ~11% of respondents report a disability or neurodiversity.
- In the U.K., people with disabilities make up 16% of the general workforce but only 11% of technology specialists.
- Approximately 88,000 individuals with visible or hidden disabilities are “missing” from the tech workforce.
- Many workplaces declare accessibility, such as ramps and software, but fail to deliver accommodations that truly support performance.
- Retention of employees with disabilities tends to lag, as disabled employees show lower job retention rates than their non-disabled peers.
- Inclusive tech events such as hackathons for disabled developers yielded 10 new hires out of 50 participants, expanding an accessible talent pool.
- Blind or low-vision employees report a persistent “accessibility paradox.” Tools exist, but workflows remain misaligned with their needs.
- Many datasets and HR systems still exclude or misclassify disability status, leading to undercounting and invisibility.
LGBTQ+ Representation in Tech
- Only 2 – 3% of tech workers openly identify as LGBTQ+.
- LGBTQ+ employees in tech are 20% less likely to be promoted compared to cisgender or heterosexual peers.
- Over 40% of large tech companies maintain employee resource groups (ERGs) for LGBTQIA+ workers.
- LGBTQ+ employees in tech are about 20% less represented in STEM than expected by population share.
- About 20% of LGBTQ+ workers in tech report having to hide their identity to succeed.
- Around 65% of LGBTQ+ tech employees say they have experienced verbal harassment or microaggressions.
- Companies with LGBTQ+ board or leadership visibility tend to achieve higher ESG scores and enterprise value.
- In many firms, LGBTQ+ representation remains confined to nontechnical or support roles, rarely reaching senior tech tracks.
Pay and Promotion Gaps in Tech
- Women in tech earn about 94% of what men do in comparable roles.
- Among promotions, for every 100 men promoted, only about 87 women get promoted.
- LGBTQ+ workers face around 20% lower promotion rates in tech versus non‑LGBTQ+ peers.
- Pay postings favor men; in 62% of tech roles, advertised salaries skew higher for men.
- Women report that in many roles, they must exceed performance expectations to match male peers.
- Ethnic races often face pay compression, less room for salary growth in later years.
- Disabled employees often report opaque pay structures and hidden barriers to raises or bonuses.
- In firms with diverse leadership, revenue per employee tends to be higher, and better pay may follow inclusive structures.
Social Mobility in the Tech Industry
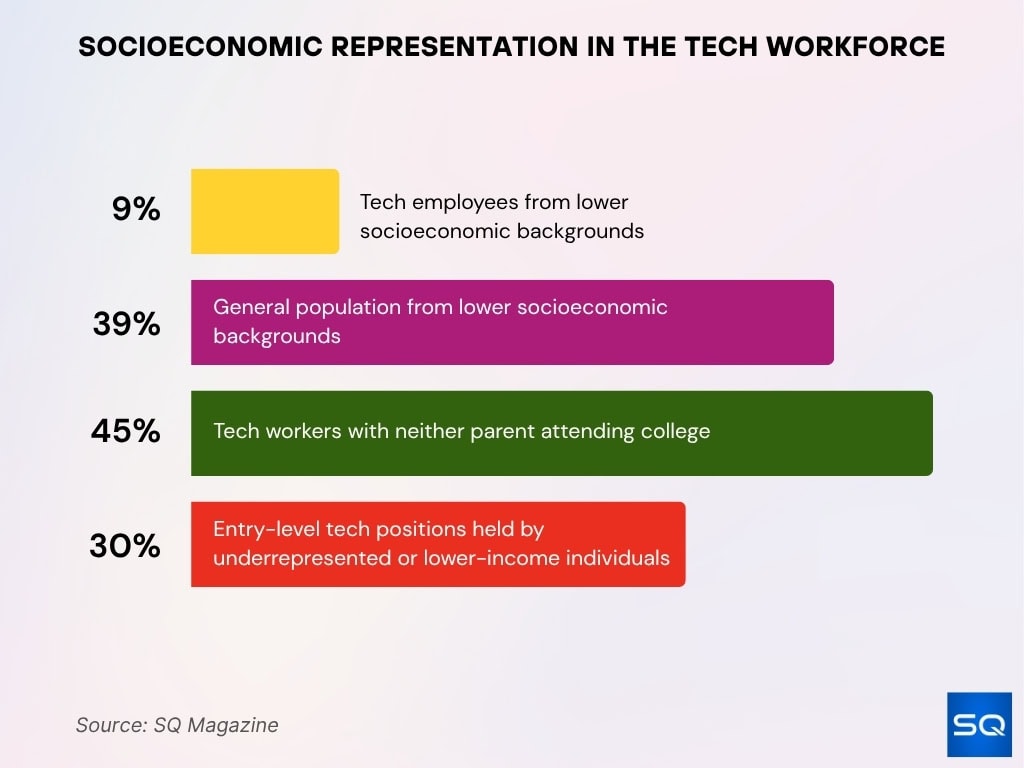
- In the U.K., only 9% of tech employees come from lower socioeconomic backgrounds, versus about 39% of the general population.
- Around 45% of tech workers in some studies come from families where neither parent attended college.
- About 30% of entry-level tech positions are held by people from underrepresented or lower-income backgrounds.
- Remote work and workforce analytics have modestly widened access to talent across geographies, but not substantially shifted social mobility.
- In firms with rapidly expanding executive ranks, diversity gains are stronger, suggesting new leadership roles offer mobility opportunities.
- However, mid-level promotion tracks still lag in diversity gains; many companies fill new roles with existing demographics.
- Barriers like unpaid internships, unpaid training, or location bias still limit upward mobility from lower-income communities.
Retention and Turnover of Diverse Talent
- Women in tech have a high attrition rate, around 50% leave by age 35.
- LGBTQ+ tech employees report higher turnover due to a lack of psychological safety or discrimination.
- Replacement cost of a lost employee can run 1.5–2x their salary, making turnover especially costly.
- Disability inclusion correlates with lower turnover, and inclusive environments boost retention.
- In companies with strong D&I policies, turnover among underrepresented groups falls by 15–25%.
- Exit surveys often cite lack of advancement, microaggressions, and poor culture as top reasons.
- Mid-tier underrepresented employees are especially vulnerable; they often leave just before senior roles.
- Companies improving inclusion through training, mentorship, and flexible policies report retention gains within 12 months.
Diversity and Inclusion by Tech Company
- Over 70% of UK tech companies now collect ethnicity data, and about 63% take action on improving diversity.
- Some companies are retracting formal DEI targets under political or legal pressure, including several U.S. firms.
- Firms with visible LGBTQ+ inclusion often score higher in Corporate Equality Index evaluations.
- Tech companies in the top quartile for ethnic diversity are 35% more likely to have profitability above the industry median.
- Some Big Tech firms report ethnic hiring quotas or “diversity slates” for open roles.
- Others still lack transparency; many firms do not publish disability representation or retention metrics.
- Employee resource groups, mentorship programs, and transparent career tracks are more common in tech incumbents than startups.
- Firms expanding remote and hybrid work models claim this helps broaden diversity, though the impact varies widely.
Racial Composition of the U.S. High-Tech Workforce
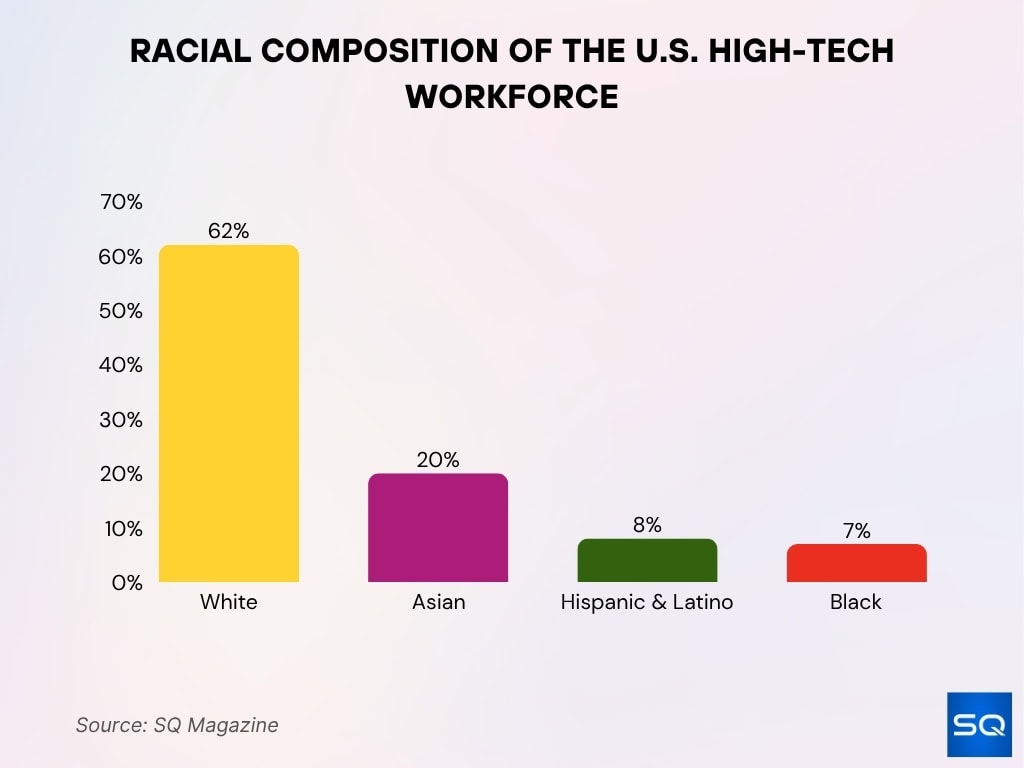
- White professionals make up the majority at 62% of the high-tech labor force.
- Asian workers represent a significant 20% share, reflecting strong participation in technical and engineering roles.
- Hispanic and Latino employees account for 8% of the workforce, indicating gradual but steady inclusion.
- Black professionals comprise only 7%, highlighting ongoing underrepresentation in tech industries.
Diversity in Tech Across Regions / Countries
- In the U.S., Asian professionals hold about 34% of tech roles, while Hispanic and Latino workers account for 5.9%, and Black workers about 6% in developer or web roles.
- In the U.K., about 25% of tech employees come from ethnic minority groups, yet only about 5% identify as Black, and in senior roles, that minority share drops to about 14%.
- Only 6% of tech workers in the U.K. report having a disability, even though about 23% of the working‑age population has one.
- In Asia and the Pacific, subregions report varying female researcher participation, such as Central Asia, around 46%, and East Asia, around 20%.
- Canada’s tech talent workforce is more ethnically diverse than that of the U.S., though underrepresented groups still cluster in lower‑wage roles.
- In the U.S. tech hub region of Santa Clara and San Mateo Counties, talent aged 25–44 with bachelor’s degrees shows significant racial diversity across engineering and CS roles.
- Globally, top quartile racially diverse firms are 35% more likely to achieve above-average profitability.
- “Tech talent” in many economies is still predominantly White, male, and Asian, with Black, Hispanic, and female groups underrepresented in senior or technical tiers.
- Many open source or global software development communities show low gender inclusion across regions, with slow but measurable improvements since 2014.
Barriers to Diversity in Tech
- Unconscious bias often influences hiring, promotions, and team dynamics even in organizations with formal diversity goals.
- Lack of sponsorship or mentorship is often cited; many underrepresented employees report no senior advocate.
- Pay opacity and early career pay gaps lead to cumulative disadvantage over time.
- Cultural exclusion and microaggressions push many underrepresented workers out. Reports of racial discrimination in tech rose from about 18% in 2021 to about 24%.
- Some firms are rolling back DEI goals or targets under corporate or political pressure, including major consultancies.
- Companies that ignore inclusion often see 2.5× higher turnover and have 50% lower capacity to attract top talent.
- Overreliance on “diversity hires” without systemic change leads to tokenism, which fosters resentment or disengagement.
- In education pipelines, underrepresented students face limited role models, biased curricula, and exclusionary environments.
- Access barriers like location, unpaid internships, credential bias, and networking gaps hinder entry from lower-income or rural communities.
The Role of Education in Tech Diversity
- A study in software engineering education found that gender diversity correlates positively with project success and code quality in student teams.
- Many underrepresented students in computer science report that mentors and role models significantly influence their persistence.
- In the U.S., only about 26% of the computing workforce is female, signaling a gap in education-to-career pipelines.
- African American women hold only about 3% of computing roles, despite greater representation in STEM education pipelines.
- Universities and bootcamps that embed inclusive pedagogy, anti-bias training, and community support report higher retention of underrepresented students.
- Initiatives like ColorStack, with chapters at 73 universities, support underrepresented CS students with advising and career guidance.
- Fellowship and scholarship programs such as Groundbreaker Talents have trained many women in Africa, achieving 100% employment within 3 months post-graduation.
- Intersectional support addressing race, disability, and gender is more effective than siloed programs.
- Ongoing skill refreshers and pathways for nontraditional learners widen access to diversity laterally.
Frequently Asked Questions (FAQs)
About 26 % of the U.S. computing workforce is female.
African American women hold around 3 % of computing‑related positions.
Tech firms in the top quartile for racial and ethnic diversity are 35 % more likely to have above‑average financial returns.
In Canada, people with disabilities are underrepresented at about 5.2% of tech employees.
Conclusion
The diversity picture in tech is complex. Gains in representation exist, and yet gaps remain in leadership, regionally uneven access, and retention of underrepresented groups. We’ve seen how gender, ethnicity, LGBTQ+, disability, social mobility, pay, turnover, company practices, regional variation, barriers, education, and business impact all interplay. Diversity is not a fixed endpoint; it’s a commitment. When organizations invest beyond hiring, into equity, support, inclusion, and systems change, they unlock both justice and performance.


