Blogging remains a core element of the digital content landscape, shaping how businesses, creators, and readers connect. Its influence spans industries, from media companies driving site traffic through blogs to small businesses using blog posts as lead magnets. Recent developments highlight shifts in how content is produced, consumed, and monetized. Let’s dive into the data and see what’s changing, and what that means for anyone blogging now.
Editor’s Choice
- There are over 600 million blogs in existence, among about 1.9 billion websites.
- An estimated 7+ million blog posts are published daily, based on projections from industry data, though exact numbers vary.
- About 83% of internet users (≈ 4.44 billion people) read blogs regularly.
- The average blog post length is around 1,394 words in 2024.
- It takes about 3 hours and 51 minutes to write a typical blog post.
- Over 70% of internet users read blogs with relevant images, as posts that include images get 94% more views.
- Around 50% of bloggers publish weekly or several times per month.
Recent Developments
- Use of AI in blogging workflows rose, as of 2024, to about 80% of bloggers are using AI in some part of their work, up from 65% in 2023.
- There’s been a decline in average blog post length from 1,427 words to 1,394 words between last year and 2024.
- Readers continue to skim more than fully read; 73% of readers skim, and only 27% fully read blog posts.
- Visual content matters; posts with relevant images get significantly more views (≈ 94% more) than those without.
- More bloggers are updating old content, and frequent updates of previously published posts are becoming standard to maintain relevance and rankings.
- The competition for reader attention is growing, particularly as organic search traffic declines in some niches.
What Makes Content Good According to Readers
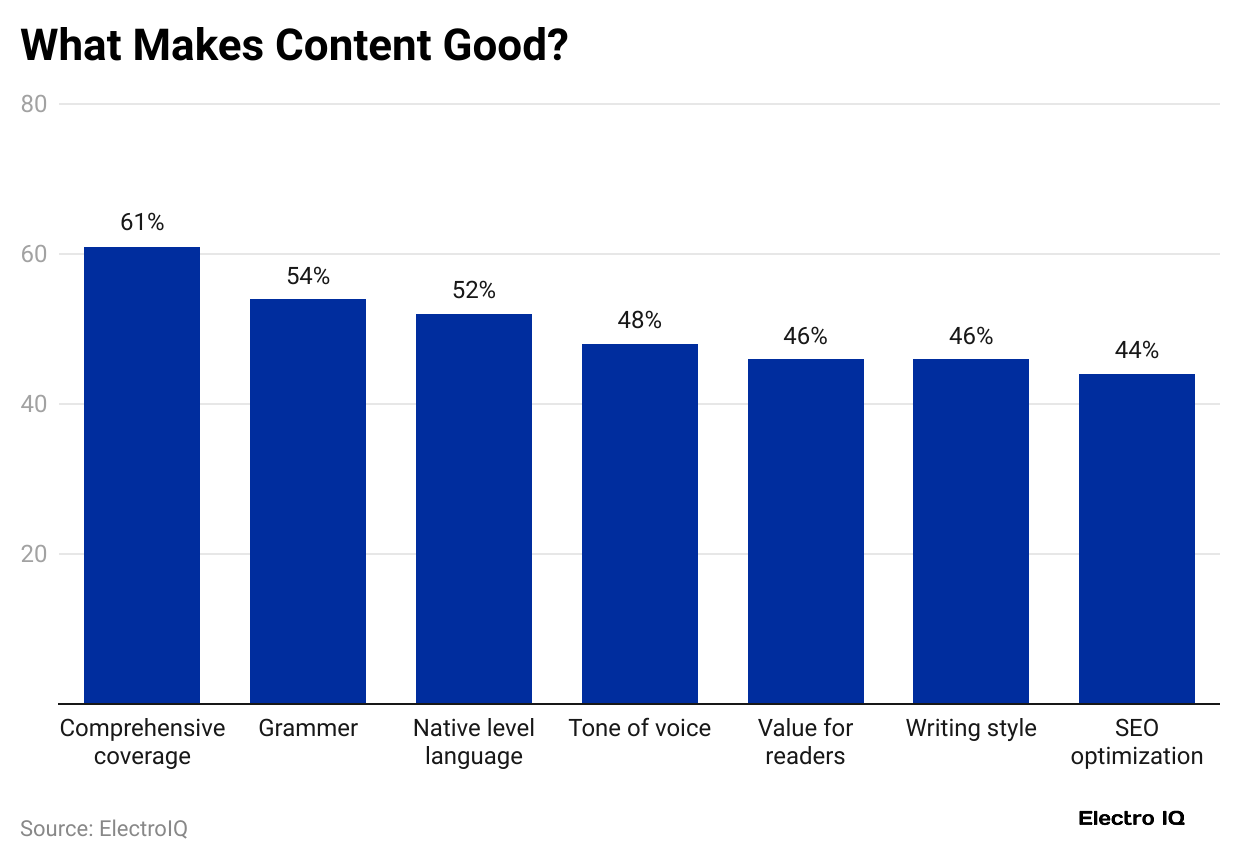
- 61% of respondents believe comprehensive coverage is the most important factor in high-quality content.
- 54% rank grammar as a key element of good writing, showing the value of technical accuracy.
- 52% emphasize the need for native-level language, highlighting the importance of fluency and clarity.
- 48% consider tone of voice a strong contributor to content appeal and brand consistency.
- 46% value content that offers real benefits to readers, such as insights or practical tips.
- 46% also highlight writing style as a major factor that shapes readability and engagement.
- 44% believe SEO optimization still matters, but less so than content quality itself.

Number of Blogs Worldwide
- There are approximately 600 million blogs worldwide, though the number fluctuates depending on how blogs are defined and whether dormant ones are counted.
- Tumblr alone hosts about 518 million of those blogs.
- WordPress powers a large share; estimates indicate that 70 million blog posts are published each month via WordPress.
- Inactive vs. active blogs, many of the 600M+ are dormant or rarely updated, determining “active blogs” depends on frequency metrics.
- The percentage of websites that are blogs is 31.6%.
Blog Readership Statistics
- About 83% of internet users (≈ 4.44 billion people) read blog posts.
- Reading frequency:
- 18% read blogs every day.
- 6% read multiple posts per day.
- 29% read once per month.
- 17% never read blog posts.
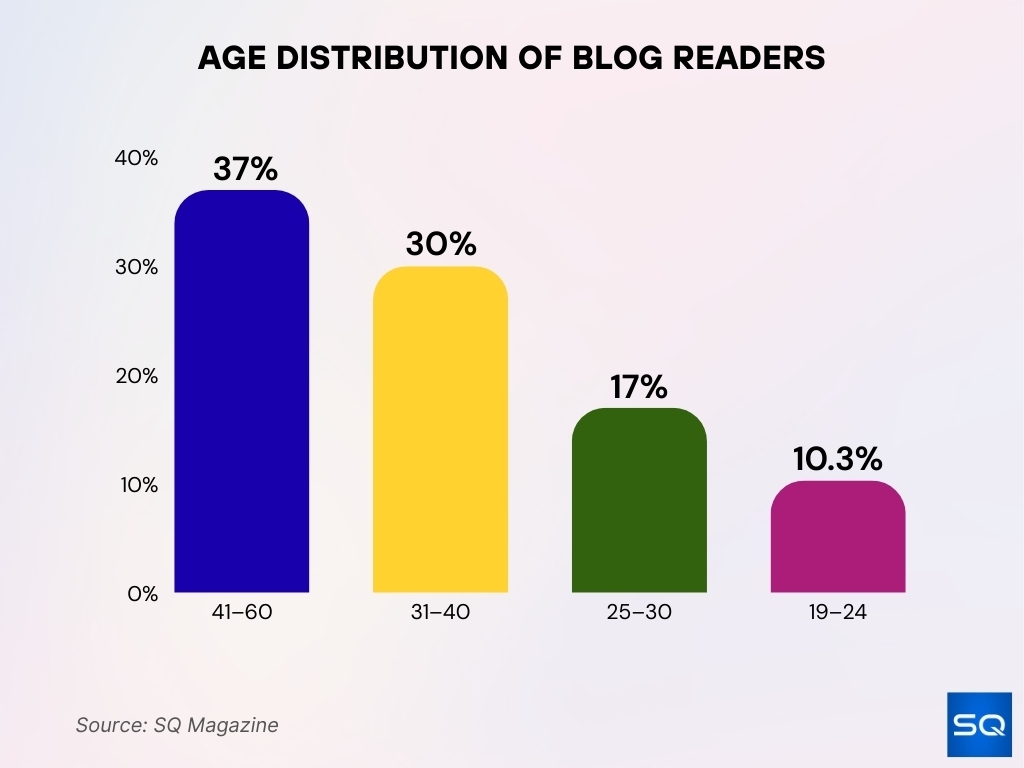
- Age distribution of readers:
- 37% are aged 41–60.
- 30% are 31–40.
- 17% are 25–30.
- 10.3% are 19–24.
- Gender & platform skew, on Medium, 65% of readers identify as male, 35% female.
- Reader behavior:
- 35% of readers frequently skim articles.
- 4 out of 5 (≈ 80%) check out only the headline of blog posts before deciding to read further.

Blogger Demographics
- In the U.S., 67.1% of bloggers are women, vs. 32.9% men.
- By race in the U.S., 74.8% White, Hispanic/Latino 7.9%, Black or African American 6.2%, Asian 5.1%.
- Global age spread of blog readers (used as proxy for likely bloggers), many are in the 25–44 age range.
- Time spent writing, an average blog post takes 3 hours and 51 minutes to write.
- Bloggers’ frequency: about 50% publish weekly or several times per month.
Blogging Frequency and Publishing Habits
- 50% of marketers publish 2‑4 blog posts per month.
- Only 3% of bloggers publish daily.
- Weekly publishing is more common, with about 24% publishing once a week.
- Several posts per month account for 23%.
- Monthly blog posts happen for about 17% of bloggers.
- 2‑6 posts per week account for 14% of bloggers.
- Irregular posting schedule, 11% of bloggers.
- Frequency tends to correlate with results; bloggers who see strong results more often publish more frequently.
Top Niches Most Reliant on Google Search
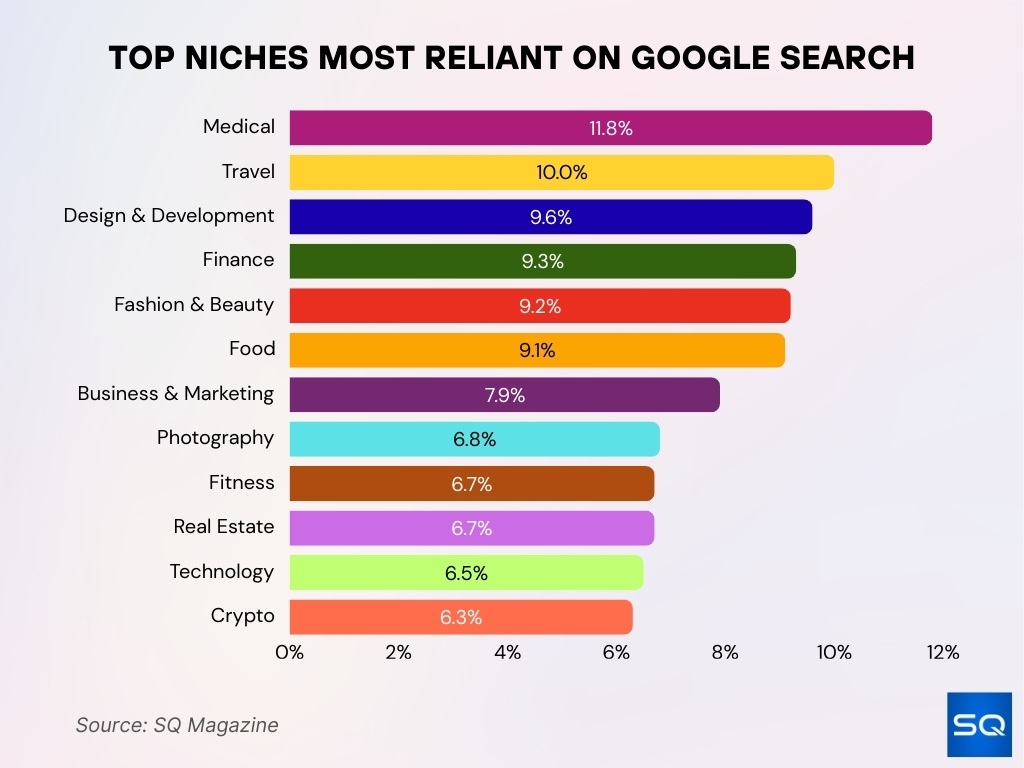
- Medical is the most search-dependent niche, with 11.8% of sites heavily relying on Google traffic.
- Travel ranks second, with 10.0% of websites depending on search visibility to attract users.
- Design & Development follows at 9.6%, showing strong reliance on organic search for discovery.
- Finance content depends on Google for 9.3% of its audience reach.
- Fashion & Beauty niches are close behind, with 9.2% relying on search engines.
- Food websites show 9.1% reliance, highlighting the importance of SEO in recipe and dining content.
- Business & Marketing gets 7.9% of its traffic from Google, emphasizing the need for search-driven lead gen.
- Photography content depends on search for 6.8% of its exposure.
- Fitness and Real Estate each show 6.7% reliance on Google search.
- Technology sites rank slightly lower, with 6.5% of their traffic dependent on Google.
- Crypto is the least reliant niche, with only 6.3% of traffic coming from search engines.

Average Blog Post Length
- Typical article length in 2025 is 1,333 words.
- Distribution of length:
• 31‑32% write posts between 500‑1,000 words.
• 30‑32% between 1,000‑1,500 words.
• 18% write 1,500‑2,000 words.
• 11% write 2,000‑3,000 words.
• 3% produce 3,000+ words. - Marketing & Advertising blogs often have longer posts (2,500–3,000 words), while gadgets or fashion posts are shorter (300–1,000 words).
Content Length and Performance Correlation
- Posts over 2,000 words tend to rank more often and generate more traffic & shares.
- Posts with 7 or more images get about 55% more backlinks than posts with none.
- Long‑form content (2,000+ words) gets more social shares.
- The majority of bloggers who get strong results regularly publish long‑form content.
- Average content length has peaked and is slightly decreasing.
- Short‑to‑mid length posts (1,000–1,500 words) still dominate.
- The “ideal blog post length” is between 1,500‑2,500 words, depending on topic, audience, and competition.
Most Popular Blogging Formats
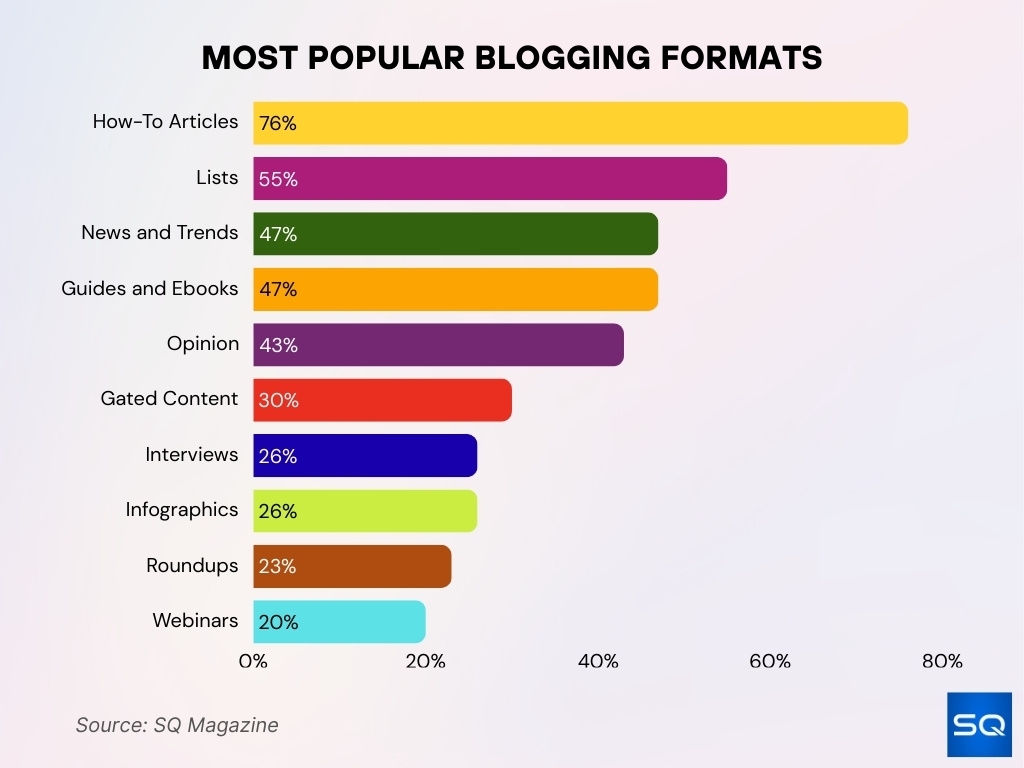
- 76% of bloggers published How-To Articles, making it the most used format across all niches.
- 55% created List posts, which remain popular for their scannability and high engagement.
- 47% focused on News and Trends, helping readers stay updated with real-time insights.
- 47% also produced Guides and e-books (Long Form), offering in-depth educational content.
- 43% shared Opinion pieces, reflecting the growing importance of thought leadership.
- 30% published Gated Content, such as downloadable resources that require user sign-ups.
- 26% conducted Interviews, adding expert voices and credibility to their content.
- 26% used Infographics to present data-driven or complex topics in a visual format.
- 23% released Roundups, summarizing tools, tips, or industry highlights.
- 20% hosted or published Webinars, offering interactive or long-form video content.

Blog Post Writing Time
- In 2025, the average time to write a blog post is about 3 hours, 25 minutes.
- In 2024, it was closer to 3 hours and 48 minutes.
- Most bloggers spend 2‑5 hours writing a post.
- Time includes research, drafting, editing, and visuals.
- Longer posts and technical content require more time.
- Posts with media take longer.
- Bloggers who publish less frequently tend to spend more time per post.
Blogging Revenue and Average Blogger Income
- The average U.S. blogger earns about $103,446 annually in 2025.
- Bloggers in California average $123,543/year.
- Bloggers with 1,000+ blog posts earn $7,981.67/month, down from $11,578.73/month.
- 21% of bloggers earn $100–$1,000/month.
- Established blogs can earn $5,000–$20,000+ per month.
- The average salary is about $49,242/year for many.
- Top-tier food bloggers can earn $9,000+ per month, although income varies widely depending on audience size, monetization strategy, and niche.
Business Blogging Statistics
- 80% of businesses use blogs as a marketing tool.
- Blogging can boost web traffic by 55%.
- Companies that blog see 13× higher ROI.
- Small businesses see 126% more lead growth.
- B2B blogs generate 67% more leads.
- 73% of B2B marketers use case studies.
- B2C blogs get 9.7× more shares than non‑blog content.
Blogging and Lead Generation
- Blogs generate 67% more leads.
- Companies that publish 15 posts/month generate 1,200 new leads/month.
- Content marketing yields 3× more leads, at 62% less cost.
- Organizations generate 1,877 leads/month.
- Average cost per lead is $198.44.
- 76% of marketers use content to generate leads.
AI Usage in Blogging
- About 65–80% of bloggers reported using AI tools in some aspect of their content creation workflow, a sharp rise from previous years.
- 54% use AI to generate content ideas.
- Only 6% use AI to write entire articles.
- 70% use AI for drafting or enhancements.
- 11.4% of businesses plan to spend $45,000+ per month on content.
- 36.4% report traffic drops due to AI summaries or search changes.
Blogging and Social Media Integration
- B2C blog content gets 9.7× more shares.
- Social sharing boosts reach and engagement.
- Facebook traffic is declining, while others like X or Instagram vary in value.
Use of Visuals and Multimedia in Blogs
- Posts with 7+ images get 55% more backlinks.
- 92% of bloggers use images.
- 24% embed videos.
- Posts with videos get 70% more traffic.
- Readability and visuals lead to better engagement.
Blogging Challenges and Considerations
- 60% believe AI‑only content reduces quality.
- 36.4% of marketers saw traffic decline in 2024–2025.
- Only 38% update older content.
- Struggles between quality vs quantity.
- Overreliance on ads/affiliates is risky.
- Burnout is a risk from high output expectations.
Frequently Asked Questions (FAQs)
About 2.5 billion blog posts are published each year worldwide.
Approximately 83% of internet users read blogs regularly.
The average conversion rate for business blogs is about 5%.
About 37% of businesses that maintain blogs publish content two to three times per week.
The content marketing industry is expected to reach $584 billion by 2027.
Conclusion
Blogging remains a powerful method for communication, lead generation, and income, but success is less automatic than ever before. Data show that niche choice, consistent publishing, diversified revenue streams, and quality content with multimedia make a difference. AI tools are widely adopted, but human oversight and creativity still matter deeply. For businesses and individuals alike, the game is adapting, shorter content, smarter use of visuals, and strategic lead generation are replacing purely high-volume output.
If you’re planning your blogging strategy for this year or beyond, these stats highlight where to invest effort and where to be cautious.


