Bitcoin remains the benchmark of the crypto universe. Its price swings, adoption trends, and underlying network shifts continue to shape investor sentiment and infrastructure developments. From payments adoption in El Salvador to institutional treasuries stacking BTC, real-world usage is evolving fast. Dive into the following sections to explore the latest statistics and understand where the market might head next.
Editor’s Choice
- Bitcoin’s market capitalization crossed $1.35 trillion by May 2025.
- The circulating supply of Bitcoin in 2025 is ~19.93 million BTC, up 0.85% year over year.
- The all-time high price in March 2025 reached about $73,100.
- Bitcoin’s average daily trading volume in Q1 2025 fluctuated around $90–100 billion, depending on methodology.
- Fewer than 1 million wallets hold at least one full BTC; actual individual holders likely 800,000–850,000.
- The U.S. government established a Strategic Bitcoin Reserve in early 2025, centralizing ~198,000 BTC under state control.
- Bitcoin supply has grown marginally in 2025, from ~19.76 million to 19.93 million.
Recent Developments
- The U.S. government is estimated to hold ~198,000 BTC under the new reserve strategy.
- ETF inflows and institutional demand have stabilized price volatility compared to earlier crypto cycles.
- In 2025, large dormant wallets (some inactive for 14 years) have resumed movement, attracting market speculation.
- Global cryptocurrency users surpassed 420 million by late 2023. Projections suggest growth toward 490–500 million by mid-2025.
- Regulatory clarity is expanding, and more jurisdictions are laying down explicit guidelines for crypto markets.
- The U.S. reserve move has sparked discussions in other nations considering Bitcoin holdings.
- Some institutional buyers now treat Bitcoin similarly to gold or rare assets in reserve portfolios.
- Price corrections in mid-2025 have triggered large liquidations, with Bitcoin responsible for ~17% of a $1.7 billion derivatives unwind.
- Analysts see echoes of historical four-year cycles continuing to shape momentum in 2025.
Bitcoin Technology Market Growth
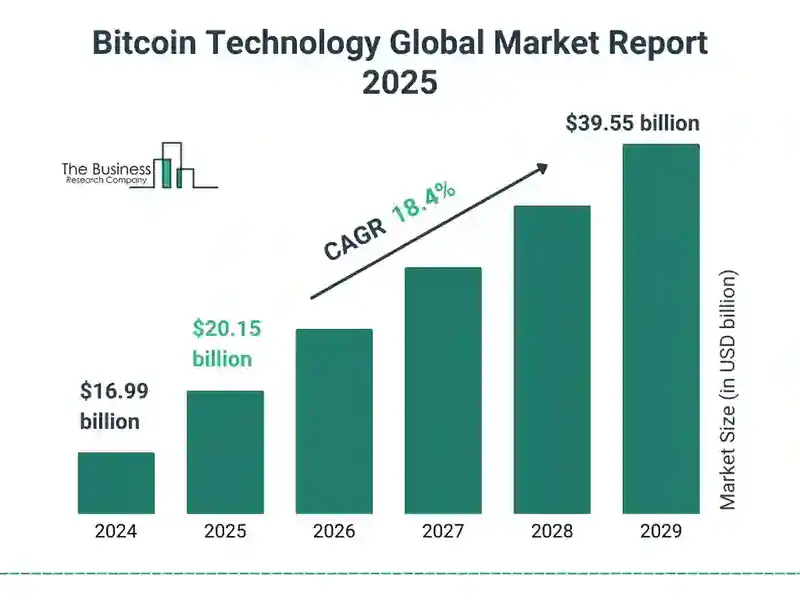
- The global Bitcoin technology market is projected to reach $20.15 billion in 2025.
- It is expected to expand at a CAGR of 18.4% over the forecast period.
- By 2029, the market size is forecasted to climb to $39.55 billion.

Price History
- In early 2024, Bitcoin opened around $45,000 and surged later in the year.
- On March 13, 2024, BTC hit a record close of $73,664.
- By December 2024, Bitcoin crossed the $100,000 mark.
- In May 2025, the price reached $68,200, up ~30% from a year before.
- The all-time high in March 2025 peaked at around $73,100.
- The lowest price in 2025 thus far dipped to $51,900 in early January.
- The average BTC price in 2025 has hovered near $61,300, with daily intraday swings of ~$4,800.
- Volatility has moderated relative to earlier cycles, aided by institutional flows.
- Some forecasts in 2025 project highs as steep as $250,000, if macro and policy align.
- Bitcoin’s performance in 2025 is showing strong resilience amid macro uncertainty.
Market Capitalization
- By May 2025, Bitcoin’s market capitalization exceeded $1.35 trillion.
- With supply at ~19.93 million BTC, market cap per coin remains high relative to past cycles.
- In 2025, Bitcoin frequently ranked among the top global assets by market value.
- In July 2025, BTC surpassed Amazon in market value, reaching $120,000+ per coin and a market cap of ~$2.43 trillion.
- The growth in market cap is driven largely by new entrants and ETF inflows.
- Comparisons with gold’s market cap (~$11–12 trillion) show Bitcoin still has room to grow.
- Flows into spot Bitcoin ETFs directly push the market cap upward.
- Market cap contraction during dips has been less severe in 2025 compared to earlier bear cycles.
Largest Public Companies Holding Bitcoin
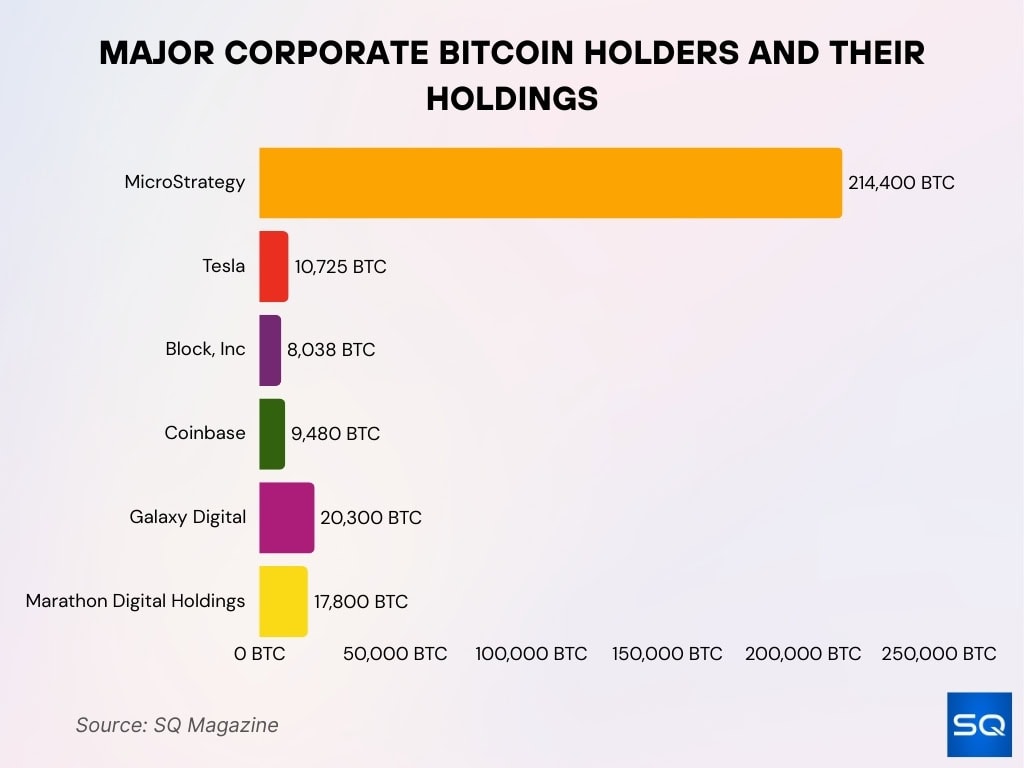
- MicroStrategy leads as the biggest corporate holder with 214,400 BTC valued at $14.5 billion (May 2025).
- Tesla maintains about 10,725 BTC worth $730 million, keeping a strong foothold in crypto despite market volatility.
- Block, Inc. expanded its reserves to 8,038 BTC valued at $550 million, reinforcing its long-term Bitcoin vision.
- Coinbase holds 9,480 BTC worth $640 million as part of a diversified treasury strategy.
- Galaxy Digital owns 20,300 BTC valued at $1.35 billion, reflecting aggressive accumulation through early 2025.
- Marathon Digital Holdings controls 17,800 BTC with an estimated value of $1.2 billion.
- US-based Bitcoin ETFs, led by Grayscale and BlackRock, collectively hold 821,000 BTC, equal to 3.9% of the total supply.

Trading Volume
- In Q1 2025, average daily trading volume was $96 billion, ~20% higher than Q1 2024.
- Volume tends to spike during major price breakouts or corrections.
- Derivatives (futures, options) activity continues to amplify underlying spot volumes.
- In mid-2025, some trades concentrate in U.S.-regulated exchanges, increasing regional share.
- On large sell-offs, derivatives liquidations exceed $1 billion in a single day, impacting volume.
- Some volume shifts reflect algorithmic and institutional trading dominating retail flows.
- Volume on less-regulated global exchanges still plays a significant role in total value.
- Liquidity is highest during U.S. market hours, especially overlapping Asian/European windows.
Supply and Circulation
- As of late September 2025, the circulating supply is ~19.93 million BTC.
- One year earlier (2024), the supply was ~19.76 million.
- New issuance is slowing due to Bitcoin’s halving mechanism, roughly every four years.
- The total maximum supply remains fixed at 21 million BTC.
- That leaves <1.1 million BTC still to be mined over the coming decades.
- Around 4–6% of all BTC are estimated to be permanently lost due to lost keys and inactive wallets.
- The mining issuance per block continues to decrease following the protocol schedule.
- Circulation growth is marginal, 0.85% over the past year.
- Scarcity is increasingly cited by institutional buyers as a rationale to allocate to BTC.
Global Bitcoin Market Forecast
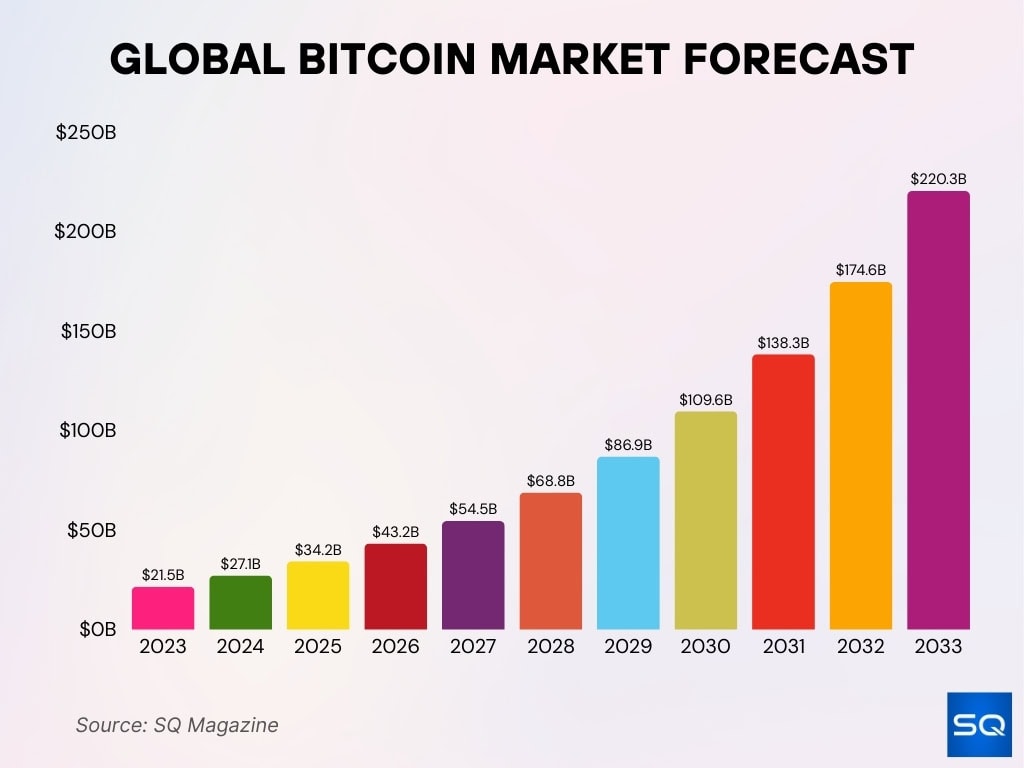
- The Bitcoin market is projected to reach $34.2 billion in 2025.
- By 2026, it is expected to expand to $43.2 billion.
- In 2027, the market size could climb to $54.5 billion.
- Growth is forecasted to continue in 2028, hitting $68.8 billion.
- By 2029, the market is anticipated to reach $86.9 billion.
- In 2030, it is projected to be worth $109.6 billion.
- By 2031, the market may grow to $138.3 billion.
- The 2032 forecast suggests a size of $174.6 billion.
- By 2033, the Bitcoin market is expected to peak at $220.3 billion.

Daily Bitcoin Transactions
- Over the past 24 hours, unique (from or to) Bitcoin addresses transacting numbered ~ 219,000.
- In 2025, average daily on-chain transactions have stayed between 300,000 to 350,000 (depending on source and inclusion criteria).
- The Lightning Network processed 100 million transactions in Q1 2025 via ~14,200 nodes, with an average cost of ~$0.02 per transaction.
- On-chain transaction fees spiked during congestion events, reaching $8–$12 per transaction in April 2025.
- About 5–10% of total daily transfers by value are attributed to large “whale” movements.
- Transaction volumes (number × value) correlate with volatility days; during sharp price moves, counts rise 15–25%.
- The use of batching (combining multiple payments into single transactions) continues to improve throughput and reduce fees.
- Some miner relay networks now orphan late lower-fee transactions, pushing marginal ones to be dropped during congestion peaks.
Active Bitcoin Addresses
- In the past day, ~ 224,400 addresses were active (either as sender or receiver).
- That figure is up ~5–8% relative to similar periods in 2024.
- The count of addresses with nonzero balances exceeds 49 million.
- Roughly 24.5 million addresses have had at least $100 balance historically.
- ~12.9 million addresses have held $1,000+ in BTC at some point.
- ~4.7 million addresses have cumulatively held $10,000+.
- Address reuse is declining, and many users move funds to fresh addresses for privacy.
- Growth in new addresses is steady, especially in emerging markets adopting Bitcoin as remittance or store-of-value.
Expectations for Cryptocurrency Market Performance
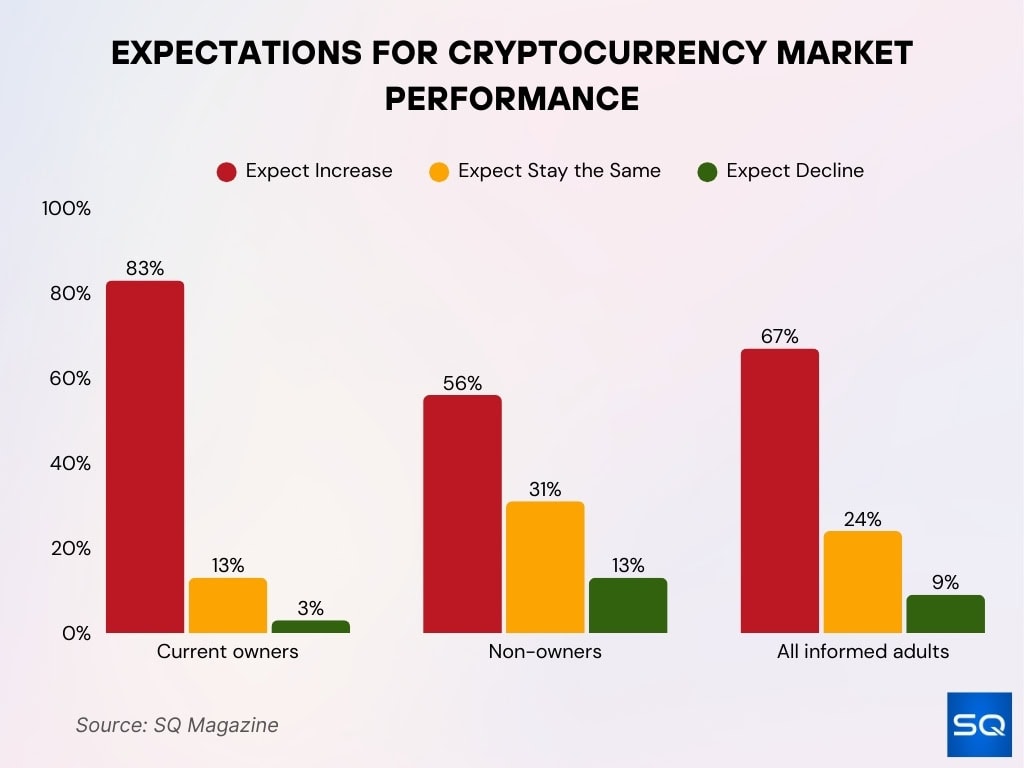
- 83% of current crypto owners expect the market to grow, while 13% see it holding steady and 3% predict a decline.
- Among non-owners, 56% anticipate growth, 31% expect stability, and 13% foresee a drop.
- Looking at all informed adults, 67% believe the market will rise, 24% think it will remain unchanged, and 9% expect it to fall.

Transaction Fees
- The average fee percentage in block rewards is ~0.97%.
- During peak congestion, fees climbed to $8–$12 per transaction (April 2025).
- In quieter times, average user fees fall to $1–$3.
- Fee pressure increased after the halving, as miners relied more on fees to offset lowered block rewards.
- The share of transaction fees in total miner revenue has grown modestly in 2025.
- Fee volatility remains high; on volatile price days, fees can surge 3× baseline.
- The introduction of more SegWit / Taproot usage improves fee efficiency.
- Some wallets now dynamically time transactions (e.g., delaying when the mempool is less busy) to reduce cost.
Mining Statistics
- The current Bitcoin network hashrate is ~ 1.01 ZH/s (zettahashes per second).
- Some sources cite 922.91 EH/s (0.922 ZH/s) depending on measurement methodology.
- Mining difficulty is now ~ 142.34 T (trillion).
- Difficulty has increased ~9–13% over preceding months, reflecting more competition.
- The next difficulty adjustment (estimated Oct 1, 2025) may increase difficulty by ~5.82%.
- In July 2025, network hashrate rose 4% vs June, pushing difficulty upward further.
- The halving in 2024 reduced reward per block from 6.25 → 3.125 BTC, cutting miner revenue in half (ignoring fees).
- Some solo miners now find profitability sharply constrained unless power costs are very low.
Hashrate and Difficulty
- The hashrate of ~1.01 ZH/s reflects the aggregate miner computational power.
- Some estimators place it slightly lower (922.9 EH/s), depending on block window metrics.
- The difficulty of 142.34 T ensures the network maintains ~10-minute block times.
- Over the past 30 days, difficulty has risen by ~9.75%.
- Over a 90-day window, difficulty is up ~13.16%.
- Each difficulty adjustment averages every 2016 blocks (~2 weeks).
- The estimated increase in the next epoch is ~5.8%.
- High difficulty levels raise entry barriers for new miners and push consolidation in the mining industry.
Block Time and Size
- The average block time is ~10 minutes 0 seconds.
- In 24 hours, ~144 blocks are mined.
- The average block size is ~ 721.68 KB.
- Recent blocks’ size fluctuates depending on mempool congestion and fee incentives.
- Bitcoin’s protocol limits the base block size, but SegWit, Taproot, and witness data shift effective capacity.
- During heavy activity days, blocks tend to approach size limits more frequently.
- Block propagation delays sometimes lead to orphaned blocks under network stress.
- Data trends show more block fullness over time as usage increases.
Mining Profitability
- As of August 2025, profitability per EH/s reached its highest level since the 2024 halving event.
- In July 2025, miners earned ~$57,400 per EH/s in daily block reward revenue.
- The network hashrate in July was ~899 EH/s, difficulty increased ~9% month over month.
- Total miner revenue in July 2025 hit ~$1.66 billion (post-halving record).
- A higher BTC price helps offset the revenue drop from the halving.
- However, margins are tight for miners paying high electricity or hardware costs.
- Some smaller operations are being pushed out or consolidated into larger pools.
- Efficiency gains (cooling, chip design) remain key drivers of competitive edge.
Wealth Distribution
- In 2025, only about 0.18 % of crypto owners hold at least one full BTC.
- The top 100 richest addresses hold ~ 1.25 % of all BTC (e.g., cold wallets of major exchanges).
- It’s estimated that <1 million wallets hold a full BTC, while many entities distribute holdings across multiple addresses.
- A handful of wallets (e.g,. exchange cold wallets) account for large proportions of the circulating supply.
- Historical analyses suggest ~0.01 % of addresses held over 58 % of BTC (older snapshot), signaling systemic concentration.
- The Gini coefficient of Bitcoin wealth remains high, implying that gains are skewed toward major holders.
- Research on mining confirms a “rich get richer” effect, miners with more hashrate get disproportionately larger rewards over time.
- Some formerly dormant wallets (inactive for years) resumed activity in 2025, moving large BTC sums and reshaping the distribution map.
Adoption by Country
- Globally, 12.4 % of people are estimated to own crypto in 2025, a proxy for potential Bitcoin uptake.
- In Europe, adoption reached 8.9 % in 2025.
- LatAm saw 15.2 % national adoption, often as an inflation hedge and remittance tool.
- Asia-Pacific dominates regional adoption, placing 6 of the top 10 adoption countries in that region.
- In 2025, ~4 % of the world population is estimated to own Bitcoin directly.
- Countries holding large state BTC include the U.S. (~198,000 BTC) and China (~190,000 BTC via confiscations).
- El Salvador, one of the first national adopters of Bitcoin, continues to hold ~6,000 BTC in its reserves.
- Government interest in national reserves is rising, Czech central bank has debated allotting up to 5 % of reserves to BTC.
- Some nations move to tax and regulate crypto use more aggressively as adoption increases.
Institutional Ownership
- 71 % of institutional investors have invested in digital assets as of mid-2025.
- 41 % already hold spot crypto, 46 % plan to invest in crypto-backed vehicles in the coming years.
- In 2025, 59 % of surveyed institutions aim to allocate >5 % of AUM to crypto.
- U.S.-listed Bitcoin ETF assets under management (AUM) reached ~$179.5 billion mid-2025.
- Spot ETF net inflows exceeded $14.8 billion during 2025 so far.
- Institutional investors held 22.9 % of US Bitcoin ETF AUM in Q1 2025, down from 26.3 % in Q4 2024.
- Firms like Strategy (formerly MicroStrategy) continue to amass BTC in corporate treasuries.
- Some institutions’ correlation strategies tie Bitcoin exposure with equities or alternative funds.
- Institutional demand is a key driver behind ETF launches, regulatory push, and liquidity deepening.
Bitcoin as a Payment Method
- On-chain daily transactions (discussed earlier) remain the base metric for payment activity.
- Many Bitcoin payments shift off-chain via the Lightning Network, supporting micropayments and low fees.
- Countries with high inflation or weak banking may push Bitcoin usage in p2p payments.
- Merchants integration, more payment processors now accept BTC/crypto in parallel to fiat.
- Some remittance corridors use BTC as an alternative rail (e.g., between Latin America & U.S.).
- Corporate use, Bitcoin revenues, or payments accepted (e.g., as partial settlement) remain niche but growing.
- Stability of BTC price and regulatory clarity remain key barriers to payment adoption.
- Continued improvements (wallet UX, interoperability) may unlock broader usage in retail and services.
ETF Statistics
- As of mid-2025, U.S.-listed Bitcoin ETFs held $179.5 billion in AUM.
- By August 2025, U.S. crypto ETPs (spot and futures) had $156 billion in assets across 76 listings, and Bitcoin commands ~82 % of that.
- Spot ETF net inflows in 2025 (so far) passed $14.8 billion.
- In Q1 2025, institutions held 22.9 % of total U.S. ETF AUM (vs 26.3 % in Q4 2024).
- Some ETF outflows occurred in February 2025; Bitcoin ETFs recorded $2.67 billion in net outflows.
- IBIT (BlackRock’s iShares Bitcoin Trust) saw record single-day outflows of >$300 million.
- New ETFs are launching as regulatory pathways open, increasing competition and options.
- The ETF ecosystem strengthens price discovery as more capital flows directly into BTC.
Bitcoin Correlation with Other Assets
- The 5-year average correlation between Bitcoin and the S&P 500 is ~0.38; during early 2025 turmoil, it rose toward 0.70.
- Static correlation metrics show Bitcoin’s correlation with equities has turned positive in recent years.
- Rolling correlations reach as high as 0.87 in certain periods (2024 event-driven spikes).
- Historically, correlation with bonds and gold has been low or slightly negative.
- During market stress, diversification value drops as Bitcoin’s correlation with equities rises.
- Volatility of Bitcoin remains 2–4× that of equities, increasing risk even when correlation is moderate.
- Some portfolio strategies now treat Bitcoin akin to a growth asset, not purely a hedge.
- The maturation of ETFs and institutional use may further integrate Bitcoin into mainstream market dynamics.
Frequently Asked Questions (FAQs)
≈ $2.186 trillion (up ~74.3 % from one year ago).
~ 71% of institutional investors have exposure to digital assets.
22.9%.
~ 241,700 millionaires and 36 billionaires.
Conclusion
Bitcoin’s statistical landscape paints a picture of maturation, institutional integration, and concentration. Its wealth distribution remains sharply unequal, while adoption spreads across countries even as usage in commerce remains nascent. Institutional flows, especially via ETFs, now influence price dynamics and push correlation with traditional markets higher. As Bitcoin becomes more embedded in the financial fabric, its role may increasingly shift from speculative asset to mainstream portfolio component. Continue exploring how these trends evolve, and where Bitcoin might fit in your own strategy.


