Twitch remains a central hub for live entertainment and gaming. Across gaming, creative arts, and real‑time events, it connects millions every day. In professional esports and charity fundraisers, Twitch enables global engagement in powerful, measurable ways. Dive into this article to explore how Twitch shapes digital culture today.
Editor’s Choice
- Twitch reached over 240 million monthly active users (MAUs) in early 2025.
- An average of 35 million users log in daily.
- Twitch generated an estimated $1.8 billion in revenue in 2024.
- Platform-wide viewing hours hit 20.8 billion in 2024, with already 23.2 billion hours watched by mid‑2025.
- Twitch hosts over 7.1 million active streaming channels monthly in 2025.
- Average concurrent viewers dropped to around 2.29 million in 2025.
- For a single event, “La Velada del Año 5” reached a staggering 9.19 million concurrent viewers on Ibai’s channel.
Recent Developments
- “La Velada del Año 5” shattered records with 9.19 million concurrent viewers on July 26, 2025.
- In 2024, the previous edition reached 3.85 million concurrent viewers, averaging over 3.14 million, and delivered 23.8 million total viewing hours.
- GTA V stayed the top‑streamed game in 2024, 1.4 billion hours watched, with broadcasters streaming 25.8 million hours.
- VTubers hit 1.1 billion hours watched in 2024, reflecting a 10% year‑over‑year increase.
- TwitchCon returns, NA event set for October 17–19, 2025, marking its 10th anniversary.
- TwitchCon Europe was held May 31–June 1, 2025, in Rotterdam with over 11,500 attendees.
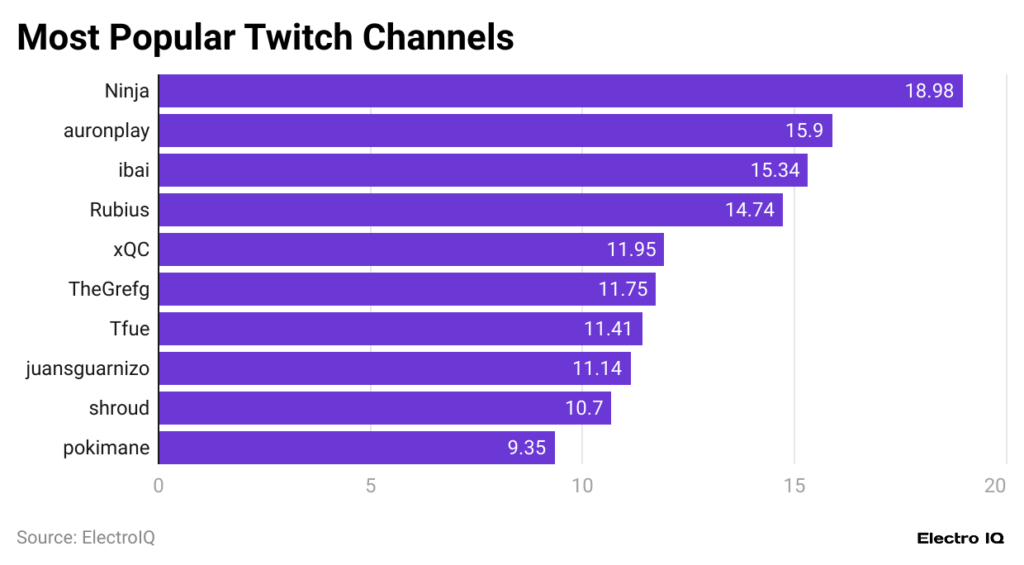
Most Popular Twitch Channels
- Ninja leads with 18.98%, making him the top Twitch channel.
- auronplay holds the second spot with 15.9%.
- ibai follows closely at 15.34%.
- Rubius commands a strong 14.74% share.
- xQC attracts 11.95% of the audience.
- TheGrefg maintains 11.75% popularity.
- Tfue secures 11.41% among viewers.
- juansguarnizo captures 11.14%.
- shroud retains 10.7% share.
- pokimane rounds out the list with 9.35%.
Growth Statistics
- 2025 sees over 7.1 million active streaming channels monthly, slightly lower than 2024’s 7.34 million.
- Viewers have already watched 13 billion hours of content in 2025, compared to 20.9 billion hours in 2024.
- Average concurrent viewers dropped from 2.378 million in 2024 to around 2.29 million today.
- Active streaming channels per moment declined slightly, from 95,700 in 2024 to around 94,900 in 2025.
- Compared to 2023, growth appears minimal or plateaued across key metrics like hours watched and streamer count.
- Yet, overall global MAUs rose to 240 million, confirming long-term expansion.
Usage Statistics
- Twitch sees 240 million monthly active users in 2025.
- 35 million users engage daily, painting a picture of strong habitual use.
- Average concurrent viewership has settled around 2.29 million in early 2025, down from 2.55 million in 2024.
- Viewers in the U.S. alone number 35 million, representing a significant share of global activity.
- U.S. viewership accounts for 20.6%–23.1% of Twitch’s user base, with projections of 36.7 million U.S. users by the end of 2025.
- Globally, hours consumed rose from 20.8 billion in 2024 to 23.2 billion by mid‑2025.
Viewership Statistics
- In the past 30 days, Twitch’s average viewership hovered at 2.2 million viewers, with an all-time peak of around 13.8 million as of July 2025.
- Total viewing hours for 2025 so far stand at 11.75 billion, versus 20.83 billion hours in 2024, a notable decline.
- A live moment snapshot shows approximately 1.2 million viewers watching simultaneously.
- The most-watched channel in the past month was Ibai, with 47+ million viewer hours.
- GTA V remains dominant in overall game-viewing hours.
User Demographics
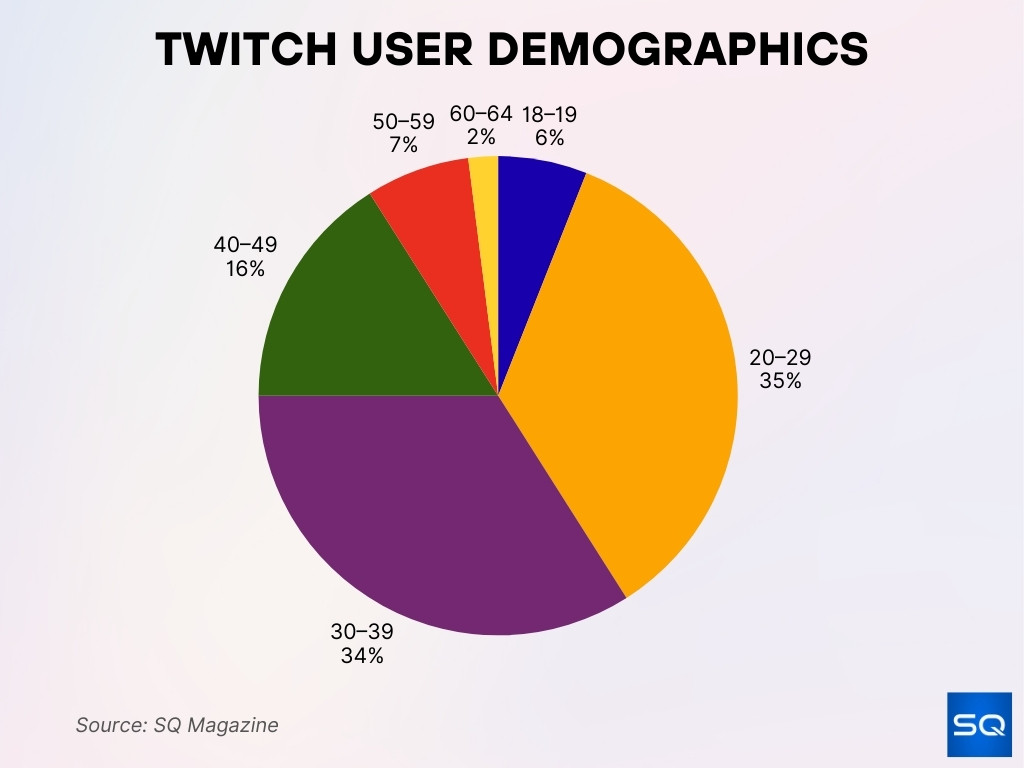
- In the U.S., 35 % of users are aged 20–29, and 34 % are 30–39.
- Users aged 40–49 account for 16 %, 18–19 for 6 %, 50–59 for 7 %, and 60–64 for 2 % in the U.S.
- Globally, Twitch users are 65 % male and 35 % female; in the U.S., that breakdown is 63 % male and 37 % female.
- Average user age hovers around 26 years.
- Over two-thirds of users are under age 35.
- In early platform data, users spent an average of 106 minutes per day watching Twitch.
Streamer Statistics
- Twitch now hosts over 7.4 million unique streamers per month.
- At any moment, about 95,400 channels are streaming simultaneously.
- Smaller streamers may earn $50–$1,500 monthly, mid-tier creators typically earn $5,000–$30,000, and elite streamers, like xQc or Kai Cenat, have reported monthly income exceeding $100,000, especially during high-traffic events.
Revenue Statistics
- Twitch’s total revenue in 2024 reached $1.8 billion, down from $1.96 billion in 2023.
- In Q4 2024 alone, in-app purchases generated $7.68 million globally.
- Exclusive subscription splits, 70/30, for top streamers remain a small-scale incentive tier.
- Many creators now cite reduced Twitch Prime value and lower engagement as key revenue pressures.
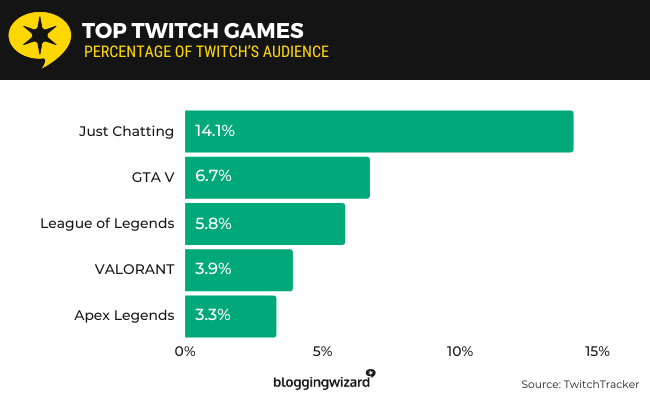
Top Twitch Games by Audience Share
- Just Chatting dominates with 14.1% of Twitch’s audience.
- GTA V holds the second spot with 6.7%.
- League of Legends attracts 5.8% of viewers.
- VALORANT secures 3.9% of the audience.
- Apex Legends rounds out the list with 3.3%.
Engagement Statistics
- The average user once watched 106 minutes per day on Twitch.
- Over 58% of Twitch users spent more than 20 hours per week watching streams, indicating strong habitual engagement across the platform.
- 76 % of users were aged 18–49, signaling that engagement is concentrated among younger adults.
- A majority of users report cutting back on traditional TV viewing in favor of Twitch.
- The move toward VTuber content continues to reshape the time spent engaging with creators.
Most Popular Games on Twitch
- GTA V dominates with 1.4 billion hours watched and 25.8 million hours streamed by creators.
- Other data on additional top titles like Fortnite or League of Legends wasn’t found in current sources, but GTA V clearly leads.
- VTuber-related game categories contribute significantly to viewership growth.
Top Categories on Twitch
- Just Chatting led the pack with 225.6 million viewer hours over the past 30 days.
- Trailing behind, League of Legends (78.5M hours), Counter‑Strike (70.1M), and GTA V (59.0M).
- Other key categories include VALORANT (47.9M), Battlefield 6 (39.6M), IRL (35.3M), Fortnite (31.4M), and Dota 2 (31.2M).
- In the past 7 days, Just Chatting accounted for 46.4 million hours watched and featured over 18,800 channels streaming in that category.
- Just Chatting captured 14% of all watch time during the week, the highest share among categories.
- English-language streams dominated, comprising 50% of total watch time.
- The top 10 individual channels generated 6% of total platform watch time, underscoring both concentration and diversity.
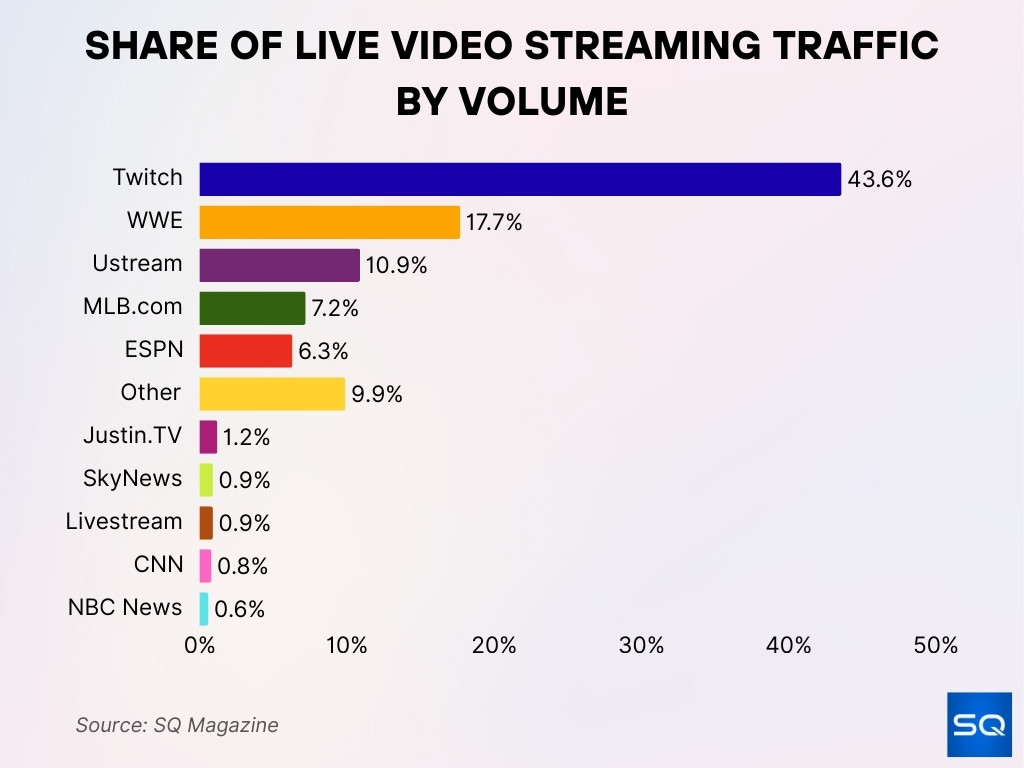
Share of Live Video Streaming Traffic by Volume
- Twitch dominates the market with 43.6% of live streaming traffic.
- WWE follows with a strong 17.7% share.
- Ustream accounts for 10.9% of total traffic.
- MLB.com holds 7.2% of the streaming volume.
- ESPN captures 6.3% of audience share.
- Other platforms collectively contribute 9.9%.
- Justin.TV represents 1.2% of the traffic.
- SkyNews and Livestream each account for 0.9%.
- CNN makes up 0.8% of the total.
- NBC News has the smallest share at 0.6%.
Time Spent Streaming and Watching
- Viewers have watched over 12.6 billion hours on Twitch so far in 2025.
- The most-watched category this year is Just Chatting, with 2 billion hours watched.
- Twitch viewership peaked at over 14 million simultaneous viewers this year.
- Monthly watch time reached 927.9 million hours, while the week accounted for 58.3 million hours.
- Daily watch time hits have peaked at 49.3 million hours.
- Total hours watched in July alone exceeded 1.63 billion hours.
Subscription Statistics
- Subscription splits remain artistically favorable, top streamers generally retain 70% of subscription revenue, with Twitch taking 30%.
- Ironmouse set a new record with around 205,488 paid subscribers during her subathon in late 2023.
- In September 2024, Ironmouse briefly became the most-subscribed channel on Twitch, surpassing Kai Cenat.
- Some creators sustain income through subscription, Bits, and sponsorship combos, though margins vary by tier.
- While exact 2025 figures aren’t widely public, breakaway events like subathons boost subscription metrics significantly.
Peak Concurrent Viewership
- The highest peak this year topped 14 million concurrent viewers.
- Ibai drew a record 9.2 million concurrent viewers during “La Velada del Año 5.”
- May 2025 brought a 9% climb in peak viewership, part of a modest watch-time rebound.
- Even when live channels dipped slightly, watch time rose by 2%, showing deeper engagement per session.
Geographic Distribution
- The United States contributes over 20.6% of viewership and counts around 35 million users, projected to reach 36.7 million by the end of 2025.
- English-language streams make up 50% of total watch time, underlining a strong Anglophone presence.
- Though precise global breakdowns aren’t current, prior data listed top user countries, the U.S. (~93M), Brazil, Germany, France, U.K.
Esports and Major Events Statistics
- La Velada del Año 5 reached 9.2 million concurrent viewers, setting a high-water mark for live Twitch events.
- DreamLeague Season 26 helped boost Dota 2 viewership, earning a place among May’s top categories.
- Esports-related broadcast hours, while not precisely quantified here, continue as a core driver for event engagement and watch milestones.
Conclusion
Twitch continues to command attention. Its diverse content ecosystem, from Just Chatting to esports, reflects both breadth and depth of audience engagement. Viewership numbers remain strong despite slight headwinds, supported by record-setting events like Ibai’s 9.2 million peak. Subscription dynamics, geographic trends, and content innovations like VTubers reshape the platform’s future. Whether you’re a creator planning your next big stream or a brand seeking targeted reach, understanding these trends offers clear insight. The full article brings deeper analysis across all metrics; explore it to stay ahead in live-streaming today.


